Update
11Jul2014
The Big Picture
The NWS creates a geo referenced color coded 1000x1000 pixel PNG image file of
the radar reflectivity in dbz every 5 minutes which we automate downloading.
Each of the 1000x1000 pixels is roughly 0.6 miles wide and high. We determine
which of the pixels is inside our basin and if it is then convert the pixel's
color coded dbz to rainfall, then sum and average for the basin 5-minute average
rainfall. Based on comparing the pixel at a nearby rain gage we can take that
pixel comparison over each hour and adjust each 5-minute average rainfall of our
basin. We are saving the 5-minute BASIN AVERAGE RAINFALL values to our database,
not each pixel value. Re-read this a few times to be sure you know where you are
headed.
STEPS FOR GETTING UP & RUNNING YOUR OWN ADJUSTED RADAR RAINFALL.
All the required Windows
softwares are available free on my web Downloads.
The Steps:
1) Finding your nearest radar site (Install GetNexrad).
2) Creating your basin boundary (Install GetMapArea
or Google Earth Pro and GoogleKML2Text.exe).
3) Convert basin boundary lat/long to radar pixels.
4) Working with GetAccess, GetRealtime, GetGraphs (Install GetRealtime).
5) Putting the basin boundary to work with GetRealtime.
6) Adding real-time rain gages available free on the web.
7) Adjusting the basin radar rainfall.
8) Add a 4-day NWS QPF basin forecast
distributed to 5-minutes.
9) GetGraphs_setup.txt
to keep an eye on it all.
10) What could go wrong... does.
11) Some Questions and Answers about automated retrievals.
12) How about basin rainfall-runoff?
Step #0--Think about how you want to install several folders containing the
GetRealtime system of files. How about:
C:\MyModels
\MyProject1
\GetNexrad
\GetMapArea
\GetAccess
\GetGraphs
\GetRealtime
\MyProject2
\GetNexrad
\GetMapArea
\GetAccess
\GetGraphs
\GetRealtime
In this example you would install as C:\MyModels\MyProject1\. This will keep
several projects and their data organized. You can copy the project folders as
needed for new projects without reinstalling the programs.
STEP #1--FINDING
NEAREST RADAR SITE (for Conyers, GA):
On my website download page:
http://getmyrealtime.com/downloads.aspx
Select the 'Download Full GetNexrad'
button, save, and run the setupGetNexrad.exe file to install GetNexrad. You may
decide to install GetNexrad as a sub folder in your Sewer Model folder like
C:\MyModels\MyProject1\. You can install GetNexrad over and over if you decide
you would like to install it somewhere else or for seperate projects.
Tip: On
Windows 7 or Windows 8 always run these setups as Administrator. From Windows
Explorer I think you right click on the setup.exe file and select Run as
administrator.
GetNexrad is not the main program you eventually will be using but is very
useful for viewing radar and will become a great tool for watching the
approaching storms and plotting your database values at their locations and much
much more.
Once GetNexrad is installed, to find the nearest radar fire up GetNexrad.exe,
click 'Select Radar From File', and select 'USA_N0Q.png' and an old radar image
will load. Click 'Overlays', 'Create Overlay/Topo' to see where we are. We are headed to Conyers, GA so double
click on the state of Georgia and create your overlay again and a map of the Southeast will load and a current
radar image (mosaic of several radar sites). Turn on 'Range' by checking the
'Range' check box on the GetNexrad menu and this will display all the radar
sites in yellow. Start zooming in on Conyers using the mouse wheel and also
dragging the radar image around... so where is Conyers???... Ah, I found it on
the Web, very colorful downtown buildings, just east of Atlanta, home of the
Dukes of Hazzard. Double click on Conyers and the nearest radar 'FFC' will be
selected for you. Create your overlay again and a new map will be displayed
centered on the FFC radar.
Be sure your FFC radar site product is
N0Q not the old N0R.
You can zoom and drag
the radar around. To start a radar loop, right click the radar image, check the
'Auto updating' and 'Auto delete' check boxes, set the Hours to 0.5, and then
click the big 'Update Radar' button and you will be viewing a 1/2 hour loop.
Close GetNexrad and re-fire it back up and repeat navigating from the USA map,
to the regional mosaic, to the actual radar and note how the text in the upper
right changes. This is your current
Gifs folder and will be needed in Step
#3. We will be using PNG image files, not GIFs but back in the day, GIFs
were all there was.
So
now we know FFC is the nearest radar.
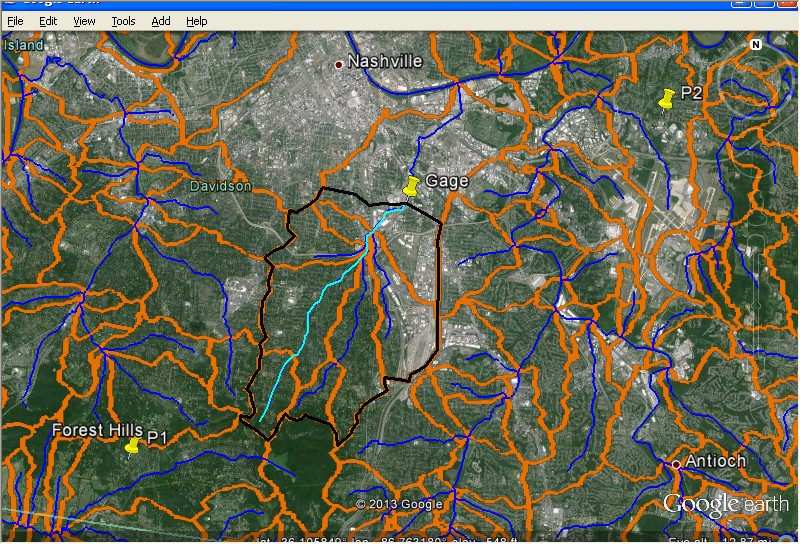
STEP #2--CREATING YOUR BASIN BOUNDARY
(Installing GetMapArea):
On my website download page select the 'Download Full
GetMapArea' button, save, and run the setupGetMapArea.exe file to install.
Again, you may decide to install as a sub folder to your Sewer Model
(C:\MyModels\MyProject1\) and multiple installations are ok for seperate
projects. Remember to Run setups as Administrator.
We will be creating a
watershed boundary text file with either a tab or comma delimited latitude and
longitude pairs on each line, with 1 title line and at least 8 points on the
boundary. If you already have your
boundary in GIS and can export a lat,long projection text file like this, then
you can skip the rest of this step.
Here is what we are after:
Tallapoosa Lower
Main Fork Boundary
-85.57492, 33.31168
-85.58772, 33.30901
-85.60053, 33.31168
-85.61014, 33.31839
-85.61654, 33.31571
-85.62454, 33.32509
....etc, etc....
at least 8 points
tab
or comma delimited
either long, lat or lat, long.
And the text file name should
contain 'boundary' like:
TallapoosaLowerMainForkBoundary.txt
Fire up
GetMapArea.exe, select 'Load/Save Map', 'EPA WATERS KMZ', and this will load
Google Earth with the EPA watershed boundaries and stream lines. On Google
Earth, select 'View', 'Sidebar' and check Places, Temporary Places, MyWATERS,
Streams and also Catchments.
Important Update 8/24/2016: The following instructions
below can alse be done this way. The free Googe Earth Pro can
save its 'Add', 'Polygon' to KML file so you can now use my
GoogleKML2Text.exe from the download page to convert Google's KML to
text for use by LatLongPixelsFromFile.exe. You can use GetMapArea to load
the EPA Waters hydro units and catchments and then use Googles 'Add',
'Polygon' and save to kml.... Carry on.
Zoom in on Conyers, GA and when your catchment of
interest is displayed, add two Placemarks by 'Add', 'Placemark' and drag one to
the lower left portion of the screen and one to the upper right portion of the
screen. Copy the latitude and longitude of each placemark to Notepad to be used
later for setting the image scale.
This is critical,
make sure your Google Earth
is oriented directly north by clicking on the 'N' on the navigation icon. Now
capture the Google Earth screen to your clip board with Alt*PrtScrn. Close
Google Earth and Discard Temporary Places. On the GetMapArea menu select 'Paste
from clipboard' and the Google image will be set.... something like this:
Right lick the GetMapArea
image, select 'Set Scale' and follow the prompts on window caption to click the
1st and 2nd placemarks and select Longitude/Latitude from the scaling options.
Enter the P1 and P2 placemarks long, lats like:
-88.22222,34.22333,-88.01111,34.33333
Hit OK, and following the window caption
prompts, Right click for menu, select 'Start Area', and start digitizing your
boundary. When finished, Right click for menu and select 'End Area/Line'. Right
click on the data box and save the lat, longs to a text file using a file name
with 'boundary'in it. Close GetMapArea.
Note: If you have graphic images of your
sewer basins you can Alt*PrtScrn them to the clip board and paste them into
GetMapArea instead of using Google Earth. You can then determine 2 points near
the screen diagonal for setting the lat/long scaling. The X vs Y aspect is not
important so long as your image is oriented exactly due north.
We now have our
lat/long boundary text file named something like xxxBoundary.txt.
STEP
#3--CONVERT BASIN BOUNDARY LAT/LONG TO RADAR PIXELS:
Copy your xxxboundary.txt
file of lat/longs from your GetMapArea folder to the
...\GetNexrad\LatLongPixels\ folder. Fire up LatLongPixelsFromFile.exe that is
in this folder, select from the menu 'File', 'Open Input File', and select your
xxxboundary.txt file.
Next from the menu select, 'Convert', 'LatLong to Pixel'.
Your Radar Site Code is 'FFC', your Radar Product Code is 'N0Q' with a zero, not
an O, check 'Ridge 2', and enter a 'Datatype_Site_ID' like '-10100'. The
Datatype_Site_ID's will be covered later. Select 'OK'. To save your conversion
from the menu select 'File', 'Save Conversion'.
Close LatLongPixelsFromFile.exe.
We now have a
bounday file in radar pixel coordinates named
NexradBoundaryFFC-10100Q.txt referenced to a 1000x1000 pixel N0Q radar image. Do
not rename this file because its naming convention is important. You may wish to
edit the files first line title line to something more appropriate.
The last
step in making the boundary file usuable by both GetNexrad.exe and
GetRealtime.exe is to create a
point file showing all the radar pixels that are
within your pixel boundary. To do this copy the file
NexradBoundaryFFC-10100Q.txt to the ...\GetNexrad\MyRadarGifs\ folder. This folder
is our Gif's folder from Step #1. You can fire up GetNexrad.exe and look
at the upper right hand text box to refresh your memory. (Note:
After completing Step #5, this Gif folder location will change.)
Fire up
GetNexrad.exe and from the menu click 'Select Radar File Image', select
'FFC_N0Q.png' that was created in Step #1. Choose your boundary ID -10100Q xxx from the boundary
list by double clicking on it. The screen will go black which is fine, from the
menu select 'Creat Point File', select the option 'No Conversion', and hit
'Create File'.
Your basin pixels inside your boundary will be displayed as a
small red area. Zoom in on this red area to be sure there are no holes in this
red area. From the menu click 'Select Radar File Image', select FFC_N0Q.png
again, select your boundary from the list by double clicking again, and this
time your boundary will be displayed as a red outline on the radar screen. Zoom
in as far as you like to see where your boundary lies.
We now have a basin area
on the radar screen ready to start measuring unadjusted radar rainfall. If you
start a radar loop going, GetNexrad will display the rainfall accumulations
within your boundary. Note that you normally will not be using GetNexrad to
create your unadjusted radar rainfall record. The next step is needed for creating and
saving the unadjusted radar rainfall using GetRealtime.exe in real-time and for
historical studies.
STEP #4--INSTALLING GETREALTIME (GETACCESS, GETREALTIME,
GETGRAPHS):
On my website download page select the 'Download Full GetRealtime'
button, save, and run the setupGetRealtime.exe file to install. Again, you may
decide to install as a sub folder to your Sewer Model and multiple installations
are ok for seperate projects. Remember to Run setups as Administrator. My
example install folder is C:\MyModels\MyProject1\.
To get a feel for how these 3
exe programs work we will run each and then clear out all the data and then
start over for real.
GETACCESS: Windows XP and below users without MS Access 2003 can download
the free runtime support from my web download page. The runtime support
ships with Vista and above.
Fire up GetAccess.exe and a list of example stations will be displayed (maybe).
If the list appears then GetAccess connection string to the MS Access database
file is correct (fat chance) and you can close GetAccess. If a connection error
occurs then click the 'Connection' button and set the connection string to where
GetAccess was installed and the 'GetAccessHDB.mdb' file is located.
Your
connection string could look like:
Provider=Microsoft.Jet.OLEDB.4.0;Data Source=
C:\MyModels\MyProject1\GetAccess\GetAccessHDB.mdb;User Id=admin;Password=;
Then
click the 'SITE LIST' button to display the example stations to test your
connection. Keep this connection string on Notepad so you can paste it when
needed below. If you lose it then fire up GetAccess.exe and hit 'Connection' to
copy it.
Close GetAccess.
GETREALTIME: Fire up GetRealtime.exe. If you had to change the GetAccess
database connection string above, then before retrieving click the 'Select
Station from List' button, then click the 'Connection' button and set the
connection string to what you set for GetAccess above and be sure to click the
'Save' button after changing the connection string. Set the 'Days' to 7. Click
'Start Realtime Retrieval' button. This will retrieve the past 7 days of daily
and hourly values for the 107 stations on the station list and write them to the
GetAccess database. Close GetRealtime.
(Note: As of 6/1/2014 Wunderground weather station retrievals are very very very
very very S*L*O*W. So send them a squawk sheet.)
GETGRAPHS: After retrieving the 107 example
stations data for the past week we can view the data. If you had to change the
connection string above then you will have to change GetGraph's connection also.
To change the connection string, open Windows Explorer, find the GetGraphs
installed folder (C:\MyModels\Project1\GetGraphs\). Double click on the file
'GetGraphs_setup.txt'. This will open the Notepad editor and you can change the
connection string to that used above.
Fire up GetGraphs.exe and several graphs of
rainfall data should be displayed as well as a web page in the upper right. Some
of these example stations and web pages may no longer be available. Click on any
graph to continue viewing more data graphs. The reason for a whopping 107
stations is to show examples of most of the retrieval types that can be done.
You can refer to these examples for your own GetRealtime_setup.txt file for your
future retrievals as we shall see below.
That's it. You now have an idea of
where we will be headed. Did you notice that GetAccess, GetRealtime, and
GetGraphs each have text file setups,
GetAccess_setup.txt,
GetRealtime_setup.txt, and
GetGraphs_setup.txt. You can view and edit these
setups with Notepad or from each program's menu. You will soon see that using
Notepad can be the best way for edits.
CLEAR OUT EXAMPLE DATA IN DATABASE: We
now want to delete all the example data in the database and add our stations of
interest. The database table 'ExampleRsite' has all the stations in our example
so you can always look at it in the future but is never used. We will be working
with the table 'rsite' instead.
The database tables are inside the MS Access
file GetAccessHDB.mdb. We will use GetAccess to execute SQL commands to delete
the unwanted example data. Fire up GetAccess.exe and look up at the top for the long
text box containing 'SELECT DISTINCT etc.....'. Check the small check box to its
left and this long text box can now be edited. Replace what's there with the SQL
statement 'DELETE * FROM rday;' and then hit the 'GO' button. The SQL is
executed and ALL the contents of table 'rday' are deleted. Repeat with the
database tables below:
DELETE * FROM rday;
DELETE * FROM rhour;
DELETE * FROM
runit;
DELETE * FROM rdaymax;
DELETE * FROM rdaymin;
DELETE * FROM runitshift;
DELETE * FROM rupdate;
DELETE * FROM rsite;
You are now an SQL certified expert in deletions and not to worry, thats the
only SQL you need to know.
STEP #5--PUTTING THE BASIN BOUNDARY TO WORK WITH GETREALTIME:
We
had been using GetNexrad to view our boundary and radar images in it's sub
folder \MyRadarGifs\. We will no longer be using this GetNexrad subfolder. So
copy your Boundary and Point files (NexradBoundaryFFC-10100Q.txt and
NexradPointFFC-10100Q.txt) to where your GetRealtime.exe is located
(C:\MyModels\MyProject1\GetRealtime\).
Because we will be using GetNexrad to
view files in this new location from now on we need to set GetNexrad's default
view location to the GetRealtime.exe folder. Fire up GetNexrad.exe, from the USA
map double click on Georgia, and again from the regional mosaic double click
near Conyers, GA and it will prompt for selecting your boundary so do so. To
save this default view with your boundary, right click the radar image and
select 'Save Setup'. Just to be sure, check that the FFC radar is displayed.
Note the folder being used now in the upper right text box.
Both GetRealtime and GetNexrad will now be using this as their
Gifs
folder.
Close GetNexrad.
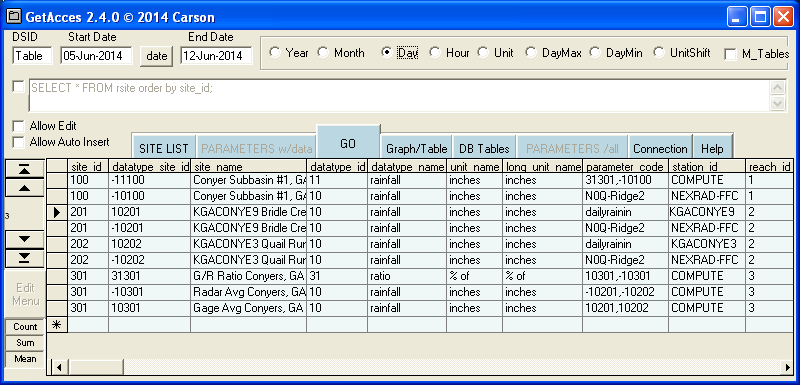
To retrieve radar info for our boundary We need to set the
database info for our boundary site in the Access database file. Fire up
GetAccess.exe, click 'DB Tables', select the table 'rsite' on the left, check
the 'Allow Edit' box on the left and hit 'GO'. We are set to enter our boundary
info.
(Quick dataype_site_id tutorial: Our example dsid is -10100 and is made up
of datatype 10 for rainfall and site_id 100. Runoff would be 30100, temperature
17100. Use negative dsid's for computed values as opposed to gage values.)
Click
the 'Edit Menu' on the left and select 'Add by Datatype' and enter our site_id
as 100 and select '10 rainfall, inches' as the datatype and hit 'Add'. Note that
we now need to edit the datatype_site_id to a negative value as -10100.
Edit the
site_name, parameter_code is 'N0Q-Ridge2', station_id is 'NEXRAD-FFC', and state
is 'GA'.
To send this data record to the database click any cell on the bottom
row. Now hit the 'Site List' button and you will see your first station listed.
Close GetAccess.
UPDATE: You can skip the table Rsite data entry above and go to setting
up the GetRealtime_setup.txt file. Then after entering some lines, select a
line, Right Click and it will ADD most (BUT NOT ALL) of the needed info to table
Rsite.
Now to setup GetRealtime. Fire up GetRealtime.exe, click
'Select Station From List', and you will see all the old info we need to
clear... maybe. Click 'Edit w/Notpad'. Turn off Notepad's Word Wrap and maximize
the window. Insert a few blank lines below 'Station_ID;...' for inserting our
new station. Now scroll down through the old info until you find:
NEXRAD-FWS;
-10752; Rainfall; Dallas N0Q Radar at Wundergage; 0
Copy and paste this line
directly below the 'Station_ID;...' line and edit it to look like this and add
'END' on the next line:
NEXRAD-FFC; -10100; Rainfall; Conyer Subbasin #1, GA; 0
END
Exit and save Notepad. Note that ';' is not a ',' and is a very important
distinction. From the GetRealtime menu click 'Select Station From List' and you
will see just the one line for our basin. Click any cell of the line and then
click 'OK'. Note that the DSID and Station Name are displayed.
To set the radar
source check 'Scheduled Batch' to bring up a menu and check 'Iowa Mesonet
Radar...' and then uncheck 'Scheduled Batch'. Check the top 4 'Write..' boxes
down through 'Write Unit Values'.
ARE YOU READY!?!?!?! Cross your fingers and
click 'Start Realtime Retrieval'...
Whooops... click 'No' to the 'Starting date
is newer...' message and recross your fingers and...
VIOLA!!! You should be
viewing a radar image. Click 'Next' or 'Continue' to retrieve the past 4 hours
of radar. The 5-minute unit values, hourly and daily sums have been written to
the database so let's view them.
Close GetRealtime and fire up GetAccess. From
the Site List select our only station and click 'PARAMATERS w/data', then click
the 'Unit' option from the top of the menu, and then 'GO'... Thar she blows!!!
Congratulations! You are now a Certified Radar Professional (CRP)... not to rain
on your parade but those radar values are worthless for the durations we will be
using so we now need to adjust them. When you can adjust them, only then will
you become a Certified Radar Adjustment Professional aka CRAP'er! You still have
some way yet to go before you can sling that coveted title around like a true pro.
STEP
#6--ADDING REAL-TIME RAIN GAGES:
If you don't operate your own real-time
rainfall network, then you can use free Wunderground rain gages. I have scouted
your county area and found 6 possible Wundergages for use. Four have 15-minute
punches which is fine but they all punch around 10 minutes after the hour and
that is bad. Airports punch 7 minutes before the hour so that is also bad but
some times that's all you got. You could pursuade these 4 Wundergage owners to
set their punch on the hour or a minute or 2 later if you let them know how
important their sewer connection is (or lack there of). Also, you could take a
couple of your old XP boxes from the office and send them home with co-workers
to operate Wundergages from their homes with a sawbuck added to their paychecks.
But the current 5-minute gages we will use are:
-10201 KGACONYE9 Bridle Creek,
GA > 33.647 -84.083 > 774 ft
-10202 KGACONYE3 Quail Run, GA > 33.581 -84.045 >
660 ft
You can copy the above info from each gage site once you figure out how
to operate www.wunderground.com's
WunderMap. I added the leading -10201 and
-10202 as our datatype_site_id's we will be using. I know its a negative value
for a gage but we will start with the radar at the gage. For the actual gage
record we will use the same but positive dsid's. Wundergages are always being
added so you should check each month to see if anything new is available.
If you
do operate your own rain gage network then contact me on how to connect them or
see my Help web page for Compute-Get.
Adding a rain gage's radar location is much
easier than a basin bounday. Fire up
...\GetNexrad\LatLongPixels\LatLongPixels.exe
For the Bridle Creek gage our
Radar Site Code is FFC-N0Q, check the Ridge 2 box, LongitudeX is -84.083,
LatitudeY is 33.647, and click the 'Convert' button and the conversion to radar
pixel x,y is shown. Close the window and you will be prompted 'Do you want to
create a single point boundary' so click 'YES'. The next prompt 'Would you like
the 4 closest pixels included'click 'NO'. Enter Datatype_Site_ID is -10201.
Enter Site Title is 'KGACONYE9 Bridle Creek, GA' and click OK. This time BOTH
the boundary file and point file are created for us and we are prompted to 'Copy
both files to your Nexrad Radar Gif file directory.' Click OK and repeat using
the lat/long for the Quail Run, GA gage info above and close (click NO).
Copy
the 4 files just created to our 'Nexrad Radar Gif file directory'. Remember we
changed our default gif file directory to GetRealtime.exe's folder:
C:\MyModels\MyProject1\GetRealtime\
Fire up GetNexrad.exe and we can display the
location of our basin and both Wundergages at the same time. When prompted for a
boundary from the list select 'Show current list values'. The Wundergage
locations will be marked with an orange 'X' meaning no data for the past 2 days
is available. We haven't downloaded any yet. So cloxe GetNexrad and we will do
that.
Like we did in step #5 we need to set the database info for our Wundergage
sites in the Access database file. Fire up GetAccess.exe, click 'DB Tables',
select the table 'rsite' on the left, check the 'Allow Edit' box on the left and
hit 'GO'. We are set to enter our boundary info.
RADAR AT GAGE: -10201 KGACONYE9
Bridle Creek, GA.
Click the 'Edit Menu' on the left and select 'Add by Datatype'
and enter our site_id as 201 and select '10 rainfall, inches' as the datatype
and hit 'Add'. Note that we now need to edit the datatype_site_id to a negative
value as -10201.
The site_name is 'Bridle Creek, GA', parameter_code is
'N0Q-Ridge2', station_id is 'NEXRAD-FFC', and state is 'GA'.
To send this data
record to the database click any cell on any other line.
Now for actual
Wundergage rainfall record. Click the 'Edit Menu' and repeat above this time the
datatype_site_id will be positive 10201, the site_name is 'Bridle Creek, GA',
parameter_code is 'dailyrainin', station_id is 'KGACONYE9', and state is
'GA'.
Now repeat for the radar and gage at:
-10202 KGACONYE3 Quail Run, GA
Click
on any other data line to send the record to the database. To veryify our sites
have been added, click the 'Site List' button and you will see your first three
stations listed. Close GetAccess.
Now to setup GetRealtime. Fire up
GetRealtime.exe, click 'Select Station From List', and you will see our only
boundary line. Click 'Edit w/Notpad'. Turn off Notepad's Word Wrap and maximize
the window and edit our data part to look like:
Station_ID; Datatype_Site_ID;
Datatype_Name; Site_Name; base1;etc...
NEXRAD-FFC; -10100; Rainfall; Conyer
Subbasin #1, GA; 0
NEXRAD-FFC; -10201; Rainfall; Bridle Creek, GA
NEXRAD-FFC;
-10202; Rainfall; Quail Run, GA
KGACONYE9; 10201; Rainfall; Bridle Creek, GA
KGACONYE3; 10202; Rainfall; Quail Run, GA
END
Exit and save Notepad.
To set the
radar source check 'Scheduled Batch' to bring up a menu and check 'Iowa Mesonet
Radar...' and then uncheck 'Scheduled Batch'. Check the top 4 'Write..' boxes
down through 'Write Unit Values' and this time we will save our settings so we
won't have to do this each run. Click 'Select Station From List' and click
'Save'.
From the GetRealtime menu click 'Select Station From List' and highlight
all 5 rows of stations and then click 'OK'. Note that the Station Name is
displayed as 'Selected range of stations'. You could run each line one at a time
if you don't feel brave or our range bombs out. Now set 'Days' to 1 and click
'Start Realtime Retrieval'.
And.... ???? Hopefully all runs as planned.
If not, exit GetRealtime.exe and restart it and go through just the steps in the
paragraph above but 1 station at a time until you get an error message and then
sort that out, usually the error is back in GetAccess table 'rsite' or
insufficiant data in downloads.
STEP
#7--ADJUSTING THE BASIN RADAR RAINFALL:
To adjust our radar rainfall over our
basin we will adjust using the ratio:
GAGE_avg / RADAR_avg
So we now need the
average of our 2 Wundergages
HOURLY and and the average of our 2 radars at the
gages
HOURLY.
Let start with the GetRealtime.exe setup first. Fire up
GetRealtime.exe and click 'Select Station From List', click 'Edit w/Notpad', and
scroll down until you find:
COMPUTE-Hour; 10035; Rainfall; Average Las Vegas
Rainfall; 0; 0; (P1+P2+P3)/3
and
COMPUTE-Hour; 31752; Ratio; Dallas Wundergage /
Radar Ratio; 0; 0.05, 1.0, 3; P1/P2
Copy and paste these to our data area and
edit the last 3 lines as:
Station_ID; Datatype_Site_ID; Datatype_Name; Site_Name; base1;etc...
NEXRAD-FFC; -10100; Rainfall; Conyer Subbasin #1, GA; 0
NEXRAD-FFC; -10201;
Rainfall; Bridle Creek, GA
NEXRAD-FFC; -10202; Rainfall; Quail Run, GA
KGACONYE9; 10201; Rainfall; Bridle Creek, GA
KGACONYE3; 10202; Rainfall; Quail
Run, GA
COMPUTE-Hour; 10301; Avg Rainfall; Avg of Wundergages; 0; 0; (P1+P2)/N
COMPUTE-Hour; -10301; Avg Rainfall; Avg of Radars; 0; 0; (P1+P2)/N
COMPUTE-Hour;
31301; Ratio; G/R Ratio at Wundergages ; 0; 0.02, 1.0, 3; P1/P2
END
Close
Notepad and save. Fire up GetAccess.exe add these 2 avg rainfall records to table
rsite:
(remember how from above.)
For
the Wundergage average:
The dsid is '10301', site_name is 'Gage Avg Conyers,
GA', parameter_code is '10201,10202', station_id is 'COMPUTE', and state is
'GA'.
For the radar avg at the gages:
The dsid is '-10301', site_name is 'Radar
Avg Conyers, GA', parameter_code is '-10201,-10202', station_id is 'COMPUTE',
and state is 'GA'.
For the datatype 31 ratio record:
The dsid is '-31301',
site_name is 'G/R Ratio Conyers, GA', parameter_code is '10301,-10301',
station_id is 'COMPUTE', and state is 'GA'.
Click off last edit to send record
to the database and hit Site List to see what you got. You can run
GetRealtime.exe to view your averages and ratios... if any.
*** Here is a tip to
verify what is being averaged and ratioed. If you run GetRealtime on just one
station at a time you can view a text file
'computeIn.txt' with Excel and verify
the computations by hand. ***
Now we have hourly ratios that we can apply to our
basin 5-minute rainfall. So add the basin radar rainfall adjustments as the last
line:
Station_ID; Datatype_Site_ID; Datatype_Name; Site_Name; base1;etc...
NEXRAD-FFC;
-10100; Rainfall; Conyer Subbasin #1, GA; 0
NEXRAD-FFC; -10201; Rainfall; Bridle
Creek, GA
NEXRAD-FFC; -10202; Rainfall; Quail Run, GA
KGACONYE9; 10201;
Rainfall; Bridle Creek, GA
KGACONYE3; 10202; Rainfall; Quail Run, GA
COMPUTE-Hour; 10301; Avg Rainfall; Avg of Wundergages; 0; 0; (P1+P2)/N
COMPUTE-Hour; -10301; Avg Rainfall; Avg of Radars; 0; 0; (P1+P2)/N
COMPUTE-Hour;
31301; Ratio; G/R Ratio at Wundergages ; 0; 0.02, 1.0, 3; P1/P2
COMPUTE-unit;
-11100; Adj Rain; Conyer Subbasin #1, GA; 0; -1, 1.0,0.3,1.5; P1*P2
END
For the
GetAccess adjusted radar record in table rsite:
The dsid is '-11100', site_name is 'Conyer
Subbasin #1, GA', parameter_code is '31301,-10100', station_id is 'COMPUTE', and
state is 'GA'.
You can view what the ratio and adjust parameters are usig
GetRealtime's Wizard by selecting the Ratio line and clicking Wizard and
use the mouse hover tooltips and refer to Help for more discussion on these parameters.
STEP #8--ADD A 4-DAY NWS QPF BASIN FORECAST:
So for our last step and to tidy
things up, edit your GetRealtime_setup.txt to look like this (the '*' means skip
this line):
Station_ID; Datatype_Site_ID; Datatype_Name; Site_Name; base1;etc...
******; ******; ******; *****Forecasts*****
FORECAST-NWS; -11100; Forcast Rain;
Conyer Subbasin #1, GA; 0; 33.67,-84.02,2
******; ******; ******; *****FFC
RADAR*******
NEXRAD-FFC; -10100; Rainfall; Conyer Subbasin #1, GA; 0
NEXRAD-FFC;
-10201; Rainfall; Bridle Creek, GA
NEXRAD-FFC; -10202; Rainfall; Quail Run, GA
******; ******; ******; *****Wundergages*******
KGACONYE9; 10201; Rainfall;
Bridle Creek, GA
KGACONYE3; 10202; Rainfall; Quail Run, GA
******; ******;
******; *****Ratios*******
COMPUTE-Hour; 10301; Avg Rainfall; Avg of
Wundergages; 0; 0; (P1+P2)/N
COMPUTE-Hour; -10301; Avg Rainfall; Avg of Radars;
0; 0; (P1+P2)/N
COMPUTE-Hour; 31301; Ratio; G/R Ratio at Wundergages ; 0; 0.02,
1.0, 3; P1/P2
******; ******; ******; *****Adjusted Rainfall*******
COMPUTE-unit; -11100; Adj Rain; Conyer Subbasin #1, GA; 0; -1, 1.0,0.3,1.5;
P1*P2
END
The forecast is the same dsid as the adjusted radar and radar will
overwrite the forecast as it comes in. It could be different, but if you are to
use the forecast for runoff computations you probably want the same dsid.
GetAccess table rsite:
You may want to get 24 hours of radar for the sites for yesterday using the
'History' button and 'OK' on the dates. Once GetAccess has a few more hours of
radar to adjust, the adjusted rainfall will run fine. You do not have to get the
past 24 hours ever again unless you want to.
When it is raining you can run JUST THE RADAR every 30 minutes with 'Batch'. You
may have to turn off your PC's hibernation or power settings. You can then run
everything once or twice a day to see how things are going.
If the Wundergages are downloading real slow it is because Wunderground was
recently sold to The Weather Channel and they have been working on 'improving'
their website experience. So sometimes the downloads are fast and somedays they
take quite a while.
So
there you have it. But now that you have the adjusted basin rainfall, why not do
your buddies in the Streets and Roads Department a favor and tell them how much
flooding to expect from your basin... 4 days in advance!!!
I forgot about
GetGraphs.exe used to display your data and to show the rainfall
IDF depths and frequencies. For that here is an example GetGraphs_setup.txt that
you can start with.
Open your GetGraphs_setup.txt and completely delete everything and then pase the
below and save. Fire up GetGraphs.exe and you can view the pages and
titles. Close GetGraphs and open the GetGraphs_setup.txt with Notepad and
start replacing the first OR both first and second dsid's with your dsid's. You
always have to have the 12 lines for each page. And don't forget the
connection string from above.
Days = 3 ; End Day +4
Plot Unit Values = False
Include Daily Max/Min = False
Big Current Value = True
Auto Paging = False, 10 Font Name = Tahoma, Tahoma
Database Connection String=
Provider=Microsoft.Jet.OLEDB.4.0;Data Source=
C:\MyModels\MyProject1\GetAccess\GetAccessHDB.mdb;User Id=admin;Password=;
Owner ID=
Page; graph; dsidnumber; parametername; stationname; hrmarker;
daymarker; logyscale; backcolor;back2color; hrcolor; daycolor; highwatch;
lowwatch; watchcount; series2; frequencies & routings>>
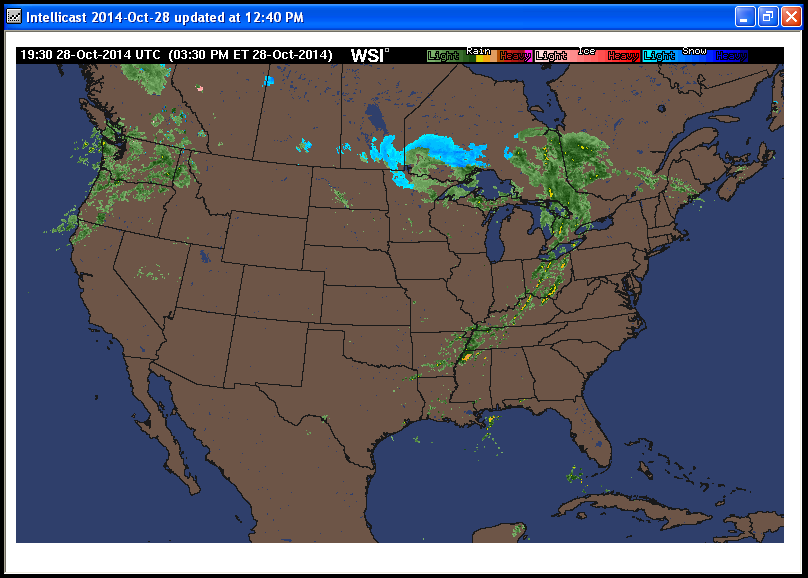
1 ;Intellicast; 10 ; 10
;-1
1 ;-1 ;Web
Screen;http://images.intellicast.com/WxImages/RadarLoop/usa_None_anim.gif; 0 ; 0
; 0 ; 0
2 ;
3 ;
4 ;
5 ;
6 ;
7 ;
8 ;
9 ;
10 ;
11 ;
12 ;
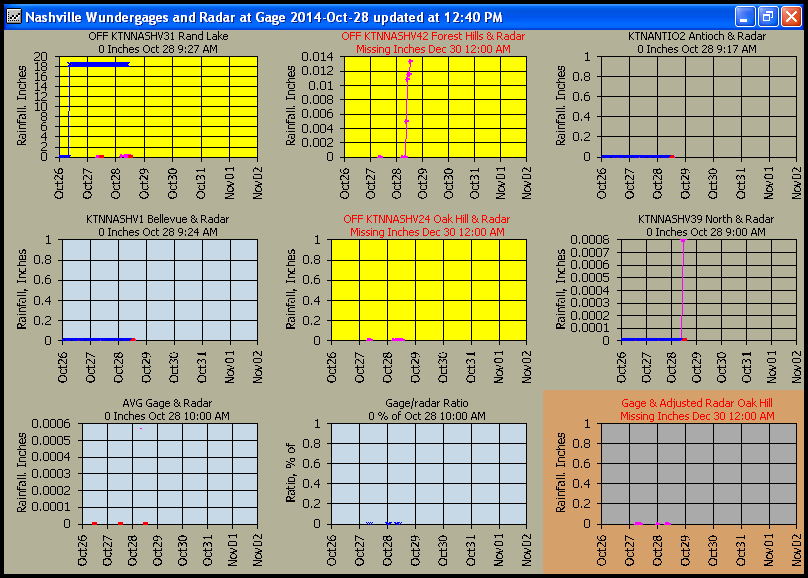
2 ;Nashville Wundergages
and Radar at Gage; 8 ; 9 ;-1
1 ; 10811 ,-10811 ;Rainfall;OFF KTNNASHV31 Rand
Lake; 1 ; 2 ; 0 ; 9941427 ; 65535 ; 16711680 ; 255 ;;;; 2
2 ; 10812 ,-10812
;Rainfall;OFF KTNNASHV42 Forest Hills & Radar; 1 ; 2 ; 0 ; 9941427 ; 65535 ;
16711680 ; 255 ;;;; 2
3 ; 10813 ,-10813 ;Rainfall;KTNANTIO2 Antioch & Radar; 1 ;
2 ; 0 ; 9941427 ; 9941427 ; 16711680 ; 255 ;;;; 2
4 ; 10814 ,-10814
;Rainfall;KTNNASHV1 Bellevue & Radar; 1 ; 2 ; 0 ; 9941427 ; 15194567 ; 16711680
; 255 ;;;; 2
5 ; 10816 ,-10816 ;Rainfall;OFF KTNNASHV24 Oak Hill & Radar; 1 ; 2
; 0 ; 9941427 ; 65535 ; 16711680 ; 255 ;;;; 2
6 ; 10817 ,-10817
;Rainfall;KTNNASHV39 North & Radar; 1 ; 2 ; 0 ; 9941427 ; 9941427 ; 16711680 ;
255 ;;;; 2
7 ; 10815 ,-10815 ;Rainfall;AVG Gage & Radar; 0 ; 2 ; 0 ; 9941427 ;
15194567 ; 16711680 ; 255 ;;;; 2
8 ; 31815 ;Ratio;Gage/radar Ratio; 1 ; 2 ; 0 ;
9941427 ; 15194567 ; 16711680 ; 255 ;;;; 0
9 ; 10816 , 11816 ;Rainfall;Gage &
Adjusted Radar Oak Hill; 1 ; 2 ; 0 ; 7053526 ; 11184810 ; 16711680 ; 255 ;;;; 2
10 ;
11 ;
12 ;
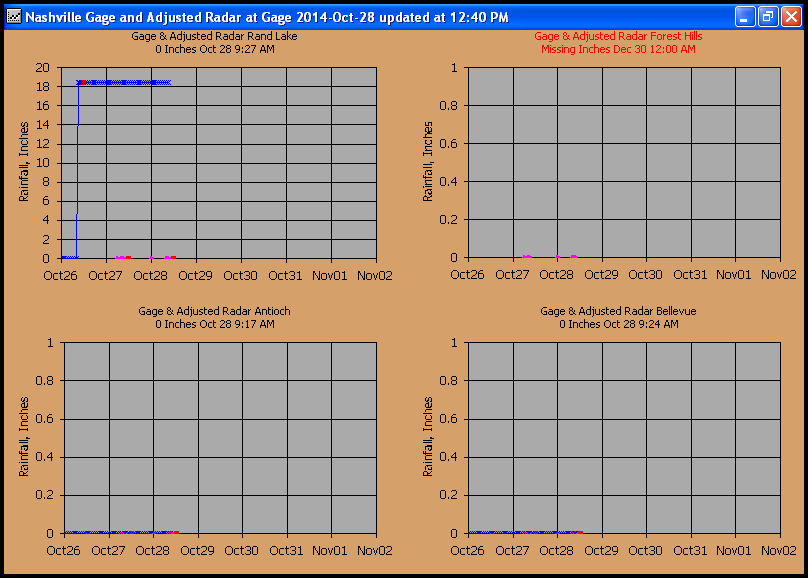
3 ;Nashville Gage and Adjusted Radar at Gage; 8 ; 9 ;-1
1 ; 10811
, 11811 ;Rainfall;Gage & Adjusted Radar Rand Lake; 1 ; 2 ; 0 ; 7053526 ;
11184810 ; 16711680 ; 255 ;;;; 2
2 ; 10812 , 11812 ;Rainfall;Gage & Adjusted
Radar Forest Hills; 1 ; 2 ; 0 ; 7053526 ; 11184810 ; 16711680 ; 255 ;;;; 2
3 ;
10813 , 11813 ;Rainfall;Gage & Adjusted Radar Antioch; 1 ; 2 ; 0 ; 7053526 ;
11184810 ; 16711680 ; 255 ;;;; 2
4 ; 10814 , 11814 ;Rainfall;Gage & Adjusted
Radar Bellevue; 1 ; 2 ; 0 ; 7053526 ; 11184810 ; 16711680 ; 255 ;;;; 2
5 ;
6 ;
7
;
8 ;
9 ;
10 ;
11 ;
12 ;
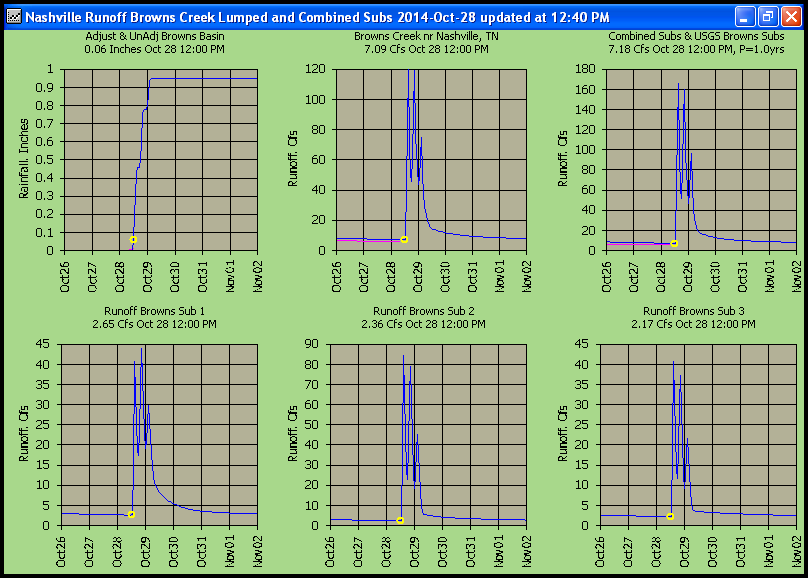
4 ;Nashville Runoff Browns Creek Lumped and Combined
Subs; 8 ; 9 ;-1
1 ; 11801 ,-10801 ;Rainfall;Adjust & UnAdj Browns Basin; 0 ; 3 ;
0 ; 9164968 ; 9941427 ; 16711680 ; 255 ;;;; 2
2 ; 30801 , 1800 ;Runoff;Browns
Creek nr Nashville, TN; 0 ; 3 ; 0 ; 9164968 ; 9941427 ; 16711680 ; 255 ;;;; 0
3
; 1805 , 1800 ;Runoff;Combined Subs & USGS Browns Subs; 0 ; 3 ; 0 ; 9164968 ;
9941427 ; 16711680 ; 255 ;;;; 0
; 1 ; 3.17396 ; 0.1261391 ;-0.2556
4 ; 30802
;Runoff;Runoff Browns Sub 1; 0 ; 3 ; 0 ; 9164968 ; 9941427 ; 16711680 ; 255 ;;;;
0
5 ; 30803 ;Runoff;Runoff Browns Sub 2; 0 ; 3 ; 0 ; 9164968 ; 9941427 ;
16711680 ; 255 ;;;; 0
6 ; 30804 ;Runoff;Runoff Browns Sub 3; 0 ; 3 ; 0 ; 9164968
; 9941427 ; 16711680 ; 255 ;;;; 0
7 ;
8 ;
9 ;
10 ;
11 ;
12 ;
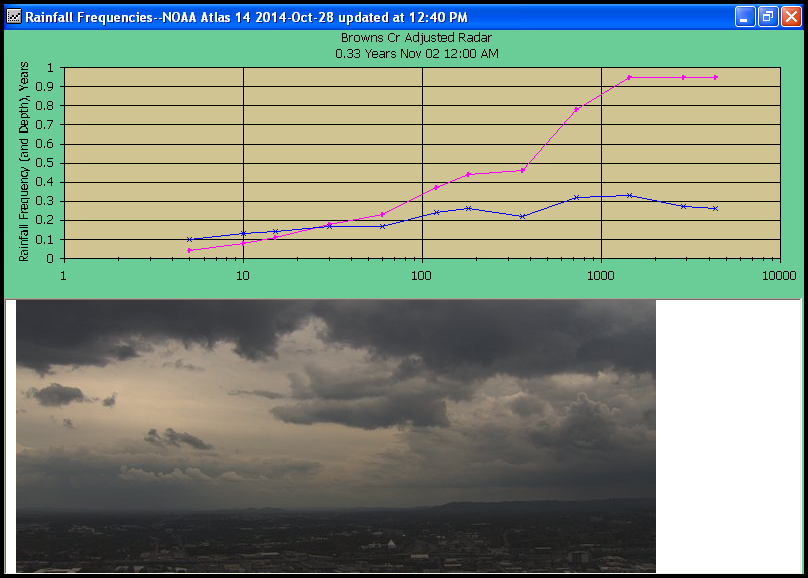
5 ;Rainfall
Frequencies--NOAA Atlas 14; 10 ; 9 ;-1
1 ; 11801 ;Rainfall Frequency (and
Depth);Browns Cr Adjusted Radar; 1 ; 1 ; 0 ; 9882730 ; 9684176 ; 16711680 ; 255
;;;; 0 ;-2
2 ;-1 ;Web
Screen;http://ftpcontent2.worldnow.com/wtvf/NC5wx/skycam/images/skycam_south/skycam_south.jpg;
0 ; 0 ; 63 ; 0
3 ;
4 ;
5 ;
6 ;
7 ;
8 ;
9 ;
10 ;
11 ;
12 ;
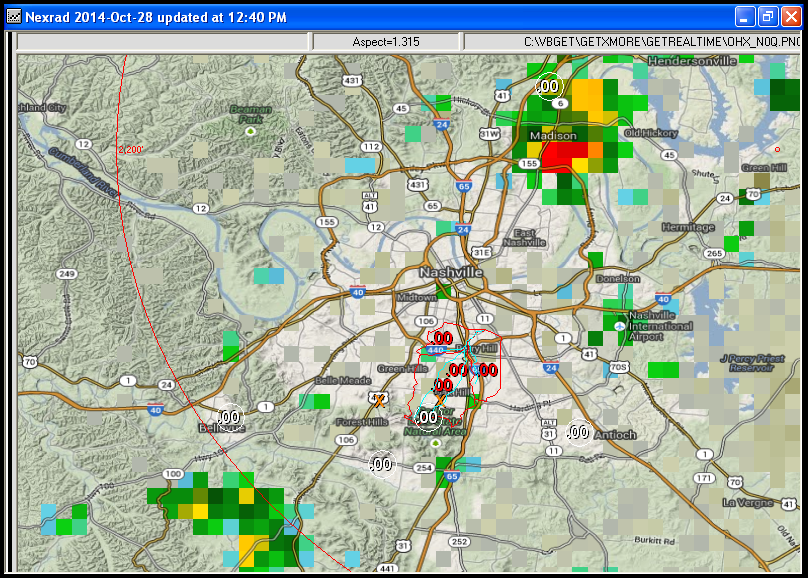
6 ;Nexrad; 10 ; 10 ;-1
1 ;-1 ;Web Screen;C:\VBget\GetXmore\GetNexrad\GetNexrad_windowOHX.png; 0 ; 8 ; 45 ;
0
2 ;
3 ;
4 ;
5 ;
6 ;
7 ;
8 ;
9 ;
10 ;
11 ;
12 ;
Note that on page 4, the ending...
; 1 ; 3.17396 ; 0.1261391 ;-0.2556
That's for displaying the Pearson Type III annual exceedance probability of the
graphs max value. You can remove it.
The above GetGraphs_stetup.txt can display the following pages for ideas on
where you want to go:
Page 1:
Page 2:
Page 3:
Page 4:
Page 5:
Page 6:
Here is what your GetGraphs_setup.txt might look like for the dsid's above:
Days = 4 ; End Day +4
Plot Unit Values = False
Include Daily Max/Min = False
Big Current Value = True
Auto Paging = False, 10
Font Name = Tahoma, Tahoma
Database Connection String= Microsoft.Jet.OLEDB.4.0;Data Source=C:\Program Files
(x86)\GetRealtime\GetAccess\GetAccessHDB.mdb;User Id=admin;Password=;
Owner ID=
Page; graph; dsidnumber; parametername; stationname; hrmarker; daymarker;
logyscale; backcolor;back2color; hrcolor; daycolor; highwatch; lowwatch;
watchcount; series2; frequencies & routings>>
1 ;Intellicast; 10 ; 10 ;-1
1
;-1;WebScreen;http://images.intellicast.com/WxImages/RadarLoop/csg_None_anim.gif;
0 ; 0 ; 0 ; 0
2 ;
3 ;
4 ;
5 ;
6 ;
7 ;
8 ;
9 ;
10 ;
11 ;
12 ;
2 ;Wundergages (blue) and Radar (pink) at Gage; 8 ; 9 ;-1
1 ; 10201 ,-10201 ;Rainfall;Bridle Creek Gage & Radar; 1 ; 3 ; 0 ; 9941427 ;
9941427 ; 16711680 ; 255 ;;;; 2
2 ; 10202 ,-10202 ;Rainfall;OFF Quail Run Gage & Radar; 1 ; 3 ; 0 ; 9941427 ;
65535 ; 16711680 ; 255 ;;;; 2
3 ; 10301 ,-10301 ;Rainfall;AVG Gage & Radar; 0 ; 3 ; 0 ; 9941427 ; 15194567 ;
16711680 ; 255 ;;;; 2
4 ; 31301 ;Ratio;Gage/Radar Ratio; 1 ; 3 ; 0 ; 9941427 ; 15194567 ; 16711680 ;
255 ;;;; 0
5 ;
6 ;
7 ;
8 ;
9 ;
10 ;
11 ;
12 ;
3 ;Adjusted Basin Avg Rainfall (blue) and Radar (pink); 12 ; 10 ;-1
1 ;-11100 ,-10100 ;Rainfall;Bridle Creek Gage & Radar; 1 ; 2 ; 0 ; 9941427 ;
9941427 ; 16711680 ; 255 ;;;; 2
2 ;
3 ;
4 ;
5 ;
6 ;
7 ;
8 ;
9 ;
10 ;
11 ;
12 ;
WHAT COULD GO WRONG... does...
You may want to get 24 hours of radar for the sites for yesterday using the
'History' button and 'OK' on the dates. Once GetAccess has a few more hours of
radar to adjust, the adjusted rainfall will run fine. You do not have to get the
past 24 hours ever again unless you want to. When it is raining you can run JUST
THE RADAR every 30 minutes with 'Batch'. You may have to turn off your PC's
hibernation or power settings. You can turn off the PC screenn. You can
then run everything once or twice a day to see how things are going.
If the Wundergages are downloading real slow it is because Wunderground was
recently sold to The Weather Channel and they have been working on 'improving'
their website experience. So sometimes the downloads are fast and somedays they
take quite a while.
Question: "Where do I find the gage adjusted radar rainfall results for the
subbasin?"
Answer:--Here is how I usually find my data. Using GetRealtime.exe, click
'Select Station From List', and click on the station line you want to view the
data for. Then up above click 'GetAccess' and it will load GetAccess and put you
in the table 'rsite' on your dsid. From here click 'SITE LIST', then 'PARAMETERS
w/DATA', and remembering your dsid, click on that parameter and click 'GO'...try
viewing options at the top 'Day', 'Hour', and 'Unit' to see whats in tables
'rday', 'rhour', and 'runit'.
Question: "Also, what are the units under the “value” column? Feet or inches?"
Answer:--For a handy list of datatypes and units, from GetRealtime, click
'Select Station From List', and click on 'Datatypes' and you will see rainfall
is in inches.
Question: "Also, the numbers in the values column seem to be feet. For example,
when I review one of the wundergages (in GetAccess) I need to multiply by 12 to
get the numbers to match up."
Answer:--What table are your viewing in GetAccess? Days, Hours, or Units? There
are 12 five minute unit values in an hour if that helps. What numbers are you
matching up for a Wundergage daily, or...? Or some idiot told you to use
rsite paramater_code 'HourlyPrecipIn'. Always use rsite paramater_code
'dailyrainin' for Wundergages (except airports). Sorry about that.
I have fixed that dumbness above.
Question: "When I view the results for a particular day/time I am seeing values
in -11100 when there are no values in the -10100 which does not seem correct."
Answer:--Remember you have 2 GetRealtime setup lines writing to -11100,
Forecasts and Adjusted Rainfall. So future days with no radar is to be expected
and will be over written as radar is retrieved.
Question: "when I try to retrieve the adj rainfall for station -111000 and it
shows -999999"
Answer:--The -999999 means there were not enough input values to write a daily
value. Your GetRealtime screen shows Count=0, no values were retrieved for the
computation.
Ok here's what you do when you have a problem. Look at the input files
GetRealtime.exe is using. Select and run just that one line for -11100 Adjusted
Rainfall with GetRealtime.exe. With Windows Explorer right click the file in the
GetRealtime.exe folder named 'computeIn.txt' and open with Excel. You will see a
column of ratios and a column of rainfall as inputs. If not, you have problems.
;-)
Run the line: COMPUTE-Hour; 31301; Ratio;....
Look at
file 'computIn.txt'. Are their 2 columns of input to compute ratios?
Run the line: COMPUTE-Hour; 10301; Avg Rainfall; Avg of Wundergages;...
Look at
file 'computIn.txt'. Are their 2 columns of input to compute averages?
Run radar average...
Look at 'computIn.txt'.
Wundergage retrievals as input will be in 'wonderin.txt' and forecasts in
'forecast.txt'. I think you will figure this out before I can help but when all
else fails, send me your GetRealtime_setup.txt file. Also send me a screen
capture of your GetAccess table 'rsite'.
If things still do not run... Download my
zipped working setup. Unzip to 'C:\'
and see where you went wrong.
Start making retrievals and
watch your GetGraphs. Try History and Selected Staions and All Satations
and Scheduled Batch or what ever to
get farmiliar with things. You can't break it.
Now read the full manuals for GetRealtime Help:
http://getmyrealtime.com/help.aspx
and GetNexrad Help:
http://getmyrealtime.com/GetNexradHelp.aspx
And then automate just your radar retrievals. You are now a Certified Radar
Adjuster Proffessional.
Qusestions and Answers on automated Scheduled
Batch:
(try 30 minutes between retrievals, Iowa Mesonet for starts)
"When I stop a scheduled run and then restart, how far back does it go to get
radar?"
--It goes back to the last time is was updated or 4 hours, which ever is LESS.
Meaning it will only look back 4 hours. You have to use History to go back more
than 4 hours.
"Is it likely to miss any and under what circumstances of time."
--I have only missed radar when the radar site goes down. MXX was down for over
a day on Jun 28 but it did not rain during this outage.
During mega events like Nashville you can count on the Wundergages going down
and maybe only airports being up along with the radar... so act accordingly.
"How long a stop will miss how much radar?"
--You can stop radar up to 4 hours before restarting and not lose radar. If down
longer than 4 hours then check your rain gages and run any period with rain. To
do this, look at your hourly rainfall gage record and start 3 hours prior to the
start of rain and 1 hour after to make sure you catch it all.
"But doing that meant that I had to stop the scheduled run while I went to
fixing the history (now 5 days back)."
--No you dont. You could just start up GetRealtime.exe again and do the history.
Just make sure you are not writing radar at the same time. Or stop it like you
did, which is what I would do.
"When I restarted the scheduled run, it looks like it lost 15 hours of data
prior to the restart."
--I think the MXX radar was down. When viewing radar with GetNexrad and the
radar is down and you are zoomed in, then you will just see blank radar. If you
zoom out (reset), you will see the Red on Black Radar is down message. You can
view the radar site message with 'Radar Status Message'. Looks like MXX was down
again today if you check the message.
You can also 'View Error Log' from maximized screen GetRealtime.exe.
You will see... "No new radar since 06/28 07:05"
and after 4 hours.... "MXX ... radar down MXX "
"I’ve been seeing a lot of rain gage drop outs. These can be for short periods
like an hour or so. Unfortunately, they seem to happen when several of the other
gages are reporting rainfall and the radar shows that these gages should be also
but they just have no data—not even zeros. So I would like to be able to down
those gages just for the short term until they start reporting again. I am
guessing that GetRealtime doesn’t do that automatically. Can it notice that
there are missing readings at a gage?"
--Using GetGraphs you can see the last reported value's time on each graph for
series 1 (not 2) so always make the gages series 1 and radar series 2.
If a gage is down or slow reporting, then the gage average will not include that
gage, but the radar average will. Hopefully using averages will make little
difference with several rain gages. You can then use GetGraph's 'Gage Off/On'
and then 'Setup', 'Save all to GetGraphs_setup.txt' to not use that rain gage in
BOTH the gage and radar averages.
I really need to think about an easy fix for slow reporters. But I think inaccurate gage reporting
is a bigger problem and these problem gages should just be eliminated. I look at
the gage and radar plots in GetGraphs and check that all the radars are plotting
either above the gages or all are below the gages. If you see one that is not
like the others then that gage is a candidate for turning off. It's a good
idea to include a professional rain gage like the USGS evan if not near your
location as a check on how gage and radar should relate over time (don't include
in your adjustments). Believe it or not, UNadjusted NEXRAD radar
accumulations (bias) over time will be either dead on or a simple factor off,
just not for hourly events where runoff needs it. Lots of
more info
on my Charlotte study link below.
"For that matter, what happens to the radar reading when a gage is turned off in
GetGraphs?"
--BOTH the turned off gage and its radar are not included in the GetRealtime
averages.
"In order to get the radar to turn off when the gage is turned off, it seems
like we should be getting individual adjustments for each gage and then
averaging those."
--Say
one gage has 1" and another has 0.15". The ratio at the 1" gage is 1.0 and
the ratio at the 0.15" gage is 5.0. The average ratio would be 3.0., NOT GOOD!
But the gages average is 0.575" and radars average is .515" so the G/R ratio is
1.12, that's GOOD!
And I would
reboot my system every Friday morning just to be safe and free up
any stuff computers like to do on their own whims to crash your work. You
can also use the Windows' Event Viewer in Administrative Tools in the Control
Panel to check on bad actors like hard disk failures and other warnings.
Now for
converting your
Adjusted Radar Rainfall to Runoff, try my
runoff cookbook.
------------------------------------------------------------------------------------------------------------
Additional page links about
ET, Runoff, and Nexrad Radar help and comparisons:
Radar Rainfall
Ajustment, Charlotte, NC
List of How To Videos on Youtube
Help Page for GetNexrad.exe
Nexrad Rainfall to Tipping Bucket Comparison
(how I got started)
Nexrad Rainfall-Runoff Comparison Las Vegas
Valley, NV w/ runoff setup & radar adjustment
Nexrad
Rainfall-Runoff Comparison San Jouqin Valley, CA w/snowmelt and radar adjustment
Nexrad Snowfall Comparisons in western
central Sierras, CA
Nexrad
Rainfall-Runoff Comparison Beech Mtn, NC w/snowmelt and radar adjustment
ET and Radar Rainfall along the Lower Colorado
River, AZ-CA