|
This demonstration and learning experience has been completed.
Although a singleseasonal adjustment factor to the NEXRAD radar used
here works great, I have since moved on to hourly adjustment of the radar in
realtime needed at smaller local catchments at lower elevations. For current
radar rainfall, snowmelt and pack, and continuous runoff see my ongoing example
studies for Big
Creek, CA and
Beech Mtn, NC.
***GetRealtime is my free
Windows program that automates downloading free real-time hydrologic and
meteorlogical data at scheduled intervals for display. Supports USGS,
Wunderground, USBR, COE, USCS Snotel, CDEC, CIMIS, and NOAA WSR-88D radar for
continuous computation and simulation and it's also
free.***
New this year for
winter 2011-2012 is how to take the radar precip and combine with a lower
elevation Wundergage's Temp, Humidity, and Wind Speed and calculate an
hourly snowpack
and melt. It actually seems to work! You betchya yah!
The first five graphs are not the focus of this NEXRAD radar precip example study but it is always nice to see what's the significance of the radar snow pack so here's some water supply graphs I found interesting.
This Year's Meadow Lake Max Snowpack Status.... below average but still
building.
Lowest of record beginning in 1998 was Apr 21, 2001 at 68% of Apr 1 avg or 35.2".
The NWS precip outlook chart below
(March and April were way above their outlooks):

This year's Meadow Lake
gage snowpack ranking:
This year's get-a-feel-for Folsom Dam annual inflow volume based on our single snow
gage (R^2=0.75):
Looks like the lower elevation winter rainfall is as or more important than the
high Sierra snowpack melt on Folsom inflows. I would not have guessed
that. This may help explain the scatter in the chart above.
Snow year summary tables of what lies below:
** note: Dutch Flat gage was down on max event, nearby station used.
Hoping for redemption.
Last
year:
Live shot of
Squaw Valley Ski Lift, CA

Current
Pricip Accumuations:
Current Snow Melt Computations:
Larger graphs are available at bottom of page.
Here is a great NWS website for
US snow info:
http://www.nohrsc.noaa.gov/nsa/
CDEC's Sierra snowpack percent of normal plots:
http://cdec.water.ca.gov/cgi-progs/snow/PLOT_SWC
Note how CDEC current status plots are percent of April 1. The Meadow Lake
status plot above is percent of the current date's average. Slightly
different. CDEC status plots make no projection for April 1 but you could
infer following the average line at the same difference to April 1.
Factoid: April 1 is the average maximum snowpack date for the Sierra's and
also the Colorado Rockies. It is March 1 in Arizona.
** Current Years Info (data at bottom) **
This is an ongoing comparison of Nexrad radar snow water equivalent at three
CDEC
snow water content gauges located in the western Sierra Nevadas of central California
that began Jan 2010.
.. and using the new Ridge 2 higher resolution images is reducing needed radar
adustment. The hourly CDEC snow guage data are downloaded
in real-time by
my program GetRealtime as
are the 5-minute Nexrad radar data at those locations for comparision... in real-time.
Will the California Nexrad radars ever show any promise of reporting (N1P)
anything beyond it's stratiformed nose... without high power corrective
lenses. People want to know! It's not that hard as you will see.
With the new N0Q
radar, Meadow Lake adjustment have now been reduced from last years 3.85 to 2.0.
Van Vleck adjustment has now been reduced from last years 2.6 to 1.45.
Caples Lake adjustment has now been reduced from last years 1.94 to 1.63.
The N0Q is indeed showing superior info to last years N0R and these adjustments
may be changed again as warranted as the 2012 season progresses.
This years new snowpack computations seems to be working great! The snow
pillow gage data seems to have issues with this years very low snowpack so this
radar is probably evan better than snow gage data once it is calibrated with
poor gage data. ;-)
Old news this year.... Only Fargo will be continued this year...
The Arizona SNOTEL stations and Radar data at these sites were just too
problematic.... one thing after another. Probably beam blockage and
maintanance logistics, but I really just had to moved on. It's those darn
mountain spirit Kachinas... you can actually see them on the
NWS web cam.
Live shot of real-time snow gauge Bear Valley, CA at elevation 7,200 ft

I should
have captured a daily pic of above for a time lapse video. Note how the trees
and the gage itself affect snow accumulation and melt and why this snow gage swe
exceeds measured precip. Never mind that skidoos and bigfoots come and go
flipping snow helter skelter. ;) Big thank you web cam guy!
Skip to current year analysis below.
** Past Years Info and Analysis**
What follows was a radar rube's take on things... Obviously the NWS is all
knowing here, but you may still find my explorations instructive (never use
N1P... ever!)
Two new stations for 2011 have been added near Flagstaff Arizona and one near
Fargo North Dakota to demonstate that Nexrad actually works for measuring snowfall...
geez I hope! I know the guys at Nexrad headquarters know it works, but
I've been fooled once too often to play that game. ;) But come, the game
(a Snark) is afoot! *******
This concludes this initial 2010 winter snowfall
comparison and it looks like a simple correction factor can save Nexrad's bacon
in the western Sierra Mountains of central California. So what if the correction
factor is around 1,000% (11.64*N0R and 9.51*N0R). The Meadow Lake snow gage site
does not have a rainfall gage (they take summers off in cal) so this comparison
will have to be discontinued until next winter to see if the factors will hold
year to year. Van Vleck continues but it hasn't rained since the last snow
fall on June 2 as of this writing on Sep 15, 2010. Check out the Rainfall
Comparisons for 2 rain gages in the central Sierra foothills for summer type
storms here that
are only half as bad. It has not rained there either. Does it even
rain in central California in the summer, let alone hail??? I learned alot
about life and a little about livin with Nexrad while doing these comparisons and I hope you will too. ;-)
To carry over the summer months I have added at the bottom of this page a N0R
radar vs Snotel precip gauge near Flagstaff AZ for something to look at until
winter returns to the Sierra Nevada's of California. Hopefully Arizona
has a better climate than California, reflectivitily speaking, and will
demonstrate snowfall can be measured with radar next winter.
Also a precip comparison near Fargo, ND has been added on Sep 15, 2010 just in case none
of the above works... which hasn't! North Dakota will now have to be the
'show me' state.
************************************************
CDEC MDW Meadow Lake (7200 ft) snow station info is here
located 89 miles northeast of the radar, mid-beam base scan elevation is 8,910
ft.
CDEC VVL Van Vleck (6700 ft) snow station info is here
located 80 miles northeast of the radar, mid-beam base scan elevation is 7,640
ft.
CDEC CAP Caples Lake (8000 ft) snow
station info is here located 89 miles east of the radar,
mid-beam base scan elevation is 8,900 ft..
This gage was added after the initial winter on Aug 16, 2010 with a gage
that measures both rain and snow precip to date.
**NEW**
KCAALTA3 Dutch Flat (Alta) Wunderground (3700 ft) snow
station info is here
located 68 miles northeast of the radar,
mid-beam base scan elevation is 5,990 ft..
This gage was added on Nov 1, 2011 with a gage
that measures both 5-min heated rainfall and snow pack depth
via webcam on a stop sign.
**NEW**
KCABEARV1 Bear Valley Wunderground (7200 ft) snow
station info is here located 88 miles east of the radar,
mid-beam base scan elevation is 8,730 ft..
This gage was added on Dec 1, 2011 with a gage
that measures both 5-min un-heated rainfall and snow pack depth
via graduated stick on a webcam.
The
NEXRAD radar site is DAX.
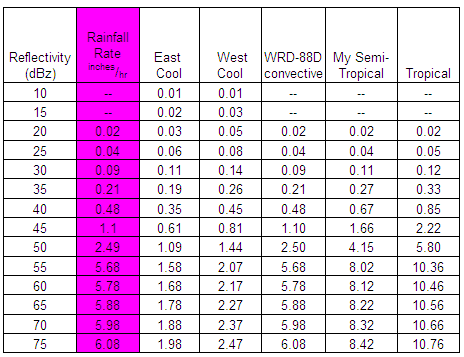
I used the standard WSR-88D convective dbz to rainfall rates, not
knowing I had other options that pump up the lower rates a bit for statiform
storms but I'm stuck with these now:
East vs West Cool vs Convective Z-R rates:
You may want to limit the maximum rainfall rates for your point of interest.
Meadow Lake Snow Gauge Daily Accumulations:
Van Vleck Snow Gauge Daily Accumulations:
NEW for summer Caples Lake Snow and Rain Gauge Daily Accumulations:
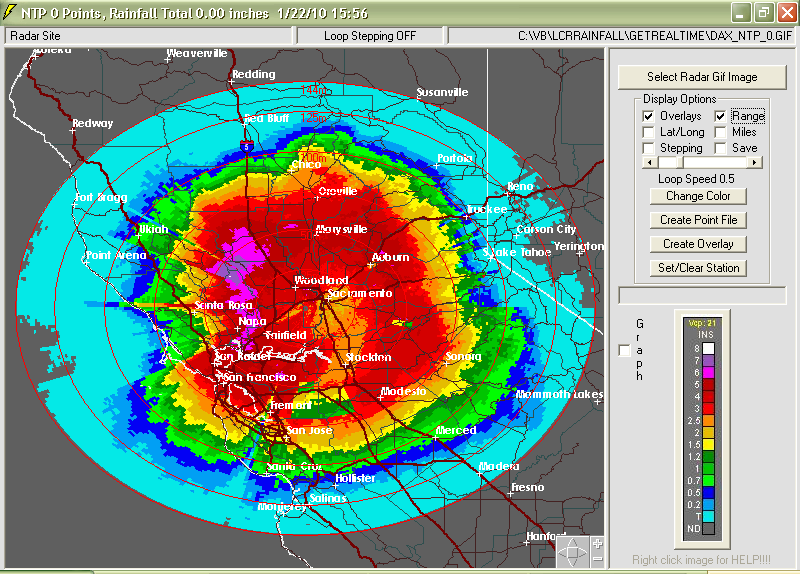
So what gives? Why such terrible results?
The DAX radar image as displayed by
GetNexrad below shows that the rainfall drops off rapidly beyond a
70 mile radius of the radar site. The two snow gauges are located 80 and
89 miles from the radar site and therefore are not accurate at all.
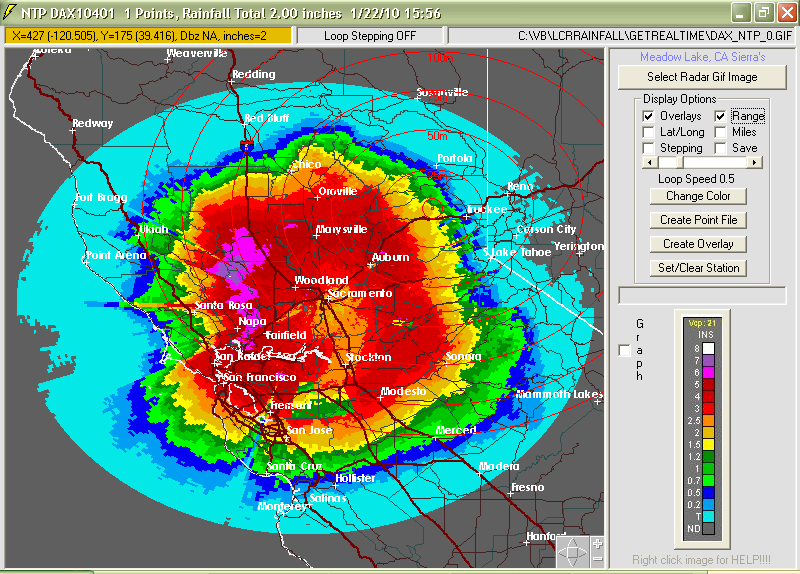
Meadow Lake NTP precip total for January 16-22, 2010 below shows 2.0 inches had
fallen for the 7 day period. CDEC MDW says 9.60 inches snow water equivilant had
fallen.
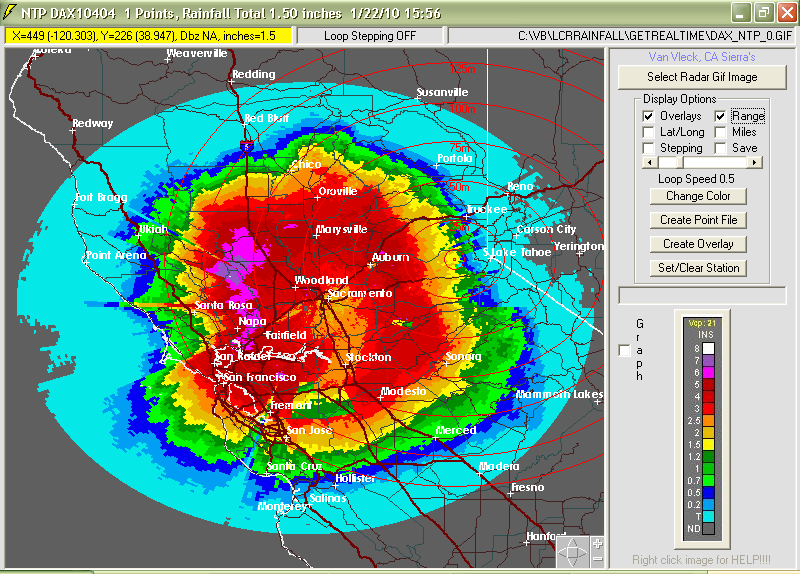
Van Vleck NTP precip total for January 16-22, 2010 below shows 1.5 inches had
fallen for the 7 day period. CDEC VVL says 7.61 inches snow water equivilant had
fallen.
So my conlusion so far is that the NEXRAD radar site DAX is not reliable beyond
about 70 miles from its location. The Sierra snow gages are located beyond
this range and so far the radar is just bad news. And I dont think the
problem is that of snowflakes versus raindrops. The Wunderground rain
gauge located in the Sierra foothills to the southeast of the DAX at 2500 foot
elevation had similar results for the 6 day period:
Groveland, CA X=459 (-120.211), Y=344 (37.862) 91 miles from radar
site
Wundergage
MAP893=5.07 NTP Storm Total=1.0 N0R=1.09 N1P=0.7 inches.
The solution to the poor results beyond 70 miles with winter type storms
probably once again rests on the curvature of the earth and our arch-nemesis
radar over shoot:
The DAX atenna elevation at 141 ft will have its Base 0.5 radar beam missing anything below 7,000 feet
at 90 miles. Hmmm... it can't be missing much precip if our gauge site is
at 7200 ft. The top of the radar beam will be at 14,000 ft which might be
way over the cloud tops at these two locatations. This may explain
something about the problem. It certainly must for the central valley area
of radar coverage beyound 70 miles for winter type storms.
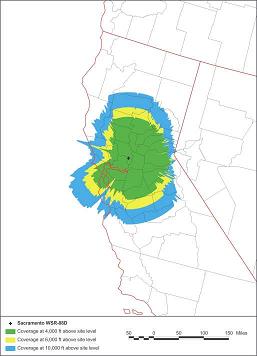
From the
map above, the 2 snow gauge sites appear to be within the DAX range at
10,000 ft elevation coverage.
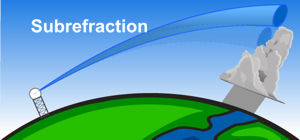
Actually I may have been misled with the curvature of the earth and beam angle
causing radar beam over shoot. It probably has nothing to do with that. Beam
spreading and beam refraction with distance from the DAX radar site is probably
the cause of under estimating rainfall beyond about 70 miles.
I should have done my homework at the
NWS Online
School for Weather.
The Online School for Weather also recommends using NCR instead of N0R images
for certain cases. The advantage of Composite Reflectivity is in mountainous
regions. Often, the Base Reflectivity ½° elevation scan is not high enough to
see over mountains. With the addition of higher elevations scans, weather
information over mountain peaks can be seen.
I have added the NCR record to Meadow Lake and Van Vleck beginning Feb 1, 2010.
We shall see how the NCR performs.
I hate to keep beating this 'over shoot' horse, but this neat NOAA program
display shows the terrain interference for any radar site in any direction.
Below is the terrain in the Meadow Lake gauge azmith:
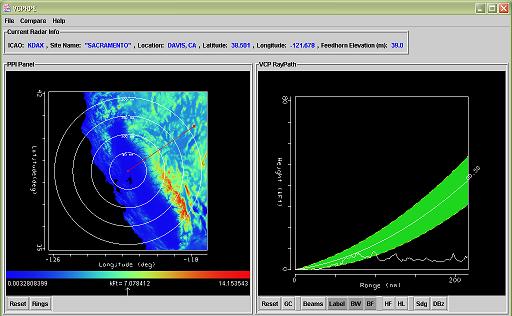
Note that the right graph shows the Sierras block the lower half of the 1/2
degree base reflectivity beam and I bet that is not good. The Meadow Lake
gauge located at 89 taxpayer miles is at Range 77 nautical miles displayed on the graph
or about where the highest peak is. I'm not sure what this means but I bet
ground reflectivity is to be avoided at all cost and why half a beam is bad news
and probably is not used. The next higher beam angle will be measuring the
stars and why N0R and NCR have equivelant reflectivity. (As an aside,
don't you hate it when a cruel scientist resorts to international units for
simple miles at tax payer expense... probably in hopes of further obfuscation.
We aint sailors like Mark Twain!!!)
Well the NCR has not helped. The NCR and N0R are equivalent. But I
don't see why the reflectivity can not be adjusted for distance or elevation
overshoot or something. Reflectivity adjustment can be estimated from
rainfall records something like that below. The radar image beyond 70
miles currently is just plain deceptive.
In fact, I think I will take the Groveland MAP893 comparison slope above of 2.86
and apply it the area averaged N0R rainfall for the runoff basin on Big Creek
and try to salvage something out of that
runoff
comparison fiasco here.
Finally, here is the payoff. Results for the 2010 winter:
DAX Radar Overshoot Correction Table:
|
Western Sierra |
DAX |
Gage |
Correction |
|
Gage |
Milage |
Elevation |
Factor |
|
Buck Meadows |
98 |
3197 |
4.09 |
|
Van Vleck |
80 |
6700 |
9.51 |
|
Meadow Lake |
89 |
7200 |
11.64 |
(Groveland gage not included in factor table because it seemed unreliable.)
But another high Sierra gage has been added to add some error for curve fitting
for next winter. Based on the above 3 sites I predict the new site factor
for Caples Lake to be... 13.36 based on milage and elevation.
For more NEXRAD radar versus Wunderground rain gauge comparisons go to
my web page here.
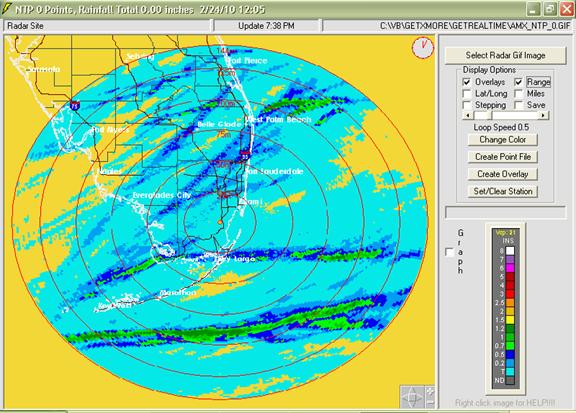
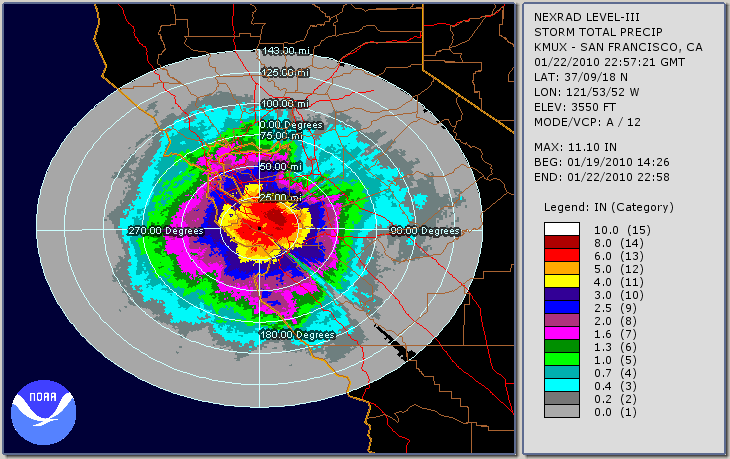
By the way, this is what an unobstructed radar's storm total NTP looks like.
Notice that it's not a pretty radar centered carnation flower but that the maximum
rainfall extends across the whole image. Do the boys at Nexrad
headgquarters think we are that stupid??? Ok, yeah they had me going for a
while. ;-) Im kidding, the big difference in Florida type
convective (tall) storms and California winter unconvective (short) storms is
uh... tallness. All California radar NTP images regardless of nearby
mountains in winter look like
flowers. Once again I screwed the curvature of the earth up so sue me. Simply they just need to put their radars on energy sources not hippy
flower powered or get more hot air like Florida. Case solved! So
let's hear a conclusion to this whole matter, don't mess with the boys at
headquarters!!!...ever!
And to show that all California radars are carnation flowers with limited range
in winter
here is the radar site MUX near San Francisco for the same day 1/22/10 that
overlaps some of the same area with grossly different rainfall amounts.
For instance the city of Sacramento shows about 3 inches of rain above while
this shows 0 inches had fallen at Sacramento at about the 100 mile range:
The forgotten lands of California and their inhabitants... as in the Grapes of
Wrath... that bare their burdens and go unseen, beneath the radar. ;-)
*************** NRCS or SCS Snotel Precip Gauge in ARIZONA
**************
(Why would any organization change a brand name like SCS to that?... are they
stupid? Let's find out.)
Snowslide Canyon, Arizona Snotel #927 (9730 ft) in the San Francisco Mountains
Inner Basin near Flagstaff
station info is here
located 58 miles northwest of the radar site on the Mogollon Rim.
The
NEXRAD radar site is
FSX. The station info states the Snowslide gage lat/long as
35.333/-111.650. A Google Earth search for this area and elevation reveals
the elevation is correct but the lat/long is actually 35.342/-111.651
which is one radar pixel north of advertised (I knew it, these NRCS guys can't
even read a map like the SCS'rs. ;-) But how about that new name NRCS... it's a
real grabber!). The Snotel precip gauges are
these huge vertical tubes about 1 foot in diameter with 5 gallons of antifreeze
added and can measure precip accumulation come summer or winter. Or for
that matter, come hell or high water! Not much to screw up with these
babies, like having to deal with evporation off the snow pillows(?) in the
Sierras. The Snotel sites deal with current snowpack by using an acoustic
snow DEPTH monitor... I'll leave it to the experts to fight this battle.
All I know, I have no idea how much precip fell in the Sierra's with all the
evap thrown in on top of snow pillows and Nexrad aint about to tell me without
putting up a fight. ;-)
Ooops... Snotel uses
snow pillows too, not sure how they report it. I guess California cant
afford a big tall can of antifreeze like NRCS.
Hmmm.... I wonder if I put antifreeze in my little plastic gage it would measure
snowfall too so that California could afford it. ;-)
Snowslide Canyon, Arizona Gauge Daily Accumulations:
(Black/Red Warning!)Snotel tin can gauge was down! What are the odds!
I just praised their theoretically perfect operational performance and this one
must have gotten a direct lightning strike on August 6. Let's hope it did
not boil the water out of it with no subsequent loss of data... or the
transducer just went bad from old age. On the other hand, it is now a
precip AND lightning detector! Meanwhile, Nexrad just keeps racking up the
rainfall.... ok it was down for awhile too earlier but was back up way faster.)
Well this was looking good... until the July 23 monsoon's over whelming
cloudiness created cold fog and drizzle conditions just like California!
Dang, I can't catch a break even in the the Arizona mid summer desert! Born
under a bad moon meteorlogically. Well this is beginning to be a
repeditive theme with Nexrad in cooler climates like the Sierras and Fargo (see
rainfall below). Lets let the above graph and lessons learned stand for this
summer and restart on Oct 1, 2010 with a clean slate for the winter. It's
beginning to look like before one can make use of any Nexrad data one needs to
take the Nexrad site on a shake down cruise and learn it's quirks and foibles
for any actual point of interest. And in these cooler climates determine a HUGE
correction factor!!! I didn't think science needed a Caveat Emptor and that I
could be getting a Pig in a Poke and I doubt I am letting the Cat out of the Bag
on Nexrad here... But boy was I optimistic!
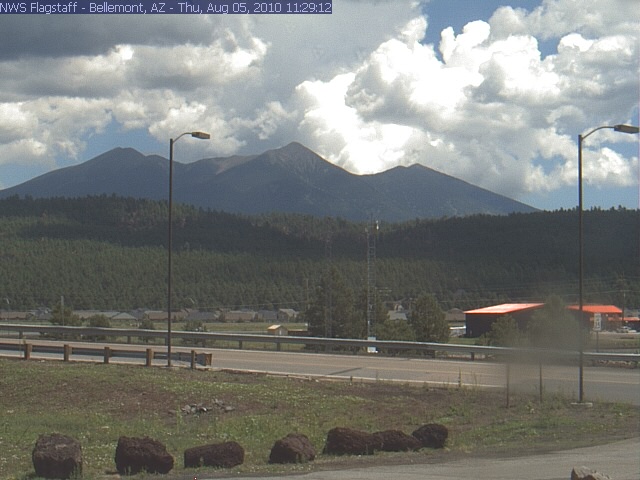
How do I know it got foggy? I was watching the
NWS web cam
pointed right at Snowslide Canyon, that's how... when I could see it.
If you look at the NWS web cam, the peak on the left is the highest point in
Arizona at 12,633 ft. The Snowslide Canyon gage is 13 miles away from the
camera just on the
far side
of the peak in the middle in the very throat of an extinct (?)
valcano. Eruptions have occurred nearby as late as 1,000 years ago.
The NWS camera elevation is 7,100 ft and is located in the largest
Ponderosa pine forest in the world (some desert). Note that this camera is not
the location of the FSX radar site which is located 58 miles southeast of this
camera location at elevation 7,530 ft.
Once again our arch nemisis... uh standard atmosphere refraction comes into
play... oh moon beams!!! That darn mountain is right in the way again!
Hmmm.... I think I am beginning to see a method to those boys at headquarters
madness. If the mountain wont move for the radar, then let the radar site
move for the mountain. Half a beam is worth 2 in the brush.
I think it is high time that we got to the bottom of this round earth versus air
refraction affect. The
NWS says the radar beam height can be calculated as:
h = (R*sin(PHI)) + (R^2 /2*IR*Re),
where:
h = height of the beam centerline above radar-level (ARL) in km,
R = slant range observed on radar in kilometers (km),
PHI = radar elevation angle (in degrees),
IR = refractive index (1.21), and
Re = radius of the earth (6371 km) .
The (R^2 /2*IR*Re) part of the equation is where refraction (IR) and earth
curvature (Re) can be sorted out for each of their influence:
At a 100 mile range:
Refaction=1.21; Hir=5280*100^2/(2*1.21*3958.75) or 5511 feet
Refaction=1; Hre=5280*100^2/(2*1*3958.75) or 6669 feet
So at last, the earth curvature is the dominate beam bender upward relative to
the surface of the earth and refraction actually bends the beam back down toward
the earth. So in fact our arch nemisis is the earth and not the air. ;-)
And the beam angle at 0.5 degrees would add (R*sin(PHI)) or 5280*100*sin(.5) or
4608 ft for the total 10,119 ft beam center line at 100 miles. Case
solved! And I bet this is why you can sometimes see distant desert
mountain ranges floating in the sky with a cold morning valley surface air layer
or even mountains that usually are not even visible, and why the sun sets before
sunset... and even how Spanish galleons had been spotted sailing the sands of the Yuma
Desert.
Does any of this have anything to do with why the radar missed the cold foggy
drizzle rainfall at the Snowslide Canyon gauge? Probably not. The
precip was probably occurring in the 2,000 ft hidden zone below the mountain
tops regardless of beam elevation.
I don't know what causes the poor
performance of the Sierra radar which should not be hidden at the two snow gauge
locations. But at least in the Sierras you just multiply the dbz to
rainfall by 10 and you get the right answer as shown above. Off and on
again corrections for this Arizona site would be troublesome and portend bad
things to come, come a cold hard winter. This comming
2011 winter in Arizona will be interesting. Never a dull moment with these
Nexrads... and these lacadasical California flower radars are not what we paid
for... so quit
talking to the trees and solve this delimma. Ok, never mind, you
Nexrad guys cant be made to
fix a
leaking star. There is gold under the floor boards of Nexrad yet to be
mined.
Fargo, North Dakota Gauge Daily Accumulations:
Just to show that snow fall can be measured by NEXRAD (Yah I hope) this Wunderground gage has
been added.
Wundergage KMNMOORH1 (890 ft) rain and snow station info is here
located 52 miles southeast of the
radar MVX, mid-beam base scan elevation is 4,980
ft.
The general rain of 9/23/10 comparisons are poor but I will wait before making
any changes to the Z-R relation. Here are the 9/23/10 comparisons between
N0R Z-R types:
9/23/10 Wundergage=1.68", Convective(graph)=0.51", EastCool=0.63", WestCool=0.87"
The
webcam for Fargo can be used to show that snowfall is indeed occuring as if
it aint Fargo after all. Also the USGS maintains a webcam of their stream
gage Red River near Grand Forks
here. Some
Wundergages provide a link to a its own
weather web page like this KMNMOORH1 site does that maintains an archive of
data should the Wunderground data go down and also logs the type of precip and
conditions observed.
---- Water Year 2011 ---
The N0R Z-R reflectivity to rainfall conversion table (see table below) for all
3 sites in the Sierra's will continue to use the Convective formula to be
comparable to the 2010 winter values. N0R West Cool Z-R has now been added
to all 3 Sierra sites. This adds a value at a lower dbZ reflectivity which
can't hurt at these distances with these stratiforms.
Also N1P as been added this year to all the
comparisons which is Nexrad's ingenius calculation of actual precip. I
must be missing something somewhere with N1P. I can't believe they can
take a good adjustable z-r precip number and screw it up so badly. No wonder Nexrad
gets a bad rap from hydrologists if they use N1P. It would be best to
compare what Z-R or if N1P works best at any site and season of interest... just
dont fall for the N1P right off the bat... if ever.
I will even go a step further because I think it should be made clear, only
the gullible (like me) would use N1P. I know those old goats at HQ
know what they are doing, but come on, let us in on it ok?
Update... After finally asking for help on N1P, the Nexrad
Radar Operations Center directed me to their
Handbook FMH-11, Part C. Chapter 3.3 tells us that the N1P (hourly
priciptation) may be adjusted for gage-radar bias but the adjustment is a single
value applied to the whole radar coverage. This is why one should ALWAYS double
check their own sub area of interest's gage bias and make your own adustment to
the N0R reflectivity Z-R relation as needed.
On the other hand, the whole point of NEXRAD was severe thunderstorm detection.
From what I've seen of California I doubt there has ever been a severe
thunderstorm in central California. So HQ... never mind, I will muddle along by
my own wits with these stratiforms under the radar. Actually, now that I
think about it with hindsight, only a knucklehead would ever think San Joaquin
Valley would be a good place to do rainfall runoff let alone snowfall
comparisons.
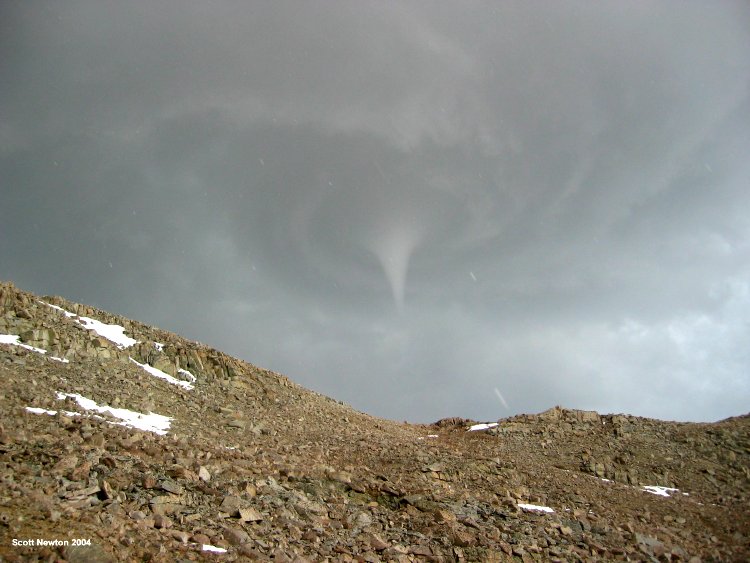
Then again, here is a
tornado with
hail photographed at 12,000 feet in the Sierra Sequoias area:
To the south in Arizona the N0R Z-R conversion table for
2011 is now the Cool West formula with an additional Snotel gage added
nearby with less terrain interference and better maintenance.
At Fargo ND the Cool East Z-R formula is being used.
Sierras - Meadow Lake Snow Gauge Daily Accumulations:
Sierras - Van Vleck Snow Gauge Daily Accumulations:
Sierras - Caples Lake Snow and Rain Gauge Daily Accumulations:
Snowslide Canyon, Arizona Gauge Daily Accumulations:
Fort Valley, Arizona Gauge Daily Accumulations:
The Snowslide Canyon gage above seems to be having problems and is also
potentially in a radar mountain shadow, so this nearby Snotel gage has been
added on 10/9/2010. This gage is not as remote as the Snowslide Canyon gage and perhaps will
have less down days. The
Fort
Valley gage is also located 57 miles north west of the radar site but at a
lower
elevation of 7350 ft.
Because Snotel locations are reported to the nearest 1 minute ,which is 0.017
decimal, which is 2 radar pixels, a Google Earth search of the Snotel location
was made. Based on a north/south trending elevation ridge, a matching elevation
would more likely have the longitude of -111.744, rather than -111.75, which
again is one radar pixel east of advertised (see Snowslide Canyon Snotel).
Fargo, North Dakota Gauge Daily Accumulations:

Ongoing Summary Table for WY2011 updated daily
% Difference is the error in total rainfall, a measure of bias.
MAE % is the mean of the individual daily unsigned differences, a
measure of error variablility.
Below shows the improvement in the daily errors that make up the MAE% for Caples
Lake that adjusting for bias makes.
Below shows the signed daily errors and how the bias adjustment increases the
range in errors at the smaller precip range. No free lunch. The chart below was
Oct 1-Jan 18, 2011.
From what I see above, I may have been misled a bit about the importance of the
Z-R conversion when it comes to snowfall. The US Bureau of Reclamation has
something to say about
radar snowfall
here and I will try their suggestions next winter. The USBR
z-r also has a radar range adustment. Finally some guys that know water. ;)
---- Water Year 2012
w/snow pack and melt ---
The N0R Z-R reflectivity to rainfall conversion table (see table above) for all
3 sites in the Sierra's will be replaced to use the new Ridge2 N0Q West Cool Z-R . This adds a
snow rate values from 10 to 20 dbZ reflectivity in 0.5 dbz steps which
can't hurt at these distances with these stratiforms. The N1P 1-Hour
Total Rainfall will also be continued. Snow melt computations have also
been added for real flood scenarios.
Example GetRealtime Setup for West Cool:
NEXRAD-DAX; 10401; Rainfall; Meadow Lake, Ca; 1
where the Base1 value of 1 indicates to use the CoolWest Z-R.
Additional info on the
Ridge2 Testbed and N0Q.
For the snow melt computations, a Wunderground weather gage or other supported
source is needed to provide the Temp, Humidity, and Wind speed to calculate
Solar and Longwave Radiation. The Temp, Humidity, and Wind will also be
used by the SNOWMELT computations but will be adjusteded per your factors.
Be sure to use Googel Earth or the Wundermap to verify the Wunderground
station's enviroment such as trees or other factors to consider when supplying
your adjustment factors. Do not do as I did and use the nearest Wundergage
at the highest elevation, an AIRPORT, that turned out to have very little
temperature correlations to anything and a piss poor record to boot, but
GetRealtime handled the erratic record with ease and surprisingly with the same
results with some changes to adjustment factors... I hope that's a good thing.
Distance from the Wundeargage:
Meadow Lake 21.5 miles northeast
Van Vleck 32.0 miles souteast
Caples Lake 52.7 miles sourtheast (there are several closer Wundergages so
this may change)
Example GetRealtime Setup for Snow Melt computations
(see Help link at top):
GetRealtime_setup.txt:
KCAALTA3; 17411; Temperature; Alta, Ca
KCAALTA3; 18411; Humidity; Alta, Ca
KCAALTA3; 28411; Wind Speed; Alta, Ca
KCAALTA3; 29411; Solar Radiation; Alta, Ca; 0; 39.201,-120.796,-120,7000; P3
KCAALTA3; -29411; Long Radiation; Alta, Ca
KCAALTA3; 10411; Precip; Alta, Ca (*not needed for SNOWMELT
if radar rain used*)
SNOWMELT-hour; -10413,-23413; Melt, SWC; Meadow Lake, Ca 2.0*N0Q ; 0;
-11,1,0.8,0.8,0.9,2.0,1
(*note the -11 Temp lapse rate or estimated diff and 0.9*Longwave adjust
to Alta Wundergage*)
(*also note the Alta Wundergage is at 3700 ft elevation but 7000 ft was used in
Solar computations*)
These factors will be looked into as
the 2012 winter and melt progresses.
The current factors actually used for each snow melt graph below are shown on
the graphs. Also note that GetRealtime.exe was updated 4/20/2012
to correct a bug in the computation of long wave radaiation. A
0.9 long wave factor now produces about the same snow pack and melt as a 0.5
factor did for our 3 snow pillow sites. I forgot long wave calcs use
temperature in C not F. Ooops!
You could adjust the weather gage longwave with a factor or compute longwave
radiaton as I have at the higher elevation snow pillow sites and the GetRealtime setup
could look like this:
COMPUTE-UNIT; -29413; Long Radiation; Meadow Lake, Ca Computed Long Radiation;
0; -10.5
The GetAccess parameter code: 17411,18411,28411,Solar long
The GetAccess station_id code: COMPUTE
Solar short radiation calculated at the -10 F temperature differances makes very
little difference and so was not made. The solar calculations already
include the 7000 ft elevation assumption.
GetAccess Table rsite:
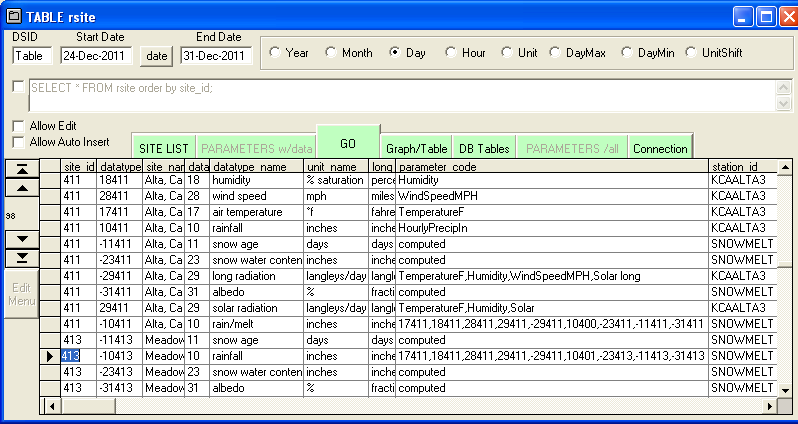
Wunderground Gage values Temp,
Humidity, and WindSpeed used as input and calculated values:
Sierras - Snow Gauge Daily Accumulations:
Not part of the Snow Pack calculations above, the Wunderground station in the
Sierras
KCABEARV1 has also been added for 2012
with a web cam snow staff gage so we can see actual uh... stuff. Snow pack calculations are based on this
stations own Temp, Humidity, and Wind record with radar N0Q west cool adjusted
precip. (Update Apr 6, 2012: A valant effort at this elevation but
the Wundergage has been on the fritz and the Alta gage has taken over for the
remainder of the year.) KCABEARV1 is located 88 miles east of the DAX radar at elevation
7200 ft, radar mid scan elevation is 8810 ft. The gage has a live webcam
on a snow staff gage as shown at top. Snow depth is converted from inches
to SWC by factor * depth as shown on graph... and why I should rethink this
whole webcam staff gage thing. The density factor is just a wild ass guess
with wild ass differences.
Fargo, North Dakota Gauge Daily Accumulations:
The KMNMOORH1 gage reporter reads the snow depth each day at 7 AM and I convert
the depth to SWC by 1 inch depth equals 0.1 inch SWC (or use last core sample
factor when available). My webcam view has
been down lately to verify the gage reporting but I think the gage operator has
forgotten to update his web report from Jan 5 to Jan 10. We are back in
business again. I also see the winter precip may be lagging a day when it
thaws?.
Some additional page links about
ET and Nexrad Radar help and comparisons:
List of How To Videos on Youtube
Help Page for GetNexrad.exe
Nexrad Rainfall to Tipping Bucket Comparison
ET and Radar Rainfall along the Lower Colorado
River, AZ-CA
Nexrad Rainfall-Runoff Comparison Las Vegas
Valley, NV
Nexrad
Rainfall-Runoff Comparison San Jouqin Valley, CA
Nexrad
Rainfall-Runoff Comparisons in northwestern Arizona
Nexrad Snowfall Comparisons in western
central Sierras, CA
Weather Underground is a registered trademark of Weather
Underground, Inc www.wunderground.com
WEBSITE MAP


WU USGS USBR NWS USCS CWRD COE
More Free Downloads
Comments/Questions
Contact Me
Label
|