Part 3
With Gage/Radar Basin Adjusted Rainfall/Snowmelt and SCS CN Loss
As one can see from FUBAR and SNAFU hourly rainfall values and runoff of Part 2
above, radar rainfall needs an hourly adjustement method applied to the basin
radar values, beyound that of the 1.99 factor that works pretty well for daily
values (actually I retract this, see daily accum's graph below). This is a repeating theme found at all Nexrad radars I have looked
at, whether very close or far from the radar, even in summer. The daily
radar values need only a seasonal factor applied, if any, for bias, while unit
and hourly values scatter wildly. I don't see how the daily values come
out so well with the absolute junk input for the unit values. I'ts like
some Heisenberg uncertainty principle and it's promulgation of absurdities.
As Einstein noted, "The more success it has, the sillier it looks."
Another lesson learned at this runoff site was the need for interception of a
large amount of available infiltration due to forest canopy and leaf litter. The
amount chosen and added to GetRealtime was 0.05 * Sdry or about 0.9 inches at
CNdry=40. This means in a dry condtion where P has returned to zero, 0.9 inches
of rainfall must occur before infiltration begins. I thought 0.9 inches was
outlandish so I stopped at 0.05*Sdry but it may even have not been enough.
It really helped.
Daily
Pricip Accumulations with Adjusted Big Creek Basin:
Hourly Point Precip and Adjusted Basin:
Daily Temperature:
Part 3A Conclusions 2013: Not bad... not
bad at all but not much rain this year after a good start. Without Getrealtime's continuous simulation of soil conditions
and hourly gage/radar rainfall adjustment this site would have remained a Fubar
basket case. I could
have used GetRealtime's Seasonal Riparian ET factor to make May's flows
disappear more quickly but not bad as is. 5-minute snowfall/melt was
successfully accounted for. Basin soil initialization was a bit ragged at
the start but came through ok once Interception was accounted for. Alot
was learned and incorporated into GetRealtime's runoff methods and that just
leaves rainfall adjustment techniques to look further into.
Not much rainfall is expected over the California summers but I will keep track
and if a significant event occurs then the summer runoff will be posted.
If not, I will pick back up next fall to see how the runoff coefficients will
hold up next year. ~Hasta la vista, June 1, 2013~
************************************************************
Part 3B Year 2014:
The 2013-2014 runoff period continues with the same runoff coefficients and
hopefully more rainfall and snow melt will occur this year. The single
radar adjusting Wundergage is now farther away near the Pine Valley Airport.
There are 4 Wundergages being downloaded but are really bad except for Pine
Valley. If they improve a closer Wundergage will be used but now it is
what it is.
No runoff is expected until about 4 inches of rainfall has replaced the soil
moisture and canopy losses.
Daily
Pricip Accumulations with Adjusted Big Creek Basin:
Hourly Point Precip and Adjusted Basin:
Daily Temperature:
You have to have precip for runoff!!!
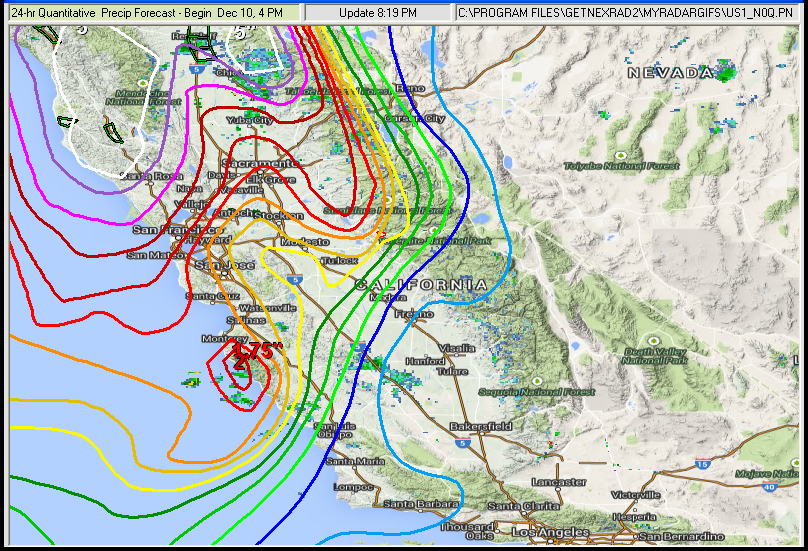
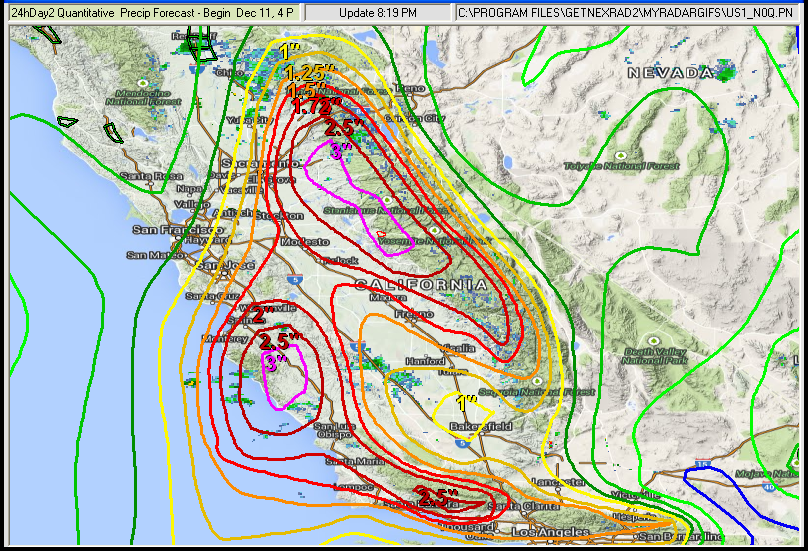
GetReltime uses the NWS 7-day hourly forecast of Temp, Humidity, Wind Speed, and
Precip and distributes them for 5-minute snowmelt computations. The
forecast Precip is only for 4 days as 6-hour QPF's. GetRealtime
distributes each 6-hour period precip value as a California 6-hour storm with
5-minute time steps. Yes, 5-minute snowmelt is a bit overkill, but you
never know when a freak thunderstorm might occur over this small basin.
Part 3B Conclusions 2014: Boy, two
dry years in a row. Maybe next year it will rain.
Not much rainfall is expected over the California summers but I will keep track
and if a significant event occurs then the summer runoff will be posted.
If not, I will pick back up next fall to see how the runoff coefficients will
hold up next year. ~Hasta la vista, June 1, 2014~
************************************************************
Part 3C Year 2015 Ended May 1 (no rain
expected till next fall):
The 2014-2015 runoff period continues with the same runoff coefficients and
hopefully more rainfall and snow melt will occur this year. Ended May1,
but will update if significant summer rains.
No runoff is expected until about 4 inches of rainfall has replaced the soil
moisture and canopy losses.
Houston, we have a scheduled lift off!!! and counting as of 12/10/2014.
Daily
Pricip Accumulations with Adjusted Big Creek Basin:
Hourly Point Precip and Adjusted Basin (continued):
Soil Space as SCS Curve Number:
Daily Minimum Temperature:
Snowpack:
Runoff:
Part 3D Current Year 2015-2016:
The 2015-2016 runoff period continues with the same runoff coefficients and
hopefully more rainfall and snow melt will occur this year. Update Jan 1
recession slope was raised from 0.08 of loam to 0.2 of sandy loam. Not
sure if this is because of the very dry previous 2 years or what. We'll
see if eventually it will return to .08. Update Jan 14 the 3 triangle unit
graph was replaced with a dimensionless unit graph for 15-minute gaged storm of
12/23/2012 with peak= 1,130 cfs.
No runoff is expected until about 4 inches of rainfall has replaced the soil
moisture and canopy losses. But as of Sep 12 there's some light rain
comming in and there is snow falling on the peaks... Let the good times roll!!!
Daily
Pricip Accumulations with Adjusted Big Creek Basin:
Hourly Point Precip and Adjusted Basin (continued):
Soil Space as SCS Curve Number:
(when the soil get's into the 70's you're sitting on a time bomb)
Daily Minimum Temperature:
Runoff:
Part 3E Current Year 2016-2017:
The 2016-2017 runoff period continues with the same runoff coefficients and
hopefully more rainfall and snow melt will occur this year. Update Jan 1, 2016
recession slope was raised from 0.08 of loam to 0.2 of sandy loam. Not
sure if this is because of the very dry previous 2 years or what. We'll
see if eventually it will return to .08.
No runoff is expected until about 4 inches of rainfall has replaced the soil
moisture and canopy losses. But as of Sep 12 there's some light rain
comming in and there is snow falling on the peaks... Let the good times roll!!!
Daily
Pricip Accumulations with Adjusted Big Creek Basin:
Hourly Point Precip and Adjusted Basin (continued):
Soil Space as SCS Curve Number:
(when the soil get's into the 70's you're sitting on a time bomb)
Daily Minimum Temperature:
Runoff:
Part 3F Current Year 2017-2018:
The 2016-2017 runoff period continues with the same runoff coefficients and
hopefully more rainfall and snow melt will occur this year.
No runoff is expected until about 4 inches of rainfall has replaced the soil
moisture and canopy losses.

Automated Updates and Graphs:
(automated info
updates every day, 2 hr, 1 hr, or 1/2 hr based on Storm Track Nowcast)
The Nowcasts are being evaluated on
my web page
here.
Flood stages based VERY loosely on 2-yr, 5-yr, 10-yr and 50-yr flood
frequencies:
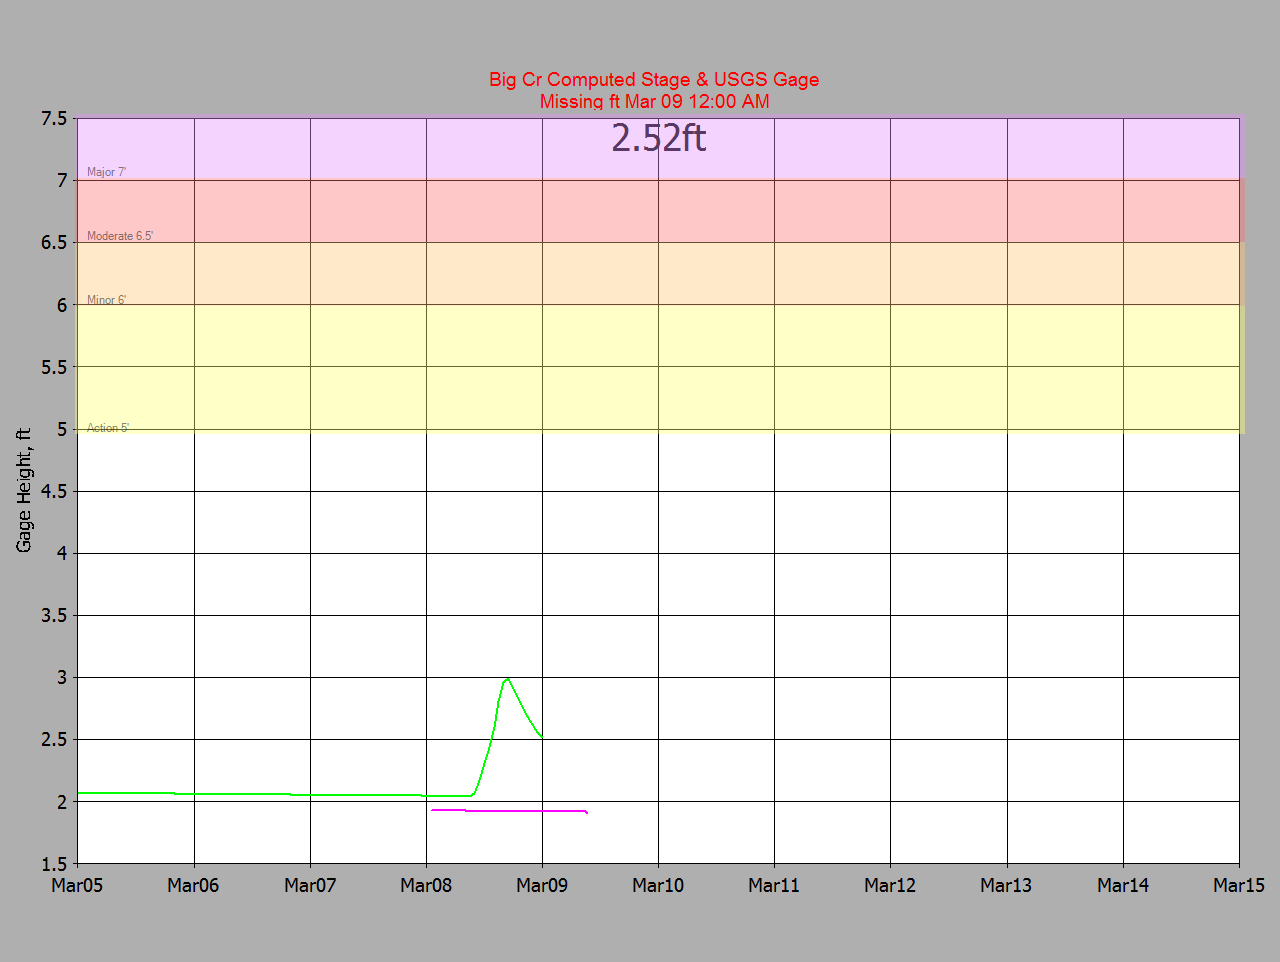
Current GetGraphs (second series referred to as pink,
2nd series for frequencies is depth, x-scale minutes):
Triangles forecast alerts.
My free GetNexrad will automate posting each 5-minute radar update to your
website like this...
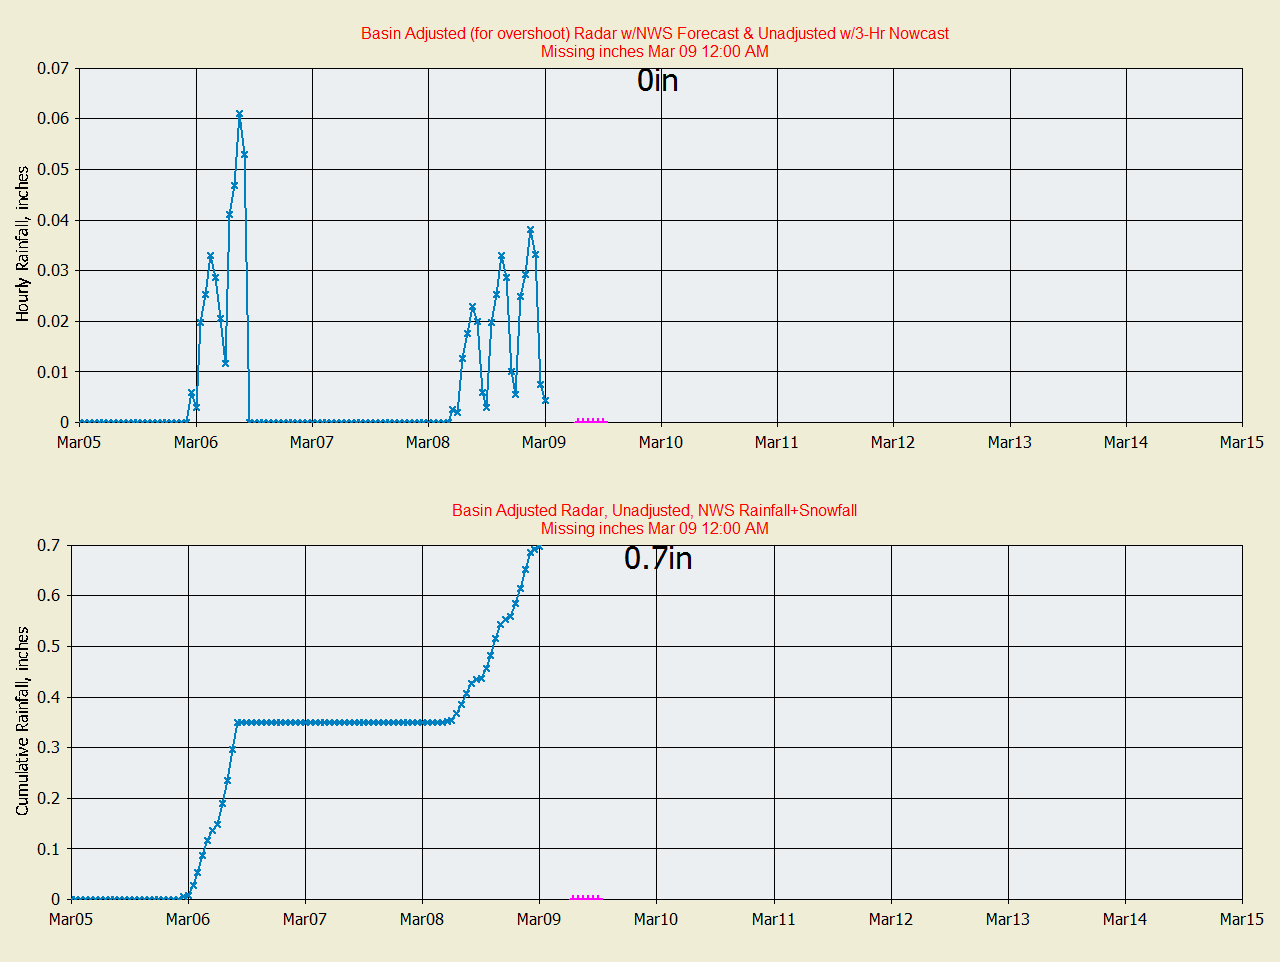
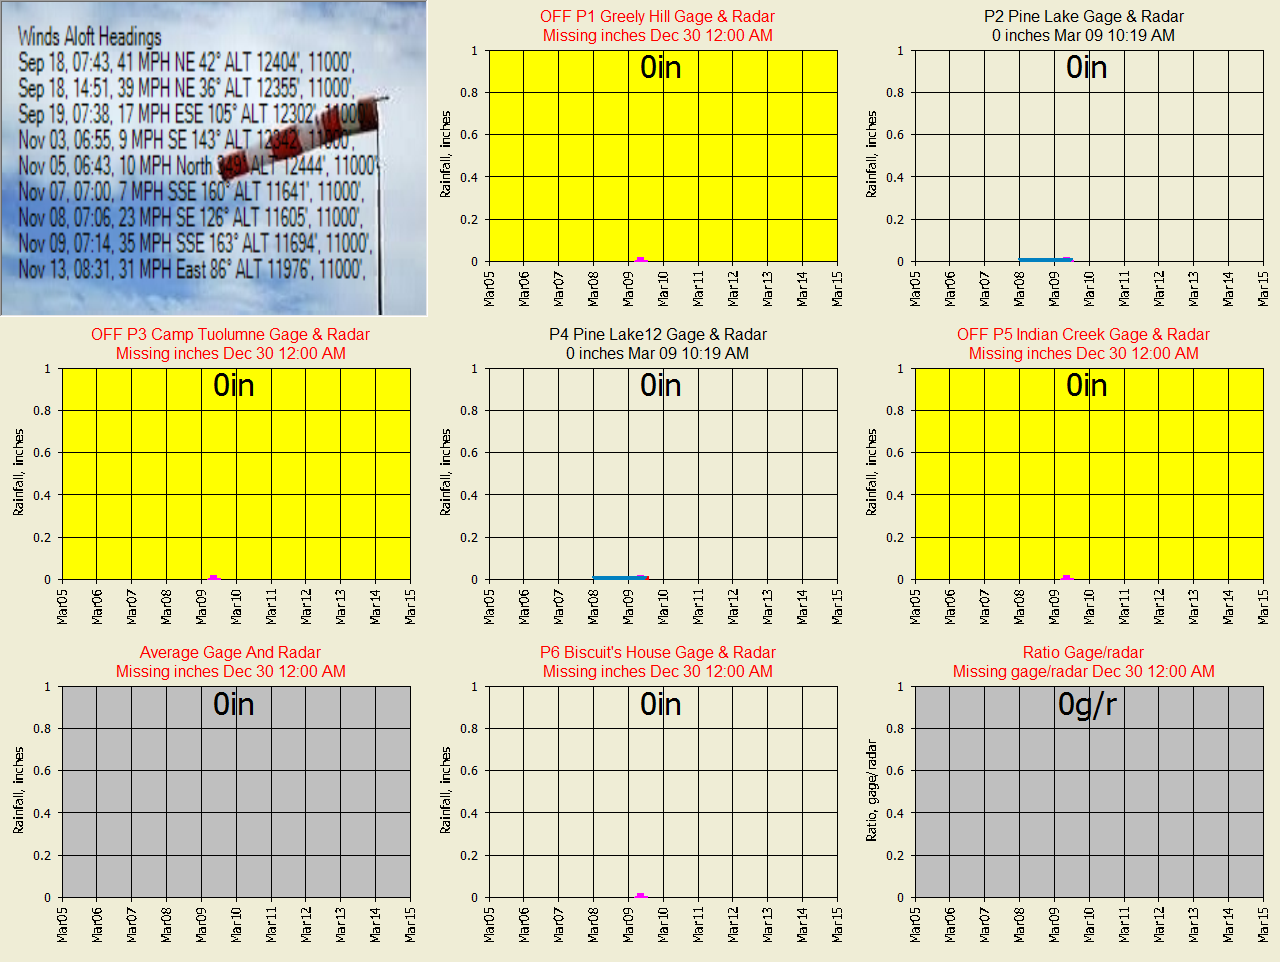
Last event 2 day's rainfall at the gages and
adjusted radar till now over Big Creek, CA. The DAX radar went down Feb 17
so DAX-NCQ composite of all nearby radars is now being used:
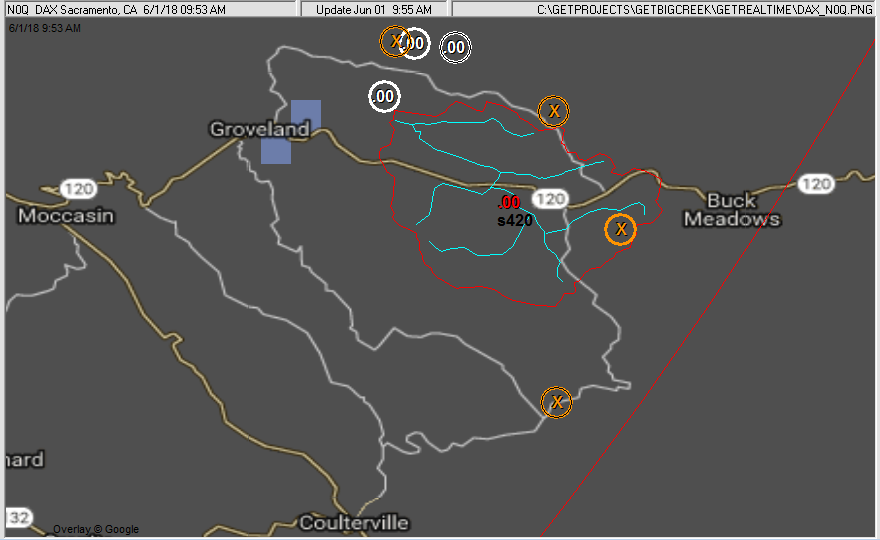
Radar cells are about 0.6 miles wide.
White circles gage ON, black gage OFF, red g/r adjusted precip.
Daily
Pricip Accumulations with Adjusted Big Creek Basin:
Hourly Point Precip and Adjusted Basin (continued):
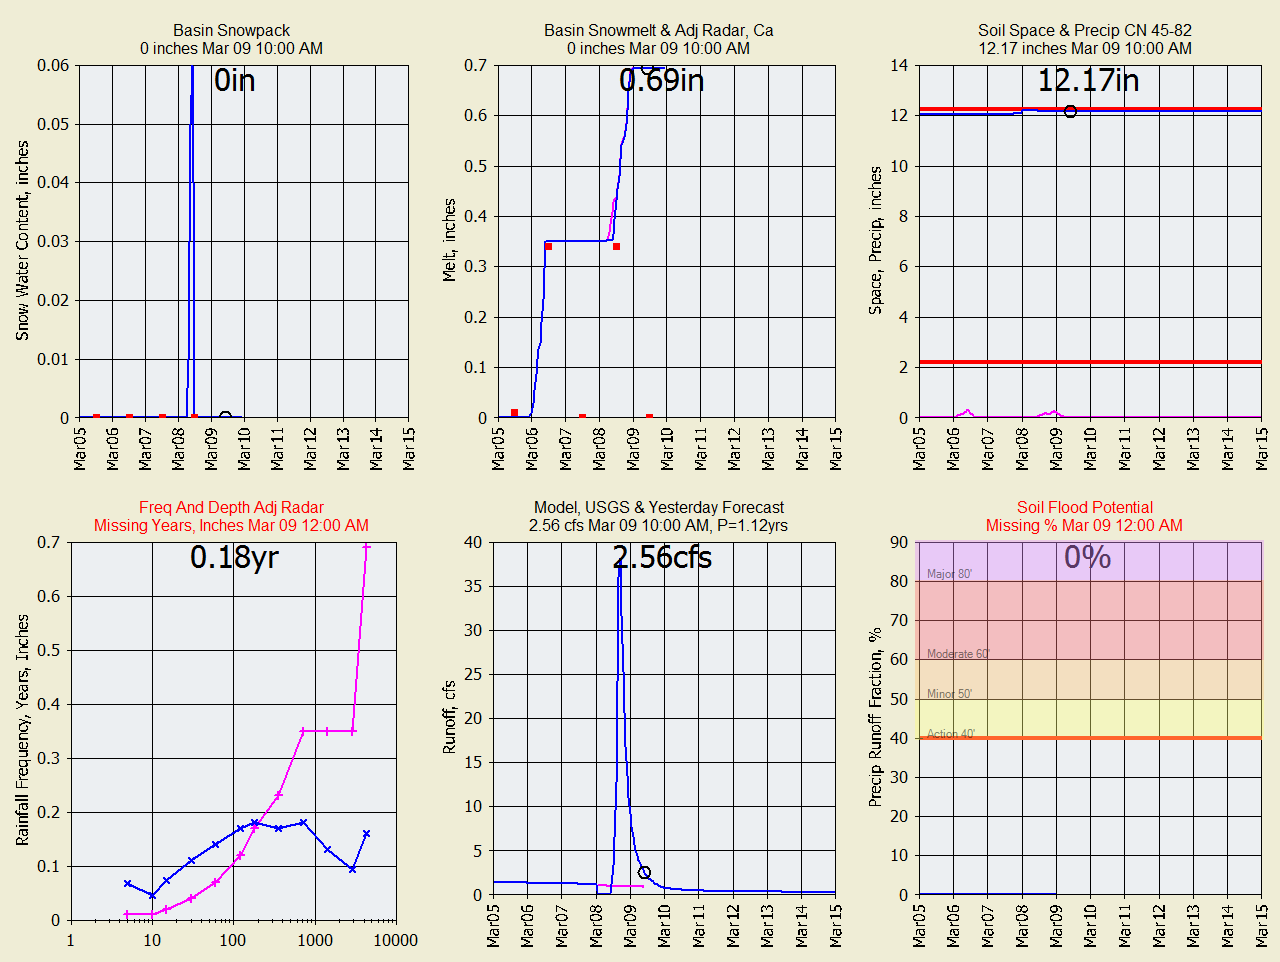
Soil Space as SCS Curve Number:
(when the soil get's into the 70's you're sitting on a time bomb)
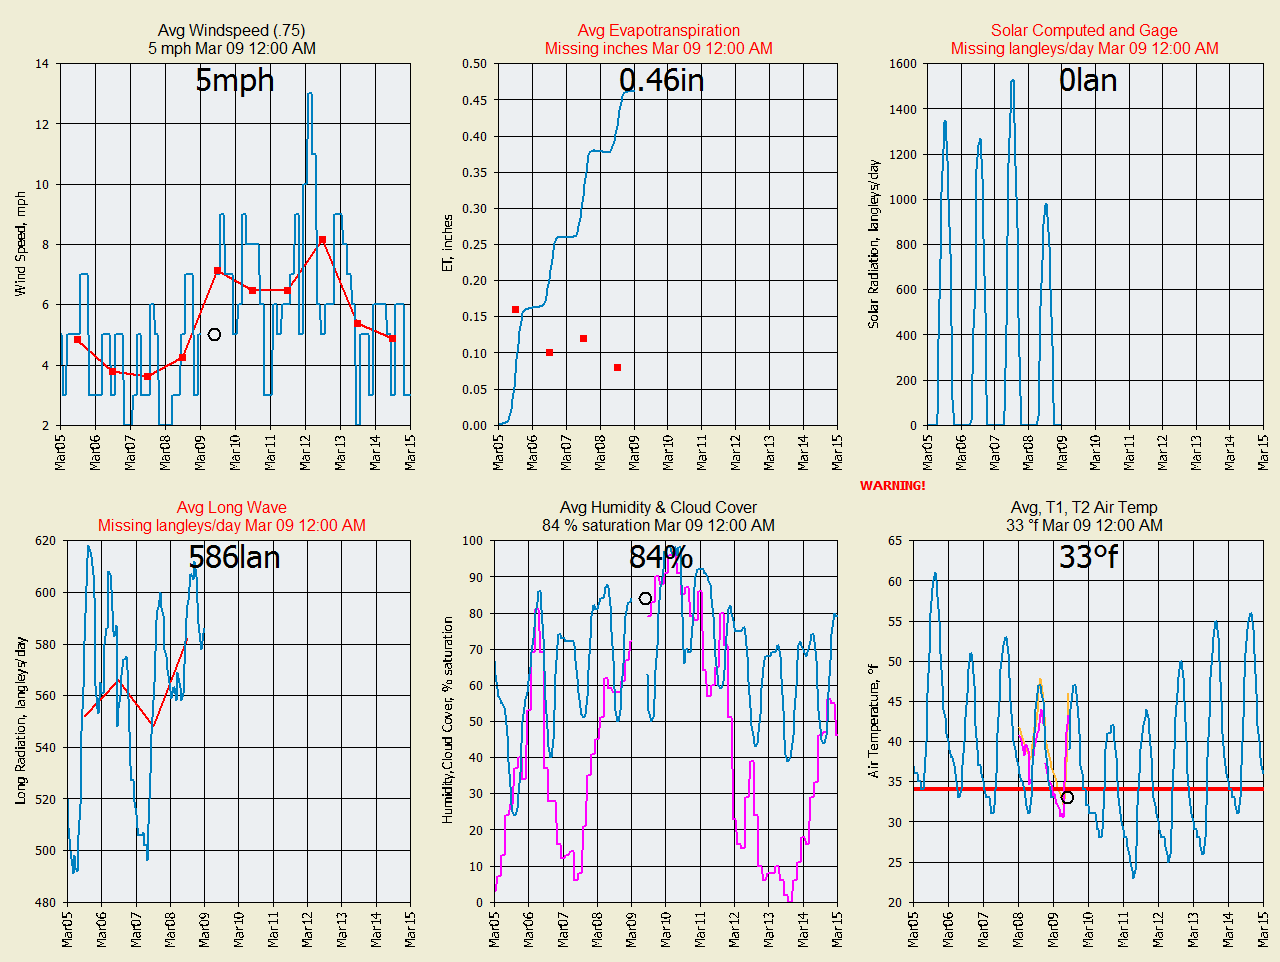
Daily Minimum Temperature:
Runoff:
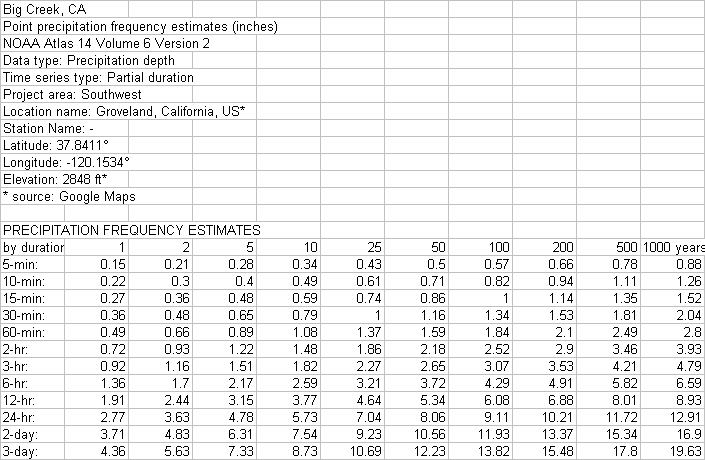
NOAA Atlas 14 freqency table used in GetGraphs above:
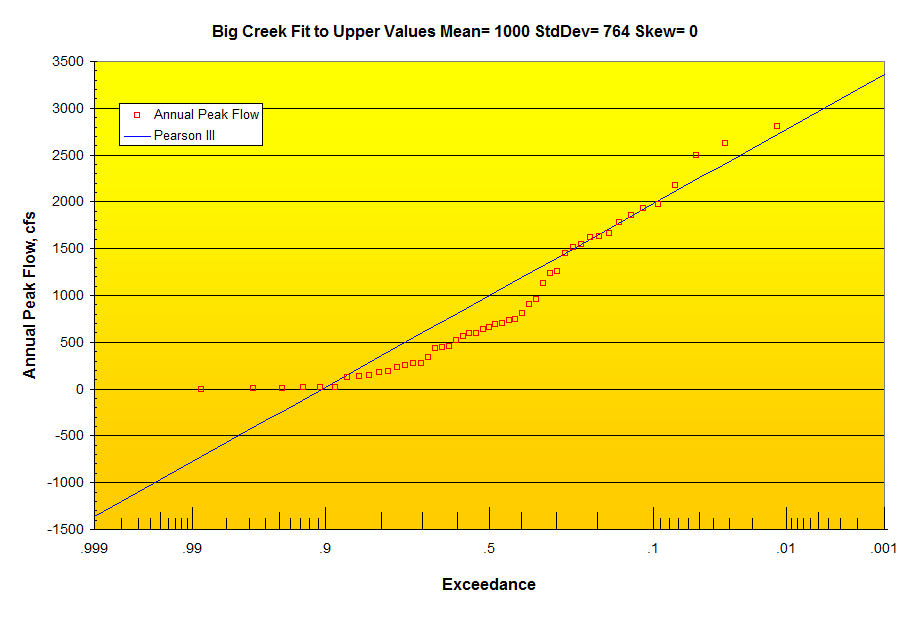
Annual Peaks and Exceedance Curve used for P= in GetGraphs above:
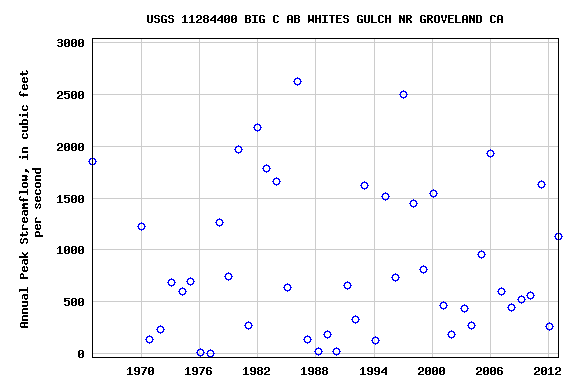
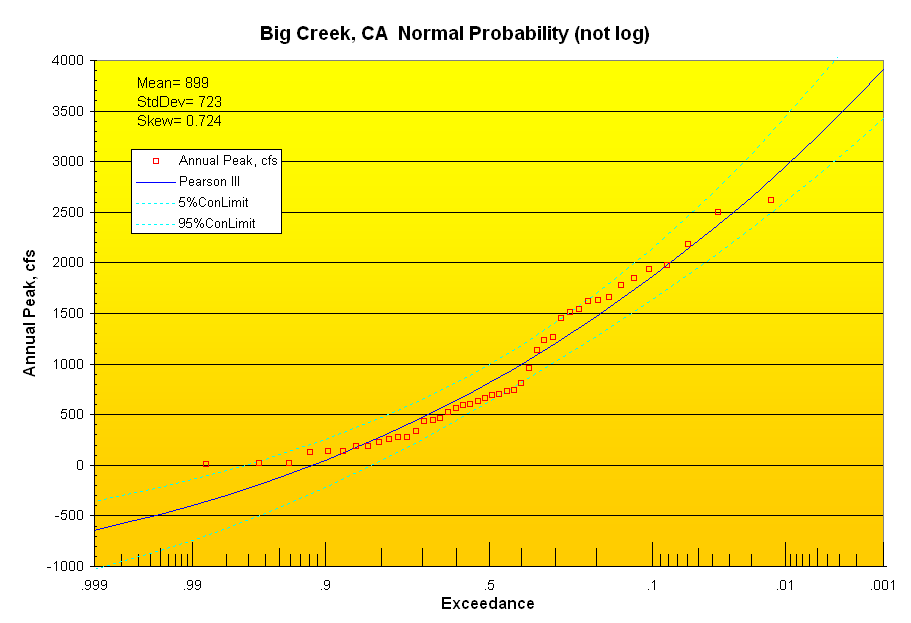
Looks to be 2 populations here that should be fit separately and convoluted for
the final curve which will be a tick above both with a bit more as they cross.
This would take the upward skew out of the upper population.
Revised with 2017 peak of record and upper values fitted only:
Important Note: Nothing on this page is intended as
interpretation of any legal authority such as water rights and supply. This page
is intended solely as a demonstration of techniques in flood potential
monitoring. The reader assumes all risk for any damages whatsoever in connection
with the access, use, quality, or performance of the supplied data just so you
know.