|
NWS text warnings, alerts, Surface Observations, Precip & Flood Forecasts
A side bar web browser for more weather info or your web page of interest
And Lat/Long Gridded Historical Rainfall ... AND Storm Track Basin Rainfall
Forecasting.
May 2022: NWS has replaced the N0Q product with N0B and Iowa Mesonet has
updated to it. Same as N0Q in all respects so I don't get why.
Dec 2020: The NWS has discontinued making PNG/GIF images for all their
Nexrad Radar products. Iowa Mesonet is now the only source for select REALTIME
radar images. The discontinued day old NWS image products can still be manually
downloaded and processed by GetNexrad using the NWS 'Weather and Climate
Toolkit' (see below). The discontinued world files need to be installed for
GetNexrad to open radar sites you havent visited yet. To add
these needed files, download
Ridge1WorldFiles.zip and save the zip file in your GetNexrad folder. Unzip
and reset the destination to your GetNexrad folder like:
C:\Program Files (x86)\GetNexrad\
or if you use projects reset unzip destination like:
C:\GetProjects\GetDome\GetNexrad\
You should end up with a folder looking like:
..\GetNexrad\Ridge1WorldFiles\
GetNexrad is a tool used to view real-time area radar rainfall
loops and to generate the basin
point file (NexradPointESX10210.txt) used by
GetRealtime.exe for
computing the basin area average rainfall time series in real time at gridded and not so
gridded points. If you just want to download up to the past 4 hours of
radar images without using GetRealtime you can (and you
NASCAR racing
fans should skip to the
bottom of this page)... but you will be missing the power of GetRealtime to
maintain a real-time database of radar adjusted rainfall and runoff.
Includes the
31
Canadian C band radars (10-minute, 1 km, 2.5 dbz for past 48 hours).
GetNexrad converts radar dBZ to rainfall and snowfall amounts with loops and
graphical storm tracking. Storm ETA at
any point of interest. Alarms! for Weather Service issued
warnings. Mouse zoom and pan with drill down navigation from the mosaics
to radar sites and neighbor sites. Reads NOAA Weather Toolkit historical
radar KMZ
files and 0.5 dBZ long range higher resolution images. Goggle Map overlays,
real-time surface observations,
and a web browser sidebar for even more real-time weather info.
Getting Started:
Download GetNexrad and get started.
Determine and save exact point locations on the radar image.
Determine and save boundary area pixel locations on the radar image.
Getting started with Level 2 and Level 3 HISTORICAL radar images.
Gridded Lat, Long Rainfall Output (and not so gridded).
"Niagara Falls!
slowy I turned... step by step... Nexrad is migrating to Ridge 2.
View port aspect ratio setting for wide screens.
Current Surface Obs/Analysis for Temp, Dew Point, Gusts, Pressure, Wind Barbs.
Graphical Storm Tracking and Forecasting.
Display subbasins, stream lines, data values, and thumbnail plots.
Depth-Duration-Frequency tables.
Batch Mode.
Coordinating Setup Folders with GetRealtime.
Multiple Setup Files.
Display all Canadian radars.
Traditional area average rainfall is obtained by rainfall gages located in or
near the area of interest and averaging the rain gage amounts using many
methods. If you’re lucky you might
find a rain gage nearby or you would have to install and maintain a network of
rain gages yourself. The tools
presented here will allow you to create point rainfall rates ANYWHERE in the
USA and greatly improve area averaged
amounts and best of all IT’S FREE!!! Update 2/17/10: 'ANYWHERE' is a
bit of an exaggeration. It's more like 70 miles or less from a radar site
in winter without your help and 'greatly improve' is really going out on a limb, but read on...
it's still free.
The National Oceanic and Atmospheric Administration (NOAA) is a fantastic
government agency responsible for the majority of the weather data and alerts in
the United States. Using their publicly available and easily accessible
reflectivity data from one of the WSR-88D class radar systems (NEXRAD), the
tools presented here will show you how to choose a location and set up rainfall
collection for a precise geographical area... or you can just click on a location
on the fly willy nilly.
NOAA’s explanation of the
WSR-88D radar
system. (or http://www.roc.noaa.gov/)
Do you want the truth? You can't handle
the truth.
Let's have
a
conversation... not to fear...venture on because we will adjust it. Forget
about their dumb rationalization for their perfect radar and the odds of getting
a half mile volume from 10,000 ft in a stiff wind to fit through an off centered
8" hole, we will make that darn radar fit in that 8 inch hole one way or another
with a whole lot better results than those ol' naysayers at headquarters can do
(N1P)... so read on (we don't have the task of the whole radar field like they
do.)
GetNexrad
Requirements:
Hardware--MS Windows 98 or better with display of
24?-bit colors...probably
not a deal killer so try it (gdiplus.dll graphics is used and can be downloaded from
Microsoft for free for Windows 2000/98).
Software--For a single point rainfall, see LatLongPixels.exe below. For
area averaged rainfall, GetMapArea version 2.5 or later
is a must for creating the basin boundary, optionally
GetRealtime for automating real time collection, storage, and display of the
basin rainfall. If you have your basin boundary already in a Lat/Long
file, then see LatLongPixelsFromFile.exe below also. These softwares are available
online for free at www.GetMyRealtime.com.
Image Acquisition--Level III GIF images NOAA Ridge Version 1, 600x550 pixels.
(NOAA Ridge Version 2 PNG higher resolution images 1000x1000 pixels is
reschedluled for operation March (you pick the year) and GetNexrad 2.3 now reads the
Ridge2 Testbed with new higher resolution dBz products.)
The WSR-88D class radar systems have many acquisition modes for developing data
on atmospheric precipitation. The most commonly used form of radar rainfall energy return
mapping are the Base and Composite Reflectivity, and also the 1-Hour Total
Precipitation. The 1-Hour Total image (N1P) has had additional processing to
better correlate with actual rainfall for different seasons and areas so they
say, but I would stick with N0R (and now N0Q!!!!) and you will be way ahead in this game, believe
me. We
can use any of
these three images for the processing of localized precipitation information.
There are 2 levels of precision for NEXRAD data but only one for graphic images
in real-time. We
will be using Level 3 products for real-time in the form of downlaoded GIF images
every 5 minutes. All Nexrad products are available historically through their
WTC toolkit. Here are the
difference in data precision:
LEVEL 3 (NOAA images provided in real-time):
Each of the 360 base scans at 0.5 degree tilt radar beam half power cones is
divided into scan volume bins that each covers 0.6 miles in range and would be
1.2 miles wide and high at the 75 mile mid-range bin and would be scanning at a
mid-beam elevation of 6,600 feet with standard refraction above the radar
elevation. Each of the 550x600 pixels of the radar gif image is about 0.009
degrees of latitude and longitude or about 0.6 miles x 0.5 miles which easily
handles all the Level-3 binary product's spatial resolution. The dBz resolution
is 5 dbz in 16 steps above zero. A great new real-time higher resolution base reflectivity
product is N0Q at
1 degree x 0.6 miles x 0.5 dbz at 1000x1000
pixel png but images are only available on the
new Ridge2 Testbed (and Iowa Mesonet), skip below here. N0Q sure looks
like Level 2 data to me! YES!!! It's like pulling teeth to get more colors
from them old farts at headquarters.... Actully the 'Lite' images I am starting
to find very useful too in my scanning web browser apps.
LEVEL 2 (requires NOAA's Tool Kit image output):
The azimuthal resolution is doubled from 1 degree to 0.5 degree, reflectivity
bin gate spacing is dequadrupled from 0.6 miles to 0.16 miles, and
increased Doppler data (wind speed) range from 143 miles to 186 miles. The dBz
resolution is increased 10 fold from 5 dbz to 0.5 dbz. As my inside
contact Tim says, Not bad for the sleepy old goats I protrayed them to be. ;-)
NOAA NEXRAD data
is free at
both resolutions but in a binary format that must be processed by the user into
visual content using their free NOAA Weather Toolkit. You can download and
try their free software here. Update on NOAA's tool kit. The latest
version provides everything we need as KMZ animated files to provide
historical radar PNG image files.
The output KMZ files must be renamed to *.ZIP so that Windows Explorer can
extract the PNG image files and the KML world file. Now Level 2 PNG
historical and real-time images can be read by GetNexrad.exe and the GetAcess
Database updated (see below).
Looks like the Holy Grail of Level 2 in
graphic format is finally on the menu boys. Huge Thank You to NOAA
and the Toolkit Guy!!! I will try
some historical comparisons of Level 2
versus Level 3 real-time to see how the resolution effects compare at some
locations that have already been processed in real-time. It takes more
than an hour to process the over 300 images for a day's duration, so this
historical stuff isn't so cheap and easy in mine and my processor time...
although the Toolkit still allows continuing other PC stuff.
Level 2 in all of its Magnificent Glory!!! (990x864 png)
Ok, you had to have been there. (Catalog
KTWX_V03_20090601_210444_REF_0053-60615.png)
For comparison, here is Level 3 at the same zoom
(990x864 png):
I forgot to recreate the overlay
so it looks like the zoom covers the whole state of Kansas. Both radar
images are actually about 50 miles x 50 miles.
The great new N0Q didnt exist at the time for comparison.
**********************************
Jump Start Tutorial for Getting Started with GetNexrad.exe Ver. 3.x:
1) Download the setup file 'setupGetNexrad.exe', install, and read the
'README.txt' file.
Tip: On Windows 7 or Windows 8 always run these setups as Administrator. From
Windows Explorer right click on the setup.exe file and select Run as
administrator.
(If you watched the Youtube Getting Started you no longer have to extract the
mosaic overlays.)
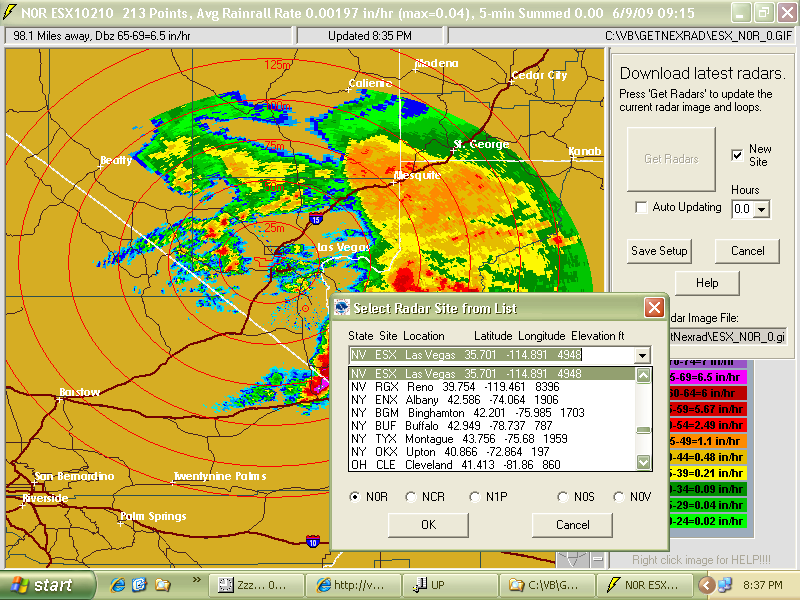
2) Fire up GetNexrad.exe, Right Click the radar image for the
update menu, check the 'New Site' box on the update radar screen in the upper
right menu, and press the large 'Update Radar' button. Then select from the
radar list 'US USA ConUS' to view the radar mosaic for the full Continental USA
N0R reflectivity.
3) The USA Mosaic update shows current radar reflectivity for the US. Double Click on a hot spot of reflectivity to zoom in on, and the
Regional Mosaic for that location will be downloaded and displayed.
4) The Regional Mosaic shows the same current radar reflectivity for just
that region. Double Click on a hot spot of reflectivity to zoom in
on and finally the Radar Site for that hot spot will be downloaded and a message
will be shown saying that overlay files and a world location file have also been
downloaded.
5) Click the 'Create Overlay' menu button to convert these files
into a single usable overlay file and the radar image will then appear with the
overlay displayed. This is only needed once for each new radar site.
6) You may zoom and pan the image with the mouse wheel and drag the image
around, right mouse click to toggle menus.
7) To go to a neighboring radar site just Double Click the
radar site image in the new direction in the area beyond the 144 mile range
and the radar site nearest to that click location will be downloaded.
8) To back up through your current session of radar images, click the
'Stepping' check box on the upper right menu and the stepping command
buttons will be displayed in the top center of the screen. Click the
'<<<'
back button to step backward through your images now on file. At any point
you can repeat the downward drilling or zooming process above.
9) To create a radar looping sequence, Right Click the radar
image for the update menu, set the 'Hours' for the duration of the radar loop and
press the large 'Update Radar' button. The looping
sequence of images for the current image will begin. This will also reset
the session images that can be backward stepped into that had been set above.
All downloaded images will remain on file for later viewing and for your
housekeeping duties (just delete them as desired and empty your Recycle Bin).
10) With a looping radar sequence in motion, Select a hot spot by
Left Click to set a 1 pixel point location to convert the radar image
colors into a running total of rainfal in inches for the point you chose. Double
Click to clear current location then
Left Click a new location to select a
different point. Click the 'Graph' box to watch it accumulate.
See storm tracking at bottom to figure out what those other clicks do.
11) To start the process above all over again from any point, press the
'Select Radar Gif Image' menu button and select the full 'USA_N0R_0.gif'
image or any other image for your new starting point. You do this enough
and you will soon get to be an expert in US geography and city names. I've
been everywhere man! I wonder how long it would take to have downloaded
every radar site overlay. I'm working on it!!!
12) To create ZOOMED google map overalys, just zoom in
before you create your overlays. To reset the overlays, just hit the 'reset'
button beside the 'Create' button. To re-zoom hit the same button. You can only zoom as far as 2
radar pixel widths on your screen due to my integer pixel math (1-1=0).
The old N0R point and boundaries will not plot on zoomed N0Q images so use
'Create Point File' to convert them to N0Q or start from scratch (recommended)
or use N0R boundaries only on N0R images.
And remember all points will plot at radar pixel centers so don't try to figure
out why your house doesn't even plot on your street because the nearest
radar pixel is as good
as it gets and all that matters. Update 1/30/2014--LatLongPixel.exe has
been updated to write the decimal centroid pixel, but you will
have to redo your point boundaries.
To get your mind straight about this, a good check for everything is the only
known point on the radar image and that is the radar location. So you
could use LatLongPixels or LatLongPixelsFromFile and create a point boundary
from the known radar lat/long. Because the radar lat/long may not be exact
it should plot very close to the zoomed Google Topo satalite underlay image when
zoomed in to the max beacuse its not a pixel center... BUT the same lat/long
pixel center from a boundary file will be at the center of the pixel, just a
smidgen off. Give it a try to see what I mean (see update just above).
13) The next step, if you accept this mission, is to install GetMyRealtime.exe and create a point or area
averaged rainfall/snowpack record for you location of choice as described below.
**********************************
Getting Started
with GetNexrad Video:
Rainfall Z-R Conversion:
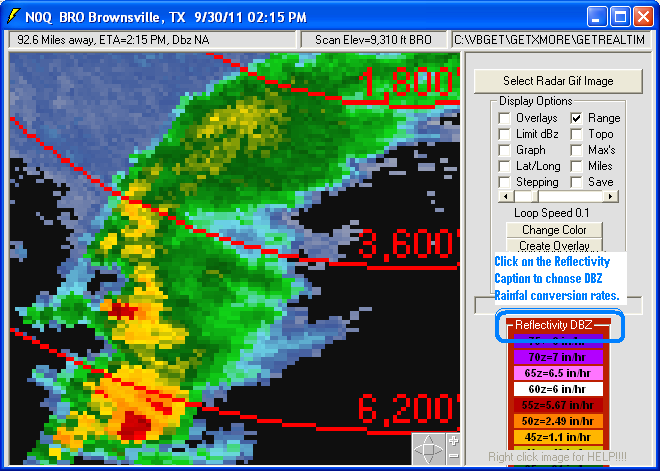
You can change the N0Q, N0R, and NCR dBz to Rainfall Rates by clicking on the
Reflectivity DBZ legend value to change and edit the value in the upper left
screen text box for the current session or... Now even easier is to click on the
DBZ Caption and select the conversion type as skip below here.
AlsoI have updated GetNerad.exe dated 8/11/10 to allow users to change the
rainfall default rates by including the optional file 'Dbz2Rainrate.txt' that
has just the one line that could look likes this:
0, 0, 0.03, 0.06, 0.14, 0.32, 0.73, 1.65, 3.77 (now includes 10
and 15 dbz that are usually zero)
The values above are for the standard NWS Convective Storm rates shifted
higher by 2.5 dbz. The upper values
were not changed and so are not included.
Also the NWS sometimes even double the Convective Rates above for the dBz
range up to 55 dbz for the terror of the atmosphere... TROPICAL RATES!!!
Luckily these doubled rates only occur in the U.S. with hurricanes but... each
radar site will probably experience a Tropical event during a forecasters
career. Boy, I would not want to be that forecaster. Events like Big Thompson,
Colorado and Johnstown PA are
examples descibed here.
The formulas below are from the NOAA ROC for other conversions you may wish to
try:
Marshall-Palmer (Z=200R^1.6) General stratiform precipitation
East-Cool Stratiform (Z=130R^2.0) Winter precipitation - east of
continental divide
West-Cool Stratiform (Z=75R^2.0) Winter precipitation - west ofcontinental
divide
WSR-88D Convective (Z=300R^1.4) Summer deep convection
Rosenfeld Tropical (Z=250R^1.2) Tropical convective
Viewed in context it appears I may want to look into using the East/West Cool Stratiform values for
winter and Tropical for hurricanes.
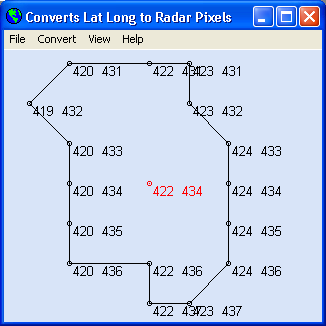
Included is the utility program LatLongPixels.exe used to convert any Latitude and Longitude for any point on any Radar site
image to X,Y pixels. Wunderground
weather stations include their Lat/Long and this utility will make it easier to
more accurately determine its point file value.
Update 7/17/2012, If
you already have boundary files in Lat/Long's then you can use
LatLongPixelsFromFile.exe included in the full GetNexrad download
to convert them to a GetNexrad and GetRealtime boundary pixel format. You
can use LatLongPixelsFromFile's 'View', 'Other Boundary Files' to also view your
regualar NexradBoundaryESX10nnn.txt files and to show each boundary point
location. This can help on small basins for checking point file 0's
and 1's.
Update 3/1/2014: LatLongPixelsFromFile.exe can also read your current
NexradBoundaryBMX10612Q.txt radar BMX file and convert it to another nearby radar site like
NexradBoundaryMXX10612Q.txt. Both multi-point boundarys and single point
boundarys.
It may also be a good idea to always use GetMapArea to
digitize your boundarys in Lat/Long instead of Pixels now because they
can be converted by LatLongPixelsFromFile to any Nexrad product and the
Lat/Long's may prove useful in the future. To wit... LatLongPixelsFromFile
can now save your lat/long boundary to a KML file for zoomed in viewing with
Google Earth. WeatherToolkit KMZ's can now be overlayed by your boundary
KML...with 'Open' your kml file. Not sure why but you could. Ok, I
am working on zoomed google overlays someday in GetNexrad... update...the future
is now! GetNexrad with ZOOM!!!
Important Update 8/24/2016: The free Googe Earth Pro can
save its 'Add', 'Polygon' to KML file so you can now use my
GoogleKML2Text.exe from the
download page to convert Google's KML to text for use by
LatLongPixelsFromFile.exe. You can use GetMapArea to load the EPA Waters
hydro units and catchments and then use Googles 'Add', 'Polygon' and save
to kml. Time marches on! I remember drawing a line on my mouse as a
pointer and VERY carefully digitizing paper USGS maps.
LatLongPixelsFromFile:
Saved as KML for zoomed viewing on Google Earth:
LatLongPixels:
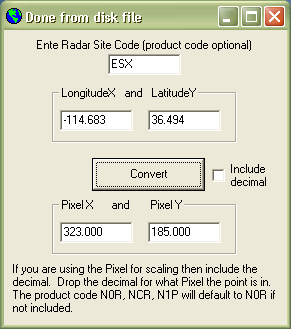
Knowing the Wunderground Rainfall gage location of 323, 185 in pixels you can create the
Boundary and Point files using Notepad like this:
Title Line for Boundary File example for a Single Point Rainfall
322, 184
322, 186
324, 186
324, 184
322, 184
Xmin 322, Ymin 184, Xmax 324, Ymax 186
Centroid= 323, 185
The Point File is just these 2 lines:
323,185,323,185
1
Or you can let LatLongPixels latest version create the single point boundary and
point files for you. These 2 files are then copied to your Nexrad Radar
Gif file folder where GetNexrad and GetRealtime can find them.
If you would like to compute the whole radar screen area average rainfall or
maximum values for NET and NVL then here is an example Boundary file for pixel
values that you can have GetNexrad compute the point file for that will cover
the whole 143 mile radar radius area.
Grand Junction Full Radar Area
10,50
10,499
589,499
589,50
10,50
Xmin 10, Ymin 50, Xmax 589, Ymax 499
Centroid= 299,274
Creating a point location with LatLongPixels.exe video:
I should mention that the Lat/Long Nexrad radar site positions given by the NWS
are only to 3 decimal places and should be 4 for proper display of range rings
and radar point relative to images. For my frequent radar sites I have
used Google Earth to find the radar and update my tab
delimited file 'RadarSites.txt' to 4 decimals. 4 decimals for lat/long is
a good rule of thumb for this stuff. Having a good radar location
is also useful for checking that KMZ Toolkit zoomed images are what you think
and I try to include the radar for them if possible (there is no dBZ around
radar points.).
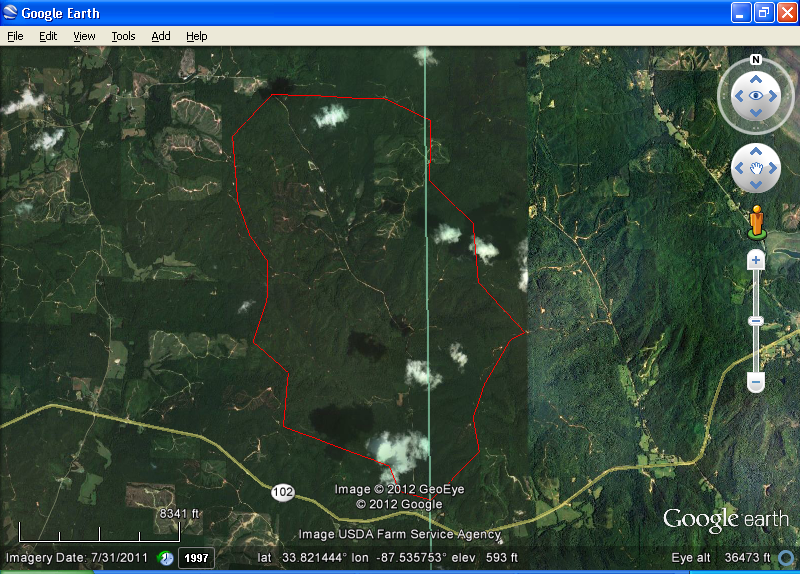
I found that you can digitize a lat/long boundary directly in Google
Earth also. To do this click 'Add', 'Path' and give it a name but do
not close this name box until you have finished. Click away and then close the
box. Now on the 'View', 'Sidebar', 'My Places' you should see your boundary
name. Right click on it and 'Save As' a KML file. Open the saved KML file with
Notepad and cut and paste the lat/longs into Excel and away you go. Basin area
computation has been added to LatLongPixelsFromFile.exe so you do not have to
redigitize the boundary for the basin area as square miles.
Area Averaged Boundaries::
For definition of Nexrad image pixel locations and boundaries, the GetMapArea's
General Pixel scale can be set on maps like the Big Google Map image options.
Use my GetMapArea's 'Google Map Lat/Long' option to locate Lat/Long point locations.
Find 2 intersections of the highways or text or something located within your better map view that
are located roughly on a screen diagonal to enable determing both the X and Y
scaling. locations at about the same
screen height would poorly determine the Y scaling so choose 2 points on a
screen diagonal. With the 2 long/lat pair of values use LatLongPixels.exe to
convert them to radar image pixel X,Y pairs. Use the 2 X,Y pixel pair
values to set GetMapArea scale on the better map using the 'General Pixels'
method. You now can create a better defined pixel boundary file for use with
GetNexrad.exe and GetRealtime.exe.
For an example of the Better Maps method
go here.
*** USGS MAP VIEWER GetMapArea Menu Option *** This option is something new and
very buggy from the USGS. Do not use the scale legend for scaling. Its probably
100% off. Add scanned topo and use the 6 mile township or 1 mile section lines or Google Earth 2
points and calculate the horizontal distance. Hydrography + Scanned Topo or
Contours is really good for determing boundaries. Even has the lat/long so this
option will probably become your map source of choice. Just follow the cut and
paste instructions above for Google Maps. AND DON"T USE THE SCALE
LEGEND OR DISTANCE CALCULATOR!
***WATERSKMZ by the EPA*** This option is accessed by your Web Browser outside
of GetMapArea at:
http://www.epa.gov/waters/tools/WATERSKMZ/WATERSKMZ.html
Click on the (Raster).KMZ and zoom in to even small defined 'Catchments' and
'HUCs' on Google Earth. This may be even better than the USGS Map Viewer
above... and again copy/paste and use Lat/Long scaling to digitize your boundary
in GetMapArea or you can even use Google Earth to to digitize and save a path
file from the side bar and import into Excel (tip: dont close the path info
until finished, then press OK)
If you use Google Earth for an image be very sure you have not zoomed in so far
that it is skewed by 'Ground View'. You can turn off this skewing by
'Tools', 'Options', 'Navigation' and check 'Do not automatically tilt
while zooming'.
Creating a Boundary Area with GetMapArea.exe video:
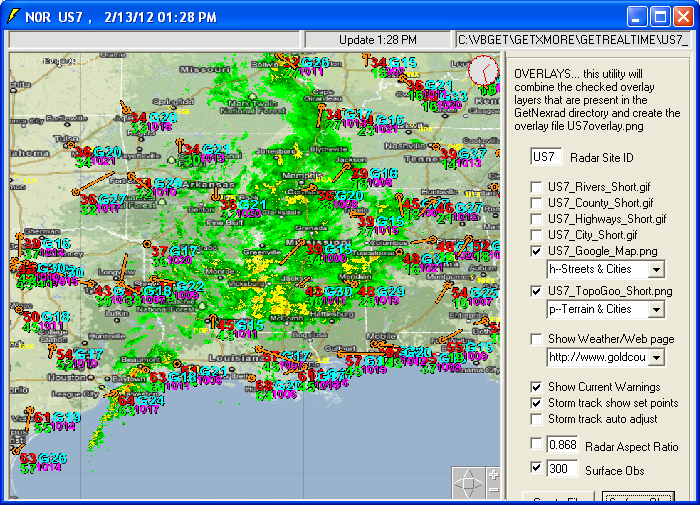
Creating Overlays:
To create a radar image overlay file like ESXoverlay.png follow these steps:
1) Start with your new radar location of interest. Simply Right Click the radar image as shown below and check 'New
Site' and press 'Get Radars'. Select the new radar site and all the needed
files for creating a new site overlay will be downloaded. Then simply
folow the prompts... but you still need the Boundary and
Point files to calculate rainfall. By the way, radar images will be dated in
your PC's time zone, not radar time, not universal time, not Greenich... your time!...
deal with it!... Actually now you may adjust the recorded time in the Access
Database using the 'rtable' parameter 'shift_time' to any time, even back to
Zulu.
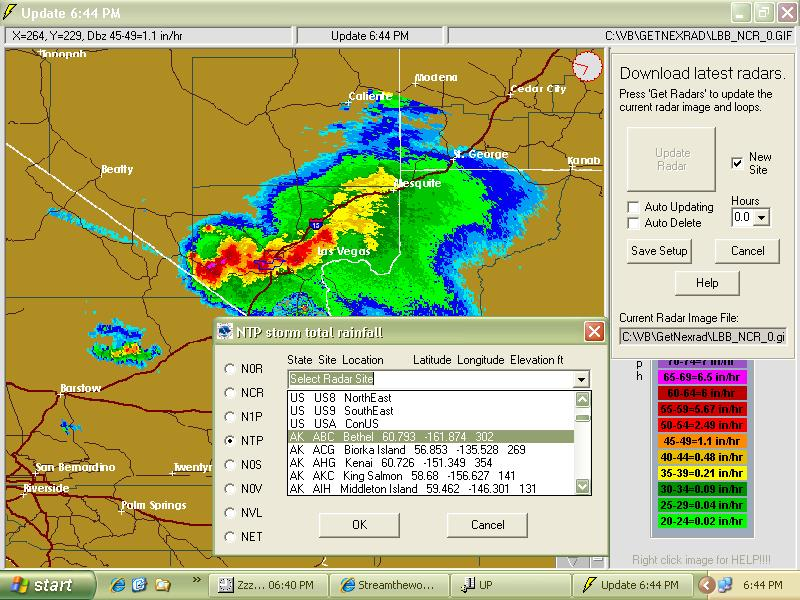
GetNexrad can down load the past 4 hours of radar reflectivity, precip,
and velocity gif images in case
you have not set up GetRealtime.exe or are not staying current by running
GetRealtime.exe in batch mode. Right click the radar image
and select the number of hours to retrieve and press the 'Get Radars' button.
Remember, GetNexrad.exe is firstly a tool for viewing saved images from
GetRealtime and thinks you know your radar sites by radar and product code and uses
the 'Select Radar Gif Image' to get the currently downloaded
images for viewing which you can then update by a right click of the image and
'Get Radars'. Select multiple GetRealtime saved files for looping. And be sure to
empty your Recycle Bin often or your mom will not be pleased. General
Nexrad questions are answered
here.
Now that you can convert a radar image to rainfall you might ask, "Does
this radar stuff really work?".
Well, I am up to the challenge, what say you? Check out my rainfall comparisons here.
And for an automated real-time Nexrad to Rainfall to Runoff example study
go here. These two studies show the
process I went through learning how NEXRAD radar works. For a complete list of
current studies that include radar adjustment and snowmelt see my web's
Site Map.
If you are viewing an auto updating radar loop and you minimize the
GetNexrad window, then the current cumulative rainfall and time will be
displayed in the Windows tray. It will be updated every 3 minutes
as the loop is updated and you can go about your other work with out missing any
rainfall or wasting cpu usage..
You can navigate starting with the
USA_N0R_0.GIF mosaic radar image down to the regional moasic images, and then
down to the nearest radar site by double clicking on these images on the points
of interest. Once you are at the radar site, you can navigate to nearby radar
sites by double clicking on the area beyond the 144 mile range in the direction
you want to go.
That’s almost it. I hope you will take the next
step in setting up GetRealtime to automate retrieval, storage, and display of
your basin of interest’s rainfall amounts and learn how to compute runoff and
route it. GetMapArea is an easy and
fun way to get started computing runoff.
You can check for the latest GetNexrad.exe version and download just that file
here and just copy it over
your older version.
Toggle menus by right mouse clicks on the image. The radar image can be
panned and
zoomed using the icon in the image lower right corner or use the mouse wheel or just drag
the image. Click the icon center to reset the zoom and pan. The
circle drawn around the point pixel is to help the viewer locate the point on
the screen and is a 6 mile radius.
NOTES:
Sometimes a corrupt radar gif file will freeze the GetNexrad.exe
program and the offending gif file should be deleted. If the offending gif file
is your default gif file on start up, then you will have to delete the gif
manually using Windows Explorer.
If you would like to be able to select the radar site location itself as
the center of the range instead of your point or boundary location then you can
copy the dummy text file named 'RadarSite' without the '.txt' extention
in the GetNexrad directory to your directory for your radar gif files. You can then
select it from the list of boundaries displayed when you press 'Select Radar Gif
Image'.
GetNexrad
version 2.3 supports the 10 regional US mosaics and the entire continental
US radar gifs. LatLongPixels.exe has been updated also to support lat/long
to pixel locations on these gifs. Areal averaged rainfall for basins the
size of Texas are now possible. GetNexrad 2.3 comes with state overlays for
these mosaics because the NWS does not supply them.
GetNexrad version 2.3.1 has added radar station ID's AA0 to AA9 to
the file 'radarfiles.txt' for anyone wanting to add some of their favorite web
url's for Gif, Jpeg, or Png file formats. Just use Notepad to edit or
replace any of the AA sites I have added seperating each field with a tab.
I have added some Warning Gifs, a Satelite Jpg, and a live cam Jpg of a Nexrad
radar site 10,000 feet up in the Rockies.
Also I just noticed that when naming directories and folders, the letter
sequences '_N', '_AA', and '_US' will create a problem for GetNexrad determining
the radar product type. So use the character '_' with caution in your folder
names.
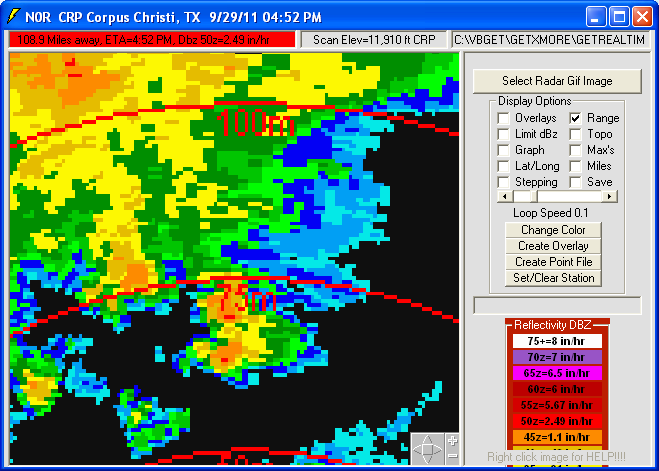
In addition to the milage (not nautical but real miles), the Range circles include
starting with the range miles at 12 o'clock and going clockwise, the radar
beam width in miles, the elevation in
feet above sea level for the bottom of the radar beam at the lowest scan angle
of 0.5 degrees with standard air refraction index of 1.21 and for the curvature
of a standard earth, and the center of the radar beam elevation. This info
will help explain why the image is more jagged and why winter storms can slip
under the radar the further you are from the radar site with all things being
standard.
**********************************
Getting started with Level 2 and Level 3 HISTORICAL radar images.:
New GetNexrad 3.6.0--Iowa State
University Mesonet historical N0Q images can now be directly loaded for a
loop of up to the past 24 hours (also by GetRealtime.exe). The historical period
for N0Q begins March 2010 or so and can vary. Prior to March 2010, use
Level2 history from WTC Toolkit below.
Be sure you have already viewed the real-time
product (N0Q, etc...) before
loading the Historical products. The real-time world location files
(*.gfw, *.pgw) will be needed. Update 8/14/2012, LatLongPixels now supports
KMZ world locations for finer tuning of you point and boundary locations files
but will specific to that download only due to possible image size changes so be
careful.
1) Install the free NOAA Weather and
Climate Toolkit Version 3.5.9 . Besure to click the link "-- Check
if you have a current version of Java installed --" before Launching the
download. Image colors change with each version so wct-3.5.9 and uses the
Level2RGB.txt file in Level2RGB3.5.9.zip.
WCT 3.6.5 uses the colors in
Level2RGB3.6.5.zip. I also checked WCT3.7.5 and the Level2 and N0Q colors
are still good... for now.
2) After installing the Toolkit, run the program "wct.exe" and you should be
looking at a map of the USA. Maximize the window so that you will get consistant
image sizes.
3) From the top menu select "Data", "Load Data", then select "THREDDS". Copy/Paste
either of these 2 THREDDS Catalog URL:
http://motherlode.ucar.edu:8080/thredds/catalog/nexrad/level3/catalog.xml
or
http://motherlode.ucar.edu:8080/thredds/catalog/nexrad/level2/catalog.xml
and
press the "List Files".
4) For Level 3, select the product code, N0R, for base reflectivity, then the
radar site code. Level 2 goes directly to radar site code. Select any date for
the last 30 days including the latest real-time image. To figure out what time
the radar UT is, select the latest date and look at the latest radar coded time.
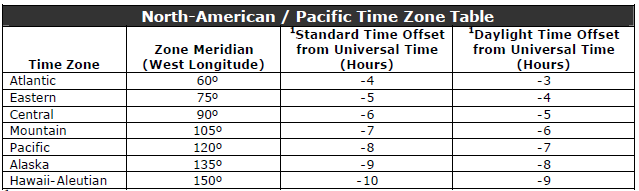
For Pacific Standard Time (winter), you would add 8 hours (7 hrs summer) to your watch time to get the
displayed radar UT zulu time.
5) Select the latest file displayed then press "Load" at the bottom of the form.
ALWAYS do this first to set a consistant image size. Once one radar image is
displayed, go back to the THREDDS form of displayed files and select several
covering your period of interest. Start with about 6 files for about a 1/2 hour
loop.
6) After selecting the 6 files, press the "Animate" button at the bottom of the
form and the Animate Wizard form will appear. Select the Animation Type= "Export
KMZ" which is a zipped file containing the 6 PNG images and a world location
file KML.
7) Press "Start" on the bottom of the form. The KMZ Export form will appear. I
have always selected "Drape over surface terrain" for the altitude. Then enter
the Output File name on your computer and press "GO" button and the KMZ file
will begin creation.
8) When finished the ANIMATION EXPORT COMPLETE form will appear. Select "No" for
now. Close the Data Selector form and close the program "wct.exe" NOAA Weather
and Climate Tookit.
9) Open your Windows Explorer and find the file you created "export.kmz". Right
click on the file and select Rename. Rename the file "export.ZIP" so that the
kmz file can be unzipped. Right click on the file "export.ZIP" and select
Extract All... and extract the images and KML file.
10) Delete the file "export.ZIP" and start up GetNexrad.exe. Using GetNexrad,
select "Select Radar Gif Image" and locate the 6 PNG images you extracted. You
will be notified that a world file was created from the KML file and that you
will have to Re Create Overlay if the image is a different size or locations. One thing about
the Toolkit output images is that if there is no rainfall on the radar, the
images will appear in red and oranges for some reason but that wont interfere
with our rainfall calculations.
11) If you have created NEXRADBOUNDARY and NEXRADPOINT files for your regular realtime images, copy them to the same location as your new PNG images just
created and you will be set to go (sort of). Any of the real-time boundary and point
files for Ridge 1 or Ridge 2 can be used. But for for zooming and better boundary
definition you should convert your N0Q or N0R boundarys to KMZ boundarys using
LatLongPixelsFromFile.exe. Just 'Open Input File' your *Q.txt boundry, 'Convert
Latlong to
Pixel', and 'Save Conversion'. Copy to your KMZ folder and 'Create Point File'
with GetNexrad. You can now zoom on KMZ images. YOU CANNOT ZOOM *Q.TXT
BOUNDARIES ON KMZ.
IMPORTANT!!! Always make sure your radar plots over the cone of silence.
If it does not, delete the file XXX_N0Q_0.kfw in your KMZ radar images and,
reset the zoom, and then reload a current N0Q image.
Warning: Never reuse a KMZ boundary file on other KMZ downloads
with the 'K': NexradBoundaryDTX10nnnK.txt
You could use your realtime N0Q boundary file but could be up to 1 or 2 pixels
off and very course: NexradBoundaryDTX10nnnQ.txt
12) If you select "Update Radar" while displaying the new PNG files you
downloaded, GetNexrad will get the usual real-time GIF image so be aware. Be
really aware! If in doubt its a good idea to Creat Overlay with each download
and be sure you have 'Reset' a zoomed overlay before going to far.
13) I have found setting your computer's screen setting resolution will produce
the following sized PNG images:
800x600 >> 510x440 PNG
1024x768 >> 734x608 PNG
1280x1024 >>990x864 PNG
If your computer screen resolution is the 1024x768 or higher that should be
sufficient for a full image. The standard real-time GIF images are only 600x550. Ridge2
real-time PNG images are 1000x1000 but only the inner 500x500 having meaningful
dbz. The larger Ridge2 pixel format is needed for
keeping the same spatial resolution of the longer range N0Q and N0U products.
You can also zoom WCT way in before starting the animation for your area of
interest for oodles of spatial resolution at lower screen resolutions and
smaller output
size. I am not sure how your screen size will affect kmz creation times
since downloading each 5-minute 2 megabyte binary radar file from NCDC for
processing is the bottleneck..
14) If you have setup GetRealtime.exe to automate retrieval and storage of
NEXRAD products, then the historcial data can be sent to the database by Right
Click radar image LOOP, select your basin or point boundary
name and check the Save box. The radar loop will store the looping image values
in the GetAccess database or you can just write the data to the file
"RainLoop.txt".
15) For Level 2 conversion of DBZ to Rainfall
rate, you can adjust the rain rates in the Tab delimited file "Level2RGB.txt".
The current values are the standard NWS Convective rates but limited for hail so as to be
able to tell what DBZ was limited. As of Aug 9, 2012 the rates are now complete
to 76 DBZ (Thanks to David in Alabama!). Also for Level 2 there is info on
it's quirks at the bottom of my
Charlotte web page
that will be helpful if you are rain gage adjusting the radar.
Level II is 0.25 km x 0.5 degree x 0.5 dbz and you would catch hell from ROC for
mistating this! This includes both reflectivity and velocities. N0Q averages the
level 2 into 1km grids and from my comparisons N0Q may be a slightly better
choice for adjusted rainfall due to hitting a gage from 20,000 ft with a 1km vs
0.25km shot.
16) For
older than 30 days historical data, click the "wct.exe" Toolkit menu
"Data", "Find/Order Data" for the free achives at the NCDC. Also, click on the Help menu to get your bearings.
17) And again and as always, radar image UT
Zulu time sent to the GetAccess Database
will be dated in your current PC's time zone, not radar
time, not universal time, not Greenich... your time!... deal with it!
Update, you can now use the 'time_shift' field in GetAccess table 'rsite' as
described on the GetRealtime Help web page if you save your loop values to the
database.
18) The level 3 higher resolution products N0Q and N0U have been archived since
March 2010 at the NCDC.
19) If you use the Toolkit KMZ much you should install GetNexrad in a
seperate folder from your real-time GetNexrad folder to keep all the overlays
and boundaries
straight. You can copy just the needed files below or use the full
download setup to create a new folder anywhere you wish and use that
GetNexrad.exe for working with the Toolkit output KMZ download folders.
Here are the needed files to copy to get started:
1) GetNexrad.exe
2) Level2RGB.txt
3) RadarSites.txt
4) RadarSite
5) MyBlank1000.PNG
And always download KMZ output to a new folder every time.
20) If anyone has a need for Level 2 in realtime and can figure out how to run
the wct Toolkit in batch mode to produce the kmz animation files, I am pretty
sure I could automate the batch mode processing inside GetNexrad and GetRealtime
so please let me know if you really need real-time Level 2. In the mean
time N0Q is pretty
good as it is. Actually my
Charlotte web page
Level2 vs N0Q comparison has N0Q a somewhat better choice for radar adjustments.
The reason for this may be that you have a harder time hitting an 8 inch rain
gage with the super high res 0.16 mile wide Level2 cell than with a 0.6 mile
wide N0Q cell from 10,000 feet.
IMPORTANT!!! Always make sure your radar plots over the cone of silence.
If it does not, delete the file XXX_N0Q_0.kfw in your KMZ radar images and,
reset the zoom, and then reload a current N0Q image.
Tip: If you use GetRealtime.exe to read your KMZ
Toolkit images you have to rename the boundary and point files
K to a Q in your KMZ download folder like this:
NexradBoundaryDIX-10207K.txt >>> NexradBoundaryDIX-10207Q.txt
and
NEXRADPOINTDIX-10207K.TXT >>> NEXRADPOINTDIX-10207Q.TXT
Then GetRealtime.exe can read them and process multi-boundaries much faster than
GetNexrad. And note that GetRealtime.exe doesn't use world files like
DIX_N0Q_0.kfw. So don't worry about that, it just needs the Point file.
Gridded Lat, Long Rainfall Output (and not so gridded)
Update 10/11/2012--If you would like to output
a text file of gridded lat, long points you
can. The trick is to tell GetNexrad that your Boundary file is really a gridded
pixel points with lat,longs as a boundary file. This pseudo boundary file does not have
to be gridded. It can be just your latlong points of interest. (This is not
a point file, the computed point file I wont even mention here and....
let's leave that there.) Here is how to do this for say even an
Historical Level2 Super High Resolution rainfall grid or your selected points of
interest:
Note: To create a tab delimited text file from an Excel range of columns
just copy/paste into Notepad and save with .txt extension. A single title
line at top is also usually needed.
1) Say your lat, long grid is in an Excel file for the Detroit, MI area. Save
your lat/longs as a tab delimited text file with just one title line. DetroitBoundaryGrid.txt (The
'Boundary' in the file name is important)
2) Save this boundary file in c:\Program Files\GetNexrad\LatLongPixelsFromFile.
3) Run LatLongPixelsFromFile.exe and convert this latlong so called
boundary to a pixel boundary file:
NexradBoundaryDTX10XXXQ.txt (where the 'xxx' is not important here unless
you were writing data to the GetAccess database, which we aint)
Now for a step by step instructions for historical KMZ level2 radar images:
Let's assume for the moment that you want to look at the DTX radar in realtime
using the N0Q level3 product. The reason we start here is because as you may
find out there are some world files (.gfw and .pgw) that say what the image
upper left corner lat and long is and what size each pixel is.
So...Hold on to your hat, you may be in for a bumpy ride....
1) GetNexrad.exe is up and shows you the Las Vegas area or your saved image
area.
2) Right click the image, check 'New Site' and then hit 'Update Radar'.
3) Select the Michigan DTX radar from the list and check 'N0Q" and hit 'OK"
4) You should see Michigan and the Detroit DTX Radar. You probably will get a
prompt to create an overlay... so we will do that now.
5) On the right menu hit 'Create Overlay' and from the Overlay Menu hit 'Create
Overlay / Topo'. You should now have a Google Map overlay and a Google Map topo
underlay. That is all there is to realtime.
Now for N0AA's Weather and Climate Toolkit Level2 historical images now that we
have the world files:
1) Assuming you have version WCT 3.5.9. This is very important because they keep
changing the radar image colors. The latest stable version WCT 3.6.x colors
requires a download of the latest color table (see historical radar section
above).
2) Order your Level2 images from:
http://www.ncdc.noaa.gov/nexradinv/index.jsp
Remember to add 4 hours to the May 25 EDT to get Radar UTM times and paste the
job number they give you into Notepad. My Job Number: 002533939
3) Wait for up to 1/2 hour for the order to go through.
4) Start up WTC 3.5.9 and we can convert the radar order into PNG images.
5) With a view of the US showing hit 'Data' from the top menu, then 'Load Data'.
6) From the NCDC Menu
tab, enter you HAS Job Number: 002533939
7) Hit 'List Files' and then select JUST ONE image, check 'Reset Zoom', and hit
'Load'.
8) Close the Radial Properties menu... it just loaded base 0.53... I hope... and
close Data Selector. You should see almost the whole 280 mile radius for level2.
9) Select
the 'HAND' icon so you don't mess things up zooming and panning. Now using the hand and mouse
wheel zoom into Detroit.
10) The
Toolkit map is pretty Spartan so over on the
right hit 'Launch KMZ' and you will see
where your zoomed area is on Google Earth. After looking at where it is, close
Google Earth and discard the Google Earth temporary places.
11) Rezoom
as needed and now we are ready to Export the whole list of radar images to your
computer. Again hit 'Data' from the top menu, the 'Load Data' and select the
whole list to download. Uncheck 'Reset Zoom', and hit 'Animate'.
12) Select 'Export to KMZ' and hit 'Start'. From
the KMZ Export menu select 'Drape over surface terrain' and for Output select
where the export .kmz file
will go on your computer and hit 'Go'.
13) Some hours later...
;-) when it is finished, close the WCT Toolkit and locate where
your downloaded export file is with Windows Explorer and rename the file
extension from .kmz to .zip. Extract all to file and we are ready to go with
GetNexrad.exe again.
14) This next step is important because it will
create a world file specific to
these KMZ downloaded images. Start up GetNexrad.exe and hit 'Select Radar File
Image' and find your unzipped folder and select one of the radar png files.
You'll get a message about an overlay which you can do using the first step 5
above. You should see your image zoomed into Detroit on a Google Map. You can
check the transparency on the Create Overlay menu to see through the radar if
you like. After admiring your handy work, close GetNexrad, and we will tackle
converting a Lat/Long 'Boundary' file to a pixel file.
15) Start up LatLongPixelsFromFile.exe and from the top menu hit 'File' then
'Open Input File' and if you have included the word 'boundary' in your lat/long
filename you can select it from the list. Example:
DetroitBoundaryGrid.txt
16) Now select 'Convert' and 'LatLong to Pixel' and the Radar and Site Info
input window will open. Change Radar Code to DTX and N0Q to KMZ and leave
everything else as is. You will not be writing your data to the GetAccess
database so you will not bother with the Datatype_Site_ID and hit 'OK'.
17) For
KMZ conversion you are prompted to 'Locate your Toolkit PNG radar image' from
the unzipped KMZ folder, select one, and you should be 'Successfully Converted'.
Why select an image???.. To find the folder with world file we created earlier
from the kml file info.
18) Selet 'View' from the top menu and 'Boundry Picture' and you will see your
'boundary' pixels displayed.
19) Exit and save your pixel boundary to the default name it gives you and copy
this file to the KMZ unzipped radar image folder. This boundary is only good for
this KMZ download and not for other KMZ or realtime N0Q images. You
could try using the standard N0Q boundary but it can be missing many of the
finer grid points when zoomed.
20) Start up GetNexrad.exe, 'Select Radar File Image', and select one of your
KMZ images you unzipped. Because you now have a 'Boundary' file in this folder
it will be displayed as 10xxxK.txt where K means your KMZ kml file info was used
oK. Double click your Boundary 10xxxK.... and you will get the
error message 'File not found.... point file'. Click ok.
21) ..... We are getting there.... Select 'Create Point File',
then 'Create File', and you will see
your psuedo 'Boundary' displayed and a message... hit 'OK'.
22) Hit 'Select Radar File Image',
select one of your radar png images, double click your 10xxxK Boundary, and
viola... thar she blows!!!
Zoomed Level 2 radar in all it's magnificent glory with radar cells
0.16 miles by 0.5 degrees. Another tip of the hat to those sleepy ol'
goats at Nexrad headquarters and the Weather Toolkit Guy!!!
To output a loop for your grid points select 'Save' while looping and select
'Grid (boundary) text file' and each grid point's output will be saved to
the text file. One caveat is that until you Save the loop as a "Grid", it
will be using the Point file for averageing 'basin' rainfall, then after a save
it will be using the "Grid" points as the 'basin' average.
If you Save to
grid a 'real' boundary then you screwed up and you will have to re-select your
radar images for the proper points inside your 'real' boundary.
It is up to you do describe your latlong input boundary points. Either
oddly spaced points of interest or an evenly spaced grid knowing you radar pixel
resolution. The above example was close, but clicking on GetNexrad's 'Lat
Long' option for values to center the max and min latlong values and then using
Excel to compute a grid would have been closer. But all said and done, you
will get your latlong, dbz, rain rate, rainfall increment, and running total
rainfall how ever you come up with your so called 'boundary' grid.
Update 2/20/2013--If you want to get the lat/long for each
Level2 radar bin in an area, try this
Excel sheet.
And for added satisfaction, remember to use LatLongPixelFromFile.exe to save you
'boundary' as a KML file. Then click on it with Windows Explorer and
viola! Its on Google Earth!
At this point some may be wondering why would anyone even want a gridded text
output. Well, I did too until it was explained how this grid can
be contoured or surfaced for display or used as a matrix of
rain gage points. Ms Excel's graphing has a
peculiar surface/contour graph setup where you will have to extract all
longitudes for row 1 and then each latitude with associated values on the next
rows. Here is how to create surface and contour charts of your Grid
(boundary) text file output in Excel.
How to do Excel Surface Charts:
http://pubs.logicalexpressions.com/pub0009/lpmarticle.asp?id=447
(I gave up after about an hour and I really wanted to see something.)
Update 2/28/2013--The WCT.KML file is important but I dont know
much about Google Earth but a satisfied user (John McMurray of TV/Consulting
fame that created all this) says...
"As soon as you made mention of the wct.kml file I knew that was the problem...
In my repeated attempts, I kept looking at that google earth view with the
"slider" visible and I just had the feeling something was not correct. I didn't
know what was wrong, but when you pointed this as something to check, I deleted
everything in the My Place folder. In essence, I started with a clean slate with
a new HAS bundle. In fact I lengthened the time period of images, and started
again with the 105 tab delimited points covering the flood area and also a
(Lat/Long) location of a rain gage. When I "launched KMZ", it was over a clean
slate, and it worked perfectly. (( This maybe worth a sentence or two in your
HELP file. ))"... well there you go.
Big tip of the hat
to John McMurray at
http://cwsweather.com/index.html
,the TV weatherman and weather consultant, in developing these gridded outputs.
Here is John's own visual collage example of output from GetNexrad to Excel and
then displayed by Golden Software's Surfer grid and contouring software (I would
not want this guy to show up in court with just your rain gage defense):
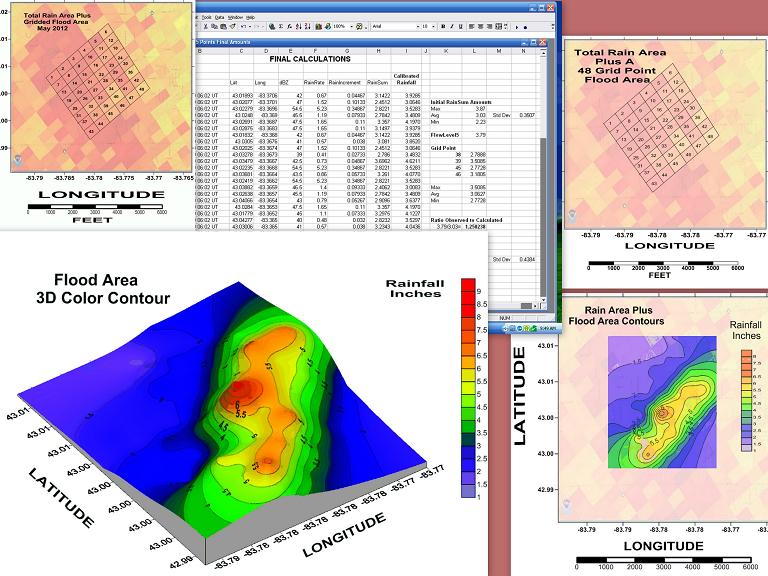
Yeah!, I thought that would grab ya!
Customer Spotlight>>>>
John's work is featured in the July 2013 Customer Spotlight of Golden Software's
Newsletter Issue 71:
http://www.goldensoftware.com/newsletter/issue71-customer-spotlight-john-mcmurray#
You may want to contact John for more in depth info on rainfall contour plotting
and just how he gridded Level2 radar each 5 minutes. He even adjusted the
rainfall based on nearby rain gages.
As noted above, I found that you can digitize a lat/long points directly
in Google Earth also. To do this click 'Add', 'Path' and give it a name
but do not close this name box until you have finished. Click away and then
close the box. Now on the 'View', 'Sidebar', 'My Places' you should see your
boundary name. Right click on it and 'Save As' a KML file. Open the saved KML
file with Notepad and cut and paste the lat/longs into Excel and away you go.
So adding the WTC zoomed radar image first into Google Earth may be another way
to locate radar cell locations.
********************************** ************************
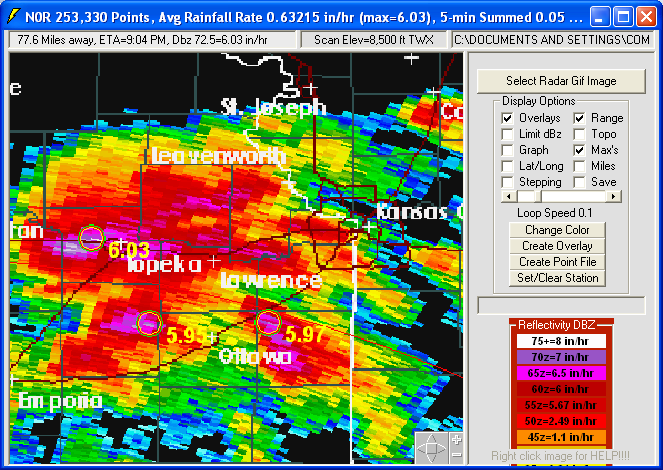
Ridge 2 versus Ridge 1 Real-time radar images (Level 3 Products):
The NWS has started a test bed for their new higher resolution Level 3 image
products as descibed here.
GetNexrad now supports this Beta test bed source, although the test bed is not
always as responsive as desired. Update 11/04/2011--Reading the 7.2
megabyte Ridge2 directory was the problem and has been fixed. The new Ridge2 images are 1000x1000
pixels versus the old reliable Ridge1 600x550 pixels. GetRealtime
has also been updated to use the Ridge2 Testbed as an option available for testing.
During the 2012 Daytona speed week, the MLB radar had all kinds of missing
N0R radars gifs as a rainstorm approched after practice 4. The N0Q test bed was
flawless... so now N0Q is ol' reliable.
Old Reliable Ridge 1
N0R Image 600x550 pixels 1 degree x 0.6 miles x 5 dbz:
Ai Yi Yi!!! You mean they went to all this trouble and image size
overhead just to produce the same 14 color donkey kong image???? What the
hell!?!? Why not add blinking!
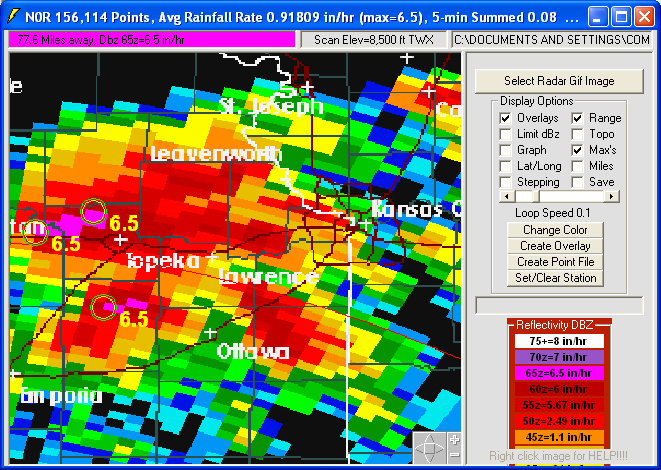
Not so fast there amigo... The Ridge 2 Test Bed has two new products that are of
super duper Level 2 dBZ and velocity resolution, N0Q base reflectivity and N0U
base velolocity. Yes that's right, Level 2 values in dBZresolution... so read
on.
New Ridge 2 Image N0Q 1000x1000 pixels 1 degree x 0.6 miles x 0.5 dbz:
Not bad at all for those sleepy ol' goats at headquarters!!!
I will
check out the differences in rainfall between the two
and see what this new larger size image bottle neck has to offer. I'm not
sure why the spatial upgrade and then use the same 14 color range... they have a
every color in Level 2 high resolution to use. What am I missing?
Smell the coffee... The fabulous N0Q product is the best choice now with
0.5 dbz resolution.
Be careful when just pressing the 'Update' button to get
just the latest radar image from the Ridge2 testbed. It may be
over an hour old. If you want the latest, get a loop. And don't complain,
this Ridge2 migration is being done by volunteers who already have a real day
job. The great Iowa State Mesonet N0Q option source works like a swiss
clock!
As of Feb 27, 2013 only N0Q and N0U images are being updated on
the Ridge2 Testbed. Not sure if this is temporary or not. The NWS
testbed can be offline for several days and appears to be an orphaned step-child
but the Iowas Mesonet keeps right on ticking.
As shown on the image above, click on the DBZ caption area to
display these options for converting dbz to rainfall rates:
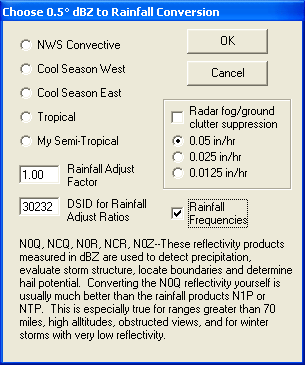
The dbz to rainfall rates are in the tab delimited file
"Level2RGB.txt".
You can adjust these rates by editing this file but do not edit the color codes.
For instance My Semi-Tropical rates are the average of the Convective and the
Tropical rates. The included Level2RGBknotts.txt is needed for Ridge2 N0U
higher resolution velocities.
Update 6/21/2013: Iowa Mesonet's N0Q
composite
cutting service has been added for US mosaic 1700x800 pixel and the
10 regional 840x800 pixel mosaics as N0Q Also each radar site can be cut
as 'NCQ' 500x450 pixel out to only 150 miles which
provides faster loops than
N0Q. The drawback to using these composite N0Q's is the highest dBz from
nearby radars can be used which causes much higher rainfall. Also, the
higher elevations lets the wind blow it farther when gage ratioing. 'NCQ' is not a NWS product code. It's my code
for 'C'ut or 'C'omposite N0Q = NCQ. If your regular N0Q
site goes down then the NCQ may be an option to use your N0Q boundaries with but
be sure you have a radar adjustment scheme in place. MRMS Multi Radar
Multi Sensor products from NSSL A2M and HRRR are processed just like Nexrad-NCQ
images using the same subbasin and gage boundary and point files so use product
code NCQ and Ridge2 with LatLongPixels.exe.
Also you can cut any location by editing the
Tab seperated file
RadarSites.txt and add your lat/long site ZZx as shown below where beyond
the elevation, add radius in miles and image width in pixels:
WV RLX Charleston 38.311 -81.723 1211
WY CYS Cheyenne 41.152 -104.806 6191
WY RIW Riverton 43.066 -108.477 5630
WY ZZ1 MyLatLongBox1 43.066 -108.477 10 250 800
TX ZZ2 MyLatLongBox2 31.371 -100.492 10 300 500
Elevation is just a place holder and not used.
For loop speed keep width in pixels less than 800.
Update 11/09/2011...Added a sound alarm when there
are Warnings for the radar site. I put a siren on the sound card and a
beep on the PC speaker in case the card
is off. To
turn off warnings, uncheck 'Overlays' or uncheck 'Show Current Warnings' on the
'Create Overlay' options.
And while we are on the topic of tornados, the new higher dBz resolution test
bed N0Q product clearly showed the hook echos and debri balls shown on the live
TV Weather Channel analysis for the OK and AR tornados of Nov 7-8, but the warnings on the radar periphery
are of too low spatial resolution to see. The N0Q images will show
warnings out to 280 miles as compared to the N0R range of 144 miles.
Update 12/12/2011 Webscreen sidebar:
You can now edit the file 'GetWebSiteList.txt' using Notepad and add your Gages
or Web pages of interest as shown here (no title):
0--KCAALTA3
1--KCAALTA3
2--KCAALTA3
Click Forecast
Click Quick Forecast
http://radar.weather.gov/ridge/lite/N0R/AMX_loop.gif
etc. etc. etc.....
The 0,1,2 are types of Wunderground displays. You can choose which member
of the list to use on the 'Create Overlay' menu screen and then press 'Exit'.
The 'Click Forecast' will get the NWS forecast for the location you mouse click
on. You can add as many other websites as you like.
Also new for users with W-I-D-E screens like laptops, on the 'Create Overlay'
menu you can set the radar view port aspect ratio. Try
setting the ratio to 1, then check the box and the screen will resize, and now
zoom. Or drag the menu frame to make the picture square, then press the center of the small icon, and zoom in.
I gave this aspect ratio = 1 my best shot but it is still elusive. Just
try try to make the radar range circles look round... or ignore the whole thing
because it matters none. You could unmaximise the GetNexrad window and
resize as desired.
This also allows tinkering for more room for the sidebar web screens for even
normal sized screens. Remember even at 1:1 aspect, Lat:Long will not be
but this can really help at northern latitudes (not needed for horse
latitudes).
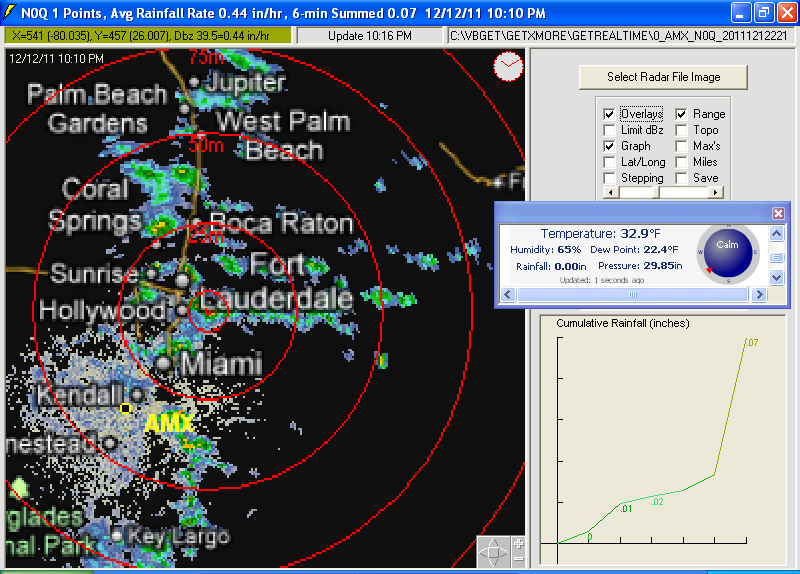
10-Minute Surface Observations with GetNexrad 3.4.0:
The 10-minute realtime surface observations Temp, Dew Point, Gusts, Pressure,
Precip, and Wind Barb data are supplied by NOAA's Warning Decision Support System --
Integrated Information on their website here:
http://www.wdssii.org
Update Oct 10, 2017: The WDSSII no longer provides the 2000
weather obs stations so I have created a list (METARlatlong.txt) of 127 airports
to download the METARs instead. Not as nice but all I can find for now.
GetNexrad will display the approximately 2000 weather stations available or you
can limit them. This data delivery system is still experimental and this
being a research system is not guaranteed to be available 24/7. Not being
a weather man myself, I am not too sure what to make of this
information... except the Temp... but if you do then here you go. I think
it is what you had go by before radar... Model T stuff. Although it
would be interesting to watch with a hurricane approaching... I hope I scaled
the wind barbs ok for that scenario. The wind barbs point in the direction
from which the wind is blowing toward the center circle station
location and the barb length is proportional to the average wind speed, not
gusts. Just bass ackwards of how a windsock works... but again I'm no
weather man. In fact this is making my head hurt just looking at it... so
to go with the flow I will add a windsock option for us non-weatherized people.
The surface frontal analysis data is supplied by NOAA's Hydrometeorological
Prediction Center every 3 hours. The H, L, and Fronts are color coded as blue H = high
pressure center, red L = low pressure center, red lines =warm fronts, blue
lines = cold fronts, magenta lines = stationary and occluted fronts, and brown
lines = trofs (extended low pressure and outflows). I looked it up here:
http://www.hpc.ncep.noaa.gov/html/fntcodes2.shtml
The blue H is good, the red L is bad. Winds go clockwise around highs, and
counter clockwise around lows. That's about all I know and I wonder why
that is. Like toilets below the equator probably. And why hurricanes
cannot cross the equator.... ok, that's just my hunch.
I have only just started viewing these surface obs but it seems so far that
Gusts and Precip are not reported if zero and I do not plot zero WindBarbs, and
that's ok. But it's quite a hodge podge of available data otherwise I
think. I would expect a value for each parameter at each location every
10-minutes. They should experiment fixing this before it rains. The
image below was my utopian thinking before I figured out what going on so don't
expect all the data to show up as this displays, 4 values and a wind barb.
In fact do not ever expect it. Who's in charge here? Aside from
this, the surface data will get to be mesmerizing. Who cares about the
radar! Now you too can be a weather expert like me with the
online crash course
in meteorology by simply viewing these learning modules from the University
of Illinois.
GetNexrad 3.4.1 can now animate the surface obs to go along with the
radar. But because only the current 10-minute values are available for
download, you will need to have a 30-minute loop going for up to 30 minutes to
fill each of the three 10-minute data slots. You can change to other loops
and the surface obs will continue to be filled without having to start over.
Utopoia:
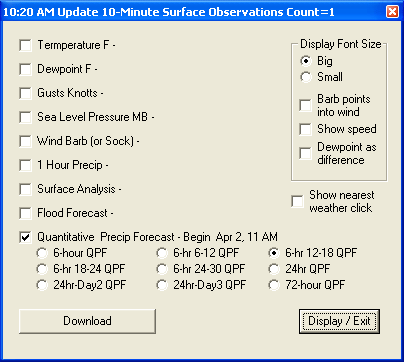
Also the Days 1-3 Quantitative Precipitation Forecast QPF contours have
been added to the surface observation overlays. The QPF product time
period is described
here. The
GetNexrad surface obs download form will display the QPF
beginning time as your local time. I think the Day 1 starting period will
change from 00Z to 12Z with updates so two periods for Day 1's are possible each
day... I think. GetNexrad will not check for QPF updates during your loop
updates because my head is spinning now. Day1A and Day1B comes to mind.
Who's in charge here?
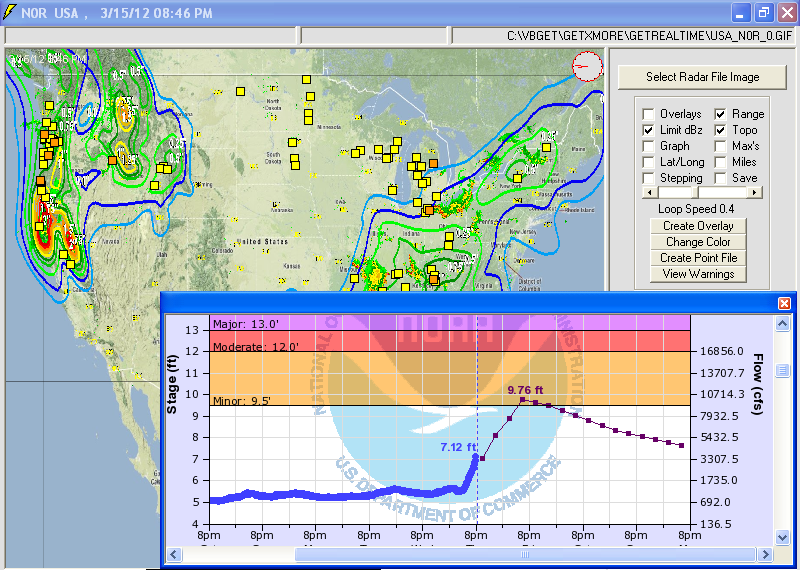
The Advanced Hydrologic Prediction Service (AHPS)
flood forecast points above normal
have now been added to the surface observation overlays. Downloading
the AHPS data requires the cURL tool that comes with Windows. When the overlay
point is clicked, the side bar web window will display a hydrograph with the magnitude and
uncertainty of occurrence of the flood, from hours to days and months, in
advance. Although it may seem over kill, the flood forecasts are updated
every 15 minutes and if in a radar loop GetNexrad will check every 10 minutes
with the other surface obs or 15 minutes if not. The forecast points are
color coded for the peak of the forecast flood as yellow will peak above normal
stage, orange is minor flooding, red is moderate, and purple is major flooding.
In addition to the hydrograph, the side bar web window will display some great
info about the flood forecast point. This is some of the best stuff NWS
has to offer I think... besides the radar... and the tempertures... and wind
barbs.... etc. They should all get raises. But remember that the NWS
can't watch every small basin so use GetRealtime
and keep your eye on the radar to keep yourself minutes ahead of even the NWS small basin
floods and other warnings.
QPF Precip Contours and Flood Forecast Points:
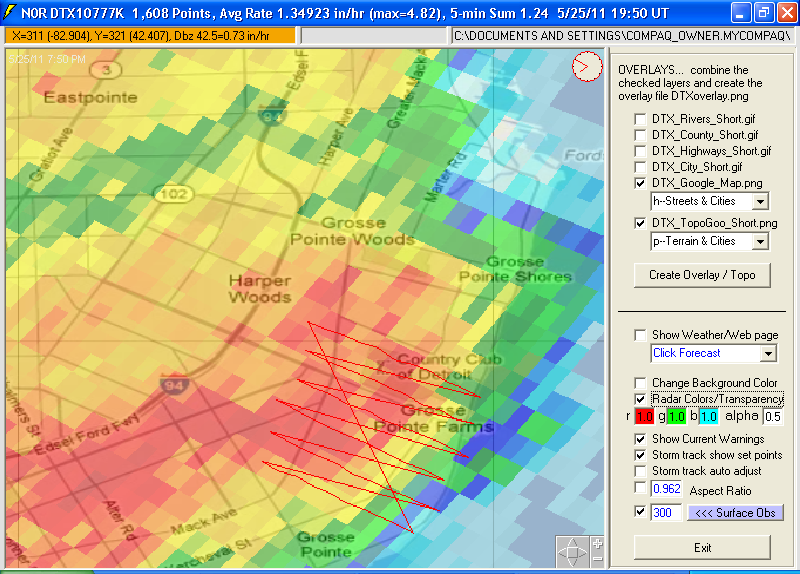
Graphical Storm Tracking Example:
Start a radar loop going for 0.5 hours duration with
no boundary selected and
while looping....
(If you have a boundary selected like a race track and not the radar then skip
step #1)
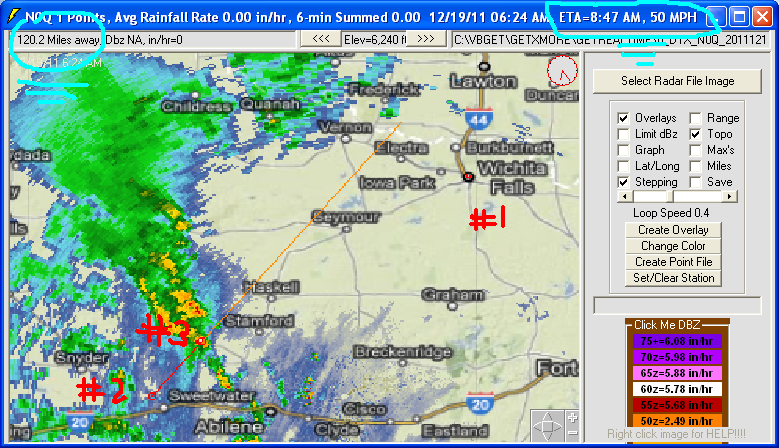
#1 Click your point of interest, in this case the city Wichita Falls.
Now click 'Stepping' or the top center box Steps... and step back to beginning
of loop.
#2 Click on storm cell of interest (usually leading edge or tornado eye).
Now step forward to the end of the loop.
#3 Click on new location of
the storm cell of interest.
Displayed in the upper left text box will be the distance away, ETA, and speed
of travel. Uncheck 'Stepping' to let the loop continue. The projected orange line shows the distance to Witchita and
the ETA is for the end of this projected line.... or Witchita if the storm takes
a swing to the east.
You can repeat steps #2 and #3 if not satisfied. Double click
the image to clear all 3 points. And with a little practice you could
probably skip going into stepping mode. And some may prefer to
reverse steps #2 and #3. Click on the cell at the end of the
loop, then setp backwards and set the other cell point. This may help when
the rain front is less defined.
Tracking options on the 'Create Overlay' button allows for
turning off showing the tracking set points for better viewing and also allows
GetNexrad to automatically adjust the ending tracking point when the ending
track point is not the original set point #2 dbz reflectivity. This option
will look forward along the tracking line to find any dbz value greater than or
equal to the original #2 set point dbz within the tracking circle (5 pixel
radius). If nothing is found looking forwad it will look backwards to find
a greater than or equal dbz value. I am not sure yet if this option makes
for a better tracking ETA so you be the judge. It's like watching paint
dry but I think it's a nifty refinement as the storm nears ground zero.
And you would not want to use this adjust option when tracking the trailing edge
of the storm because you would soon find you would be tracking the leading side
of the storm. Also try tracking the non-radar color in just in front of the
leading edge and this adjustment will keep the leading edge what ever
reflectivity. Lots of quirks, so as in life, you need to be
experienced. Or you can always just reset your tracking points
manually as needed.
Use tracking with 'Storm track forecasting' to provide
up to 1 to 3 hours lead time based on storm type and tracking
speed. Your basin or point of interest is offset to tracking point #1 for
nowcast rainfall computation where distance and storm speed will compute the
nowcast time at the real basin location. Write the nowcast unit values to
GetAccess for real-time rainfall runoff and GetRealtime will overwrite as true
radar basin rainfall comes in. Not having much experience with this yet I
assume one would have maybe a 2-hour radar loop going, set the 2 tracking points
and then check 'Storm track forecasting' and 'Save' the values to the GetAccess
database and run GetRealtime (w/radar adjust?) and runoff. Then reset your
tracking points every 15 minutes or so and repeat. Stratiforms may use
multiple nowcasts on the same loop and convective would pick up and move with
the approaching storm. You be the pioneer here. Update 5/9/2014--mulitple
DISD's can be entered to update values from the single nowcast basin for
sub-divided basins to make life easier.
And for overkill, add the NWS 6 hour to 72 hour Quantitative
Precipatation Forecasts. Just use the Surface Obs' QPF option to
set the start and duration and eyeball your basin's QPF precip and away you go.
The QPF future precip will be reduced for actual realtime radar values as they
come in and nowcast values. Your GetAccess database values will be 'source'
coded as 13 for real radar values from GetNexrad, 14 for tracking nowcast
values, and 15 for QPF values.
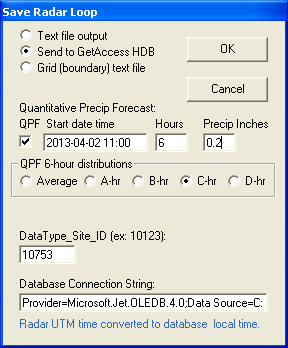
And if you would like to distribute the QPF values instead of just using the
average 5-minute values you can use the 6-hour distribution file
GetNexrad_6hour_Dist.txt.
I have put in 4 distributions that you can adjust as you like but each should total 1.00 inch.
GetMapArea is also good for comming up with these 5-minute distributions but I
would stick to reality.
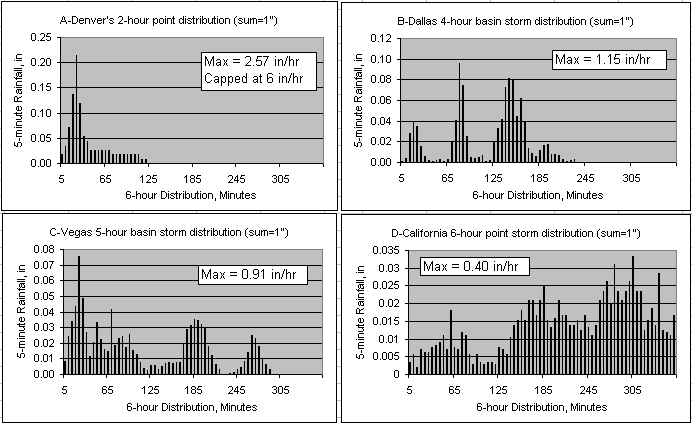
The above 2-hour distribution was taken from Denver, CO's
Drainage Manual (noaa atlas) and adjusted to 1 inch.
The others are actual storms. The 5-minute QPF values are capped at 0.5"
or 6 in/hr. You should create distributions for storm types for your basin
of interest. To refine QPF start times or eyeballed rain value
and which distribution to use, at the bottom of the NWS 7-day forecast is a link
for "Hourly Weather Graph". It will show the 6-hr QPF's and what hours Thunder, Rain, Snow, etc.
are expected to occur in.
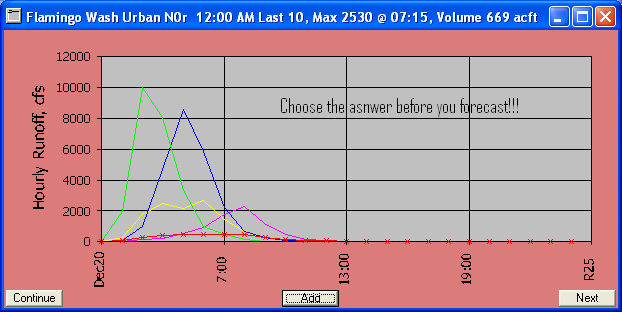
And yes, it does help to know the answer
(avg, A, B, C, or D) before you start as a 1" QPF shows here
(the correct answer was 3,000 cfs for a 6-hour 1" southwest summer monsoon):
And for the eternal optimist Mr. Hal F. Glassfull (the boss), you can track the
trailing storm edge to get the ETA of sunny skies (and when you can expect to
get the crew working again).
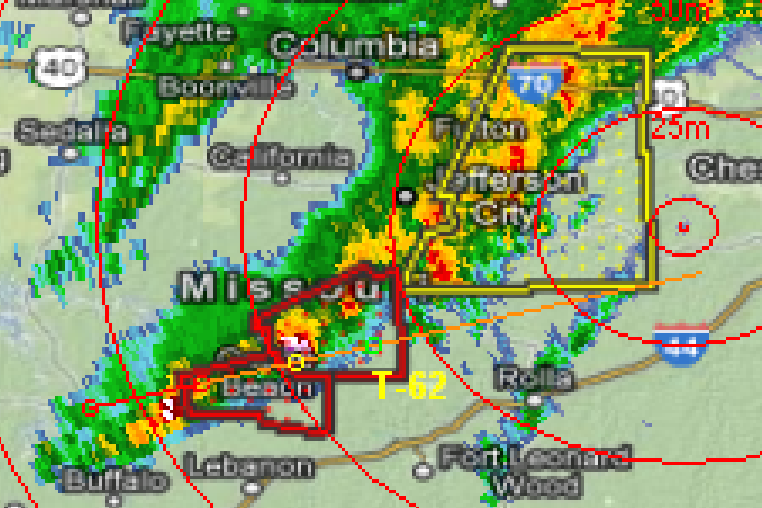
Storm tracking update... follows the set points and shows
actual real-time track location:
I have added some audio 'WAV' files on the full download that
you can have some fun with creating your own wav's using Windows Accessories-Entertainment-Sound
Recorder and
replacing these using the same file names. If you do not want to hear them
played it is ok to delete them... T minus 2 engage systems lift off!!!...
Example of QPF Forecasts and Radar Tracking Nowcasts:
Calibrated 39.3 sqmi urban basin, Birmingham, AL. All times are
Pacific Time and will be automatically adjusted from Zulu to your computer time.
These 6-Hour QPF's showed rainfall and so
5-minute values were entered using GetNexrad as:
(Leadtime is 24 hours)
12/09 10PM-4AM PT 0.1"
12/10 4AM-10AM PT 0.5"
12/10 10AM-4PM PT 0.1"
Total-------------0.7"
Actual radar-----0.66"
Not bad so far.
Peak QPF forecast runoff 6-hour:
w/o 6-hr rain distributio>> 120 cfs
w/6-hr rain distribution>>> 230 cfs
Actual USGS peak runoff>>>>1160 cfs
Not so good.
Gage/radar ratio at basin was later shown to be 2.0. with basin
adjusted rainfall of 1.25". Will this always be the case?? If so, then 2.0*QPF's
will work pretty well.
Storm track Nowcasts: The above 3 basin QPF's were NOT
left in the record but should be and then overwritten. The following basin
Nowcasts on the N0Q radar were made with no adjustments. And because the storm
front was moving at 50 mph, to test a longer Nowcast lead time the first Nowcast
was made on the upwind radar DGX Jackson, MS. The Birmingham radar BMX was used
after that. If your boundary files are in lat/long then LatLongFromFile.exe will
easily produce boundaries for other radars.
Rainfall Wundergage near Basin center was 1.50"
Forecast Radar DGX start @ 8:40pm forecasted time at basin 1:30
am
Time diff 4hrs 50 minutes
Track speed 50mph 0 hour
forecast at 08:40PM PT time rain= 0.00"
1 hour forecast at 09:40PM PT time rain= 0.73" Peak 553cfs @
05:00AM
2 hour forecast at 10:40PM PT time rain= 0.84" Peak 760cfs @
05:00AM
3 hour forecast at 11:40PM PT time rain= 0.96" Peak 904cfs @
05:00AM
4 hour forecast at 12:40AM PT time rain= 1.11" Peak 989cfs @
07:00AM
5 hour forecast at 01:40AM PT time rain= 1.27" Peak 1330cfs @
08:00AM
---rainfall begins at gage at 2:30am ---
6 hour forecast at 02:40AM PT time rain= 1.37" Peak 1338cfs @
08:00AM
USGS actual peak flow 1160cfs @ 09:00AM
Forecast Radar BMX start @ 1:05AM forecasted time at basin
2:45AM am
Time diff 1hrs 40 minutes
Track speed 52 mph
0 hour forecast at 01:05AM PT time rain= 0.00"
1 hour forecast at 02:05PM PT time rain= 0.30" Peak 168cfs @
04:00AM
---rainfall begins at gage at 2:30am ---
2 hour forecast at 03:05PM PT time rain= 0.50" Peak 229cfs @
04:00AM
3 hour forecast at 04:05PM PT time rain= 0.56" Peak 233cfs @
04:00AM
4 hour forecast at 05:05PM PT time rain= 0.74" Peak 233cfs @
05:00AM
5 hour forecast at 06:05PM PT time rain= 0.90" Peak 274cfs @
05:00AM
6 hour forecast at 07:05PM PT time rain= 1.20" Peak 909cfs @
9:00AM
7 hour forecast at 08:05PM PT time rain= 1.40" Peak 1360cfs @
9:00AM
USGS actual peak flow 1160cfs @ 09:00AM
Actual BMX Radar
0 hour forecast at 02:30AM PT time rain= 0.00"
1 hour forecast at 03:30PM PT time rain= 0.16" Peak 86cfs @
06:00AM
2 hour forecast at 04:30PM PT time rain= 0.23" Peak 107cfs @
06:00AM
3 hour forecast at 05:30PM PT time rain= 0.28" Peak 111cfs @
06:00AM
4 hour forecast at 06:30PM PT time rain= 0.40" Peak 111cfs @
06:00AM
5 hour forecast at 07:30PM PT time rain= 0.55" Peak 133cfs @
09:00AM
6 hour forecast at 08:30PM PT time rain= 0.62" Peak 143cfs @
09:00AM
7 hour forecast at 09:30PM PT time rain= 0.64" Peak 143cfs @
09:00AM
USGS actual peak flow 1160cfs @ 09:00AM
Hourly Gage/Radar ratio adjusted BMX Radar
0 hour forecast at 02:30AM PT time rain= 0.00"
7 hour forecast at 09:30PM PT time rain= 1.25" Peak 769cfs @
10:00AM
USGS actual peak flow 1160cfs @ 09:00AM
So what gives? The first Nowcast totaled 1.37", 2nd Nowcast
1.40", and the actual comes in at 0.64"??? Why? Storm dissapation? Nowcasting
does not work? No, in fact this is no new quirk of our quarry but our old arch
enemy... partial beam blockage. If you watch 3 to 4 hours of BMX radar at high
speed you will notice a color change radiating out from the radar over
Birmingham and that the far edge of radar detection is much closer to the radar
inside this radial. So check your radar at your basin location and adjust or
subdivide. EVERYTHING about radar requires adjustment and flexibility... this
aint your dad's science.
I was attempting to do this in realtime but gave up at 2:00AM
so these are reconstructed values. Normally the QPF's would be overwritten by
many Nowcasts which would be overwritten as actuall basin radar comes in.
GetNexrad knows which is which... which is more than I can say for me after just
trying to reconstruct these track times. Seemed pretty simple in realtime.
Besides the 5-six hour QPF periods in xml displayed by
GetNexrad, the NWS also provides a breakout of each 6hr period out to 78 hours
here:
http://www.cnrfc.noaa.gov/hpcqpf.php?duration=00&fill=no
Simple Tracking demo on Youtube video:
Update 9/12/2012: If you want to change the colors of the
radar now you can. The 4 cells on the Create Overlay menu allow values
between -2 to +2 to change the radar's image RGB colors and alpha is
transparency 0 to 1. Try just a -0.5 Green to start. Transparency helped view Hurricane Issac's relation to to
the shore line... changing it's colors will help your inner demons I guess. ;)
Update 4/14/2013: Storm chasers can use
the 'Lat/Long' check box to set your mobile location using an HTML5 geolocation
function with your web browser (Chrome, IE9+). For mobile users this can
be quite accurate to within 20 meters, wifi within 200 meters, much less than a radar
pixel of 1 kilometer. Windows XP will require Google Chrome since IE9 is
not compatible with XP. You can look at my web page source to see how
simple this miracle is and note that your location is not stored by me at
least... not sure about the helicopter people:
http://getmyrealtime.com/Getlocal.htm
Update 12/9/2013: If your radar site has boundaries to
display on the Boundary List, then you could see 3 new boundary
list items at the bottom to select from the list
of your sites or 'RadarSite':
'Add another site from above'--will display
additional boundaries on your radar screen.
'Show current list values (-1*dsid)'--will
take each DSID (datatype_site_id) from the list and look up it's negative value
and sum yesterday through now rhour table values (ie -10400 Elk City Wundergage Radar, will
look up the hourly values for +10400.). The 2-day sum will be displayed on
the radar screen. Update 2/8/2015: For actual boundaries, the past 2 rday values are
retrieved in this dsid order; -11xxx, 11xxx, and finally -10xxx which is
the raw radar for the boundary. This means 'Show current list values'
expects rain gage vaues to be datatype_id 10, raw radar to be -10, and adjusted
radar to be -11 or +11. GetNexrad will then display the gaged values at
the gages and adjusted radar for the subbasins through now.
'Show GetNexrad_xxx_Gages.txt list'--will look
up and sum yesterday and today's 'rday' table values and display them.
Replace the 'xxx' with your radar site code. Any DSID will work, not just
rainfall. If the datatype is NOT 10 or 11 (rainfall) then the yesterday
and todays's max value
in the 'rdaymax' table will be displayed. Multiple list files can be used like GetNexrad_BMX_Gages.txt,
GetNexrad_BMX_GagesAlex.txt, GetNexrad_BMX_GagesElev.txt,
GetNexrad_BMX_GagesBob.txt ...etc.
The file GetNexradHDB.txt is needed in the GetNexrad folder but
may already exist and has the connection string:
Provider=Microsoft.Jet.OLEDB.4.0;Data
Source=C:\Program Files (x86)\GetRealtime\GetAccess\GetAccessHDB.mdb;User
Id=admin;Password= ;
For metric units include a last line as: Metric=True
Update 2/20/2022: Metric can also be selected by clicking
the DBZ legend and checking 'Metric' box for Canada radars mm/hr.
GetNexrad_DAX_Gages.txt Example (goes in GetNexrad folder; or
use 'Edit Gage Display List'):
DSID, Long, Lat, Optional Color, Opt Plot, Opt
ShortID, Opt Display OFF, Opt Display Boundary ON, Opt Frequency ON, Site
10426, -120.101, 37.800, &HFFFF00, plot, Buck1, Buck Meadows Wundergage
10425, -120.132, 37.741, , plot, Coult, OFF, ON, COULTERVILLE, CA
**10428, -120.127, 37.845, Groveland CA
10429, -120.214, 37.859, &HFFFF, , Pine, Pine Mtn Lake, CA
**or along borders using Top, Bottom, Left, Right
10426, L,1, &HFFFF00, plot, Buck1, Buck Meadows Wundergage
10425, R,1, , plot, Coult, OFF, ON, COULTERVILLE, CA
END
A '*' means skip this station.
A ShortID is 6 letters or less and replaces display of
the DSID for us memory challenged.
A 'plot' will graph yesterday and todays hourly values and
display the dsid and max hourly value.
'OFF' for Display will turn off display of site value but will
show plot.
'ON' for Display Boundary will draw the basin boundary.
'ON' for Fequency plot if plot on. Either
rainfall or flow frequency table.
Some optional color codes:
Red= &HFF
Green= &HFF00
Yellow= &HFFFF
Blue= &HFF0000
Magenta= &HFF00FF
Cyan= &HFFFF00
White= &HFFFFFF
Orange= &H0099FF
Missing data for rainfall and radar is 40 minutes old and others are 240
minutes old and the displayed values will be orange but plots remain the same
color.
If you want to align your PLOT's along the
edge of the radar disply, then just exagerate either the latitude or longitude
(not both) in the setup. If your lat is 33 then use 23 for bottom align,
if long is -88, then us -98 for left align. The PLOTs can be aligned at
the top, bottom, left, or right by exagerating either lat or long.
Easier yet is use "T" for plot top align or "L" for
left align like this:
-9301, T, 1, &HFF, plot, Sub1, off, off, off, Sub 1
-9302, T, 2, &HFF, plot, Sub2, off, off, off, Sub 2
-9303, T, 3, &HFF, plot, Sub3, off, off, off, Sub 3
For congested data plots check 'Gage Display as List' to
toggle list
station data to the screen right and to toggle plot transparency.
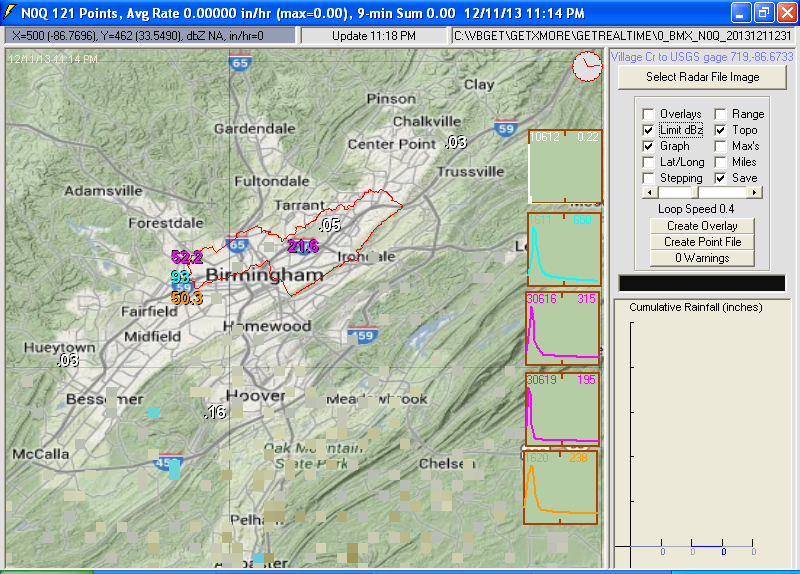
Stream lines can be added to show flow route by creating a
boundary file without a point file. You can do this using GetMapArea.exe by
loading 'EPA WATERS KMZ' and using a lat/long scale, 'Start Stream Line' and
'End Stream Line' repeatedly for each stream branch and then save when finished.
This creates a lat,long file with text between line segments. You can create
this lat,long file however you like with a blank line or text between segments.
Then using LatLongPixelsFromFile.exe load and convert 'LatLong to Lines'. You
must use a Datatype_Site_ID less than 999 to differentiate these stream lines
from a real boundary.
Stream lines:
1) must use dsid<999
2) GetMapArea multiple streamline segment file by using begin
stream line and end stream line multiple times then right click textbox and
save.
3) Load EPA WATERS KMZ for the streamlines to digitize in
Lat/Long.
4) Other source lat/long sources use blank line between stream
segments.
5) Use LatLongPixelsFrom File.exe, Convert, LatLong to Lines
and save as boundary file.
6) Do not create a point file and copy boundary file to
GetNexrad radar image folder.
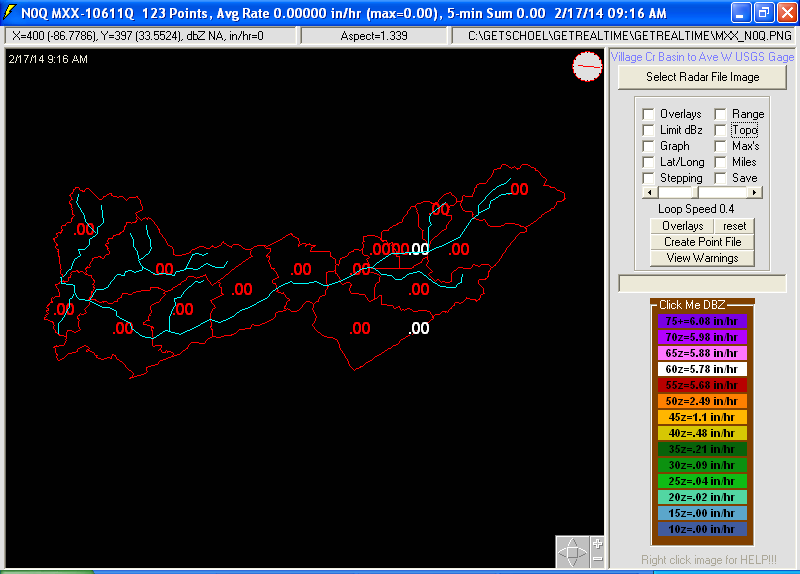
To display with the Show Gage List file
GetNexrad_XXX_Gages.txt:
1, -86.992, 33.443, &HFF00, , Stream, off, on, My
streamlines
GetNexrad can now lookup the rainfall frequencies for boundarys
and points. The needed rainfall frequency table should be named like this with
the radar site id 'GetNexrad_MXX_Rainfall_Frequency.txt'. The format is easy if
you use NOAA Atlas 14:
http://hdsc.nws.noaa.gov/hdsc/pfds/pfds_map_cont.html?bkmrk=al
Use the submit button for 'Estimates from the table in csv
format:' and open in Excel and save as tab delimited text file as shown here:
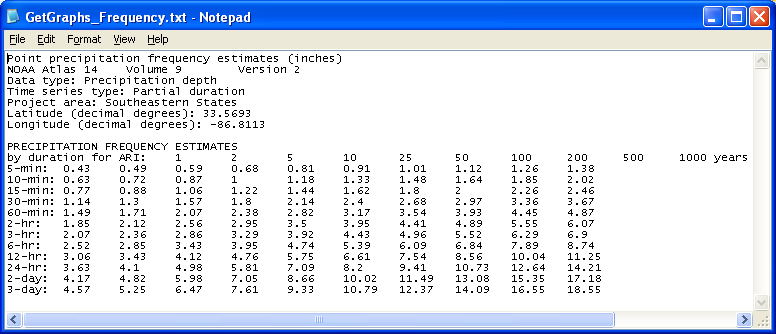
The hourly values values are looked up but the reason you may
want to include the above rainfall depths below 60 minutes is because the last
hourly value will be dated as the last available value. So the availbe minutes
in the last hour will be rounded per the table above and looked up, other wise
60 minutes is allways used even if the last hour only had 5 minutes.
Update 3/1/2014: You can compute the frequencies and
depths of your radar loop for each duration in your frequency table using the 'Click Me DBZ' to
open the radar dbz to rainfall form and checking 'Rainfall Frequencies' as shown
below. You can also use your GetAccess HDB hourly radar adjustment ratios
to adjust the dbz to rainfall conversion. When you save the GetNexrad
setup the DSID will be saved also. You can click on any point or select a
boundary for your frequencies.
Update 12/5/2013: GetNexrad 4.1.1 can 'Save' the
radar image to PNG file or the whole GetNexrad window form. The
saved PNG image file can also be FTP'd to your website. If in a radar loop, then
the PNG file will be created each time the loop is updated with a new radar
image and then FTP'd automatically if desired. You could have GetGraphs include
the PNG file on your hard drive as one of it's 'Web pages' for display.
For Windows 10 you may need to change security settings Allow App Through
Firewall.
The 2 PNG images are:
GetNexrad_image.png --just the radar screen.
GetNexrad_window.png --the whole GetNexrad window form.
To show this form select the checkbox 'Save'
on the main menu, not the 'Save Setup' button.
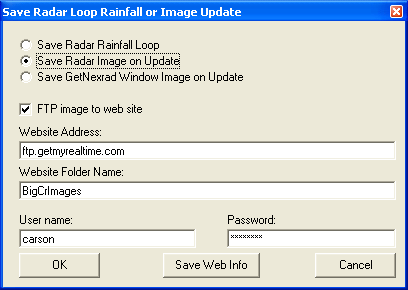
Batch Mode: Update 5/15/2014: GetNexrad.exe can be ran in batch mode with the command
lines:
GetNexrad.exe -1 ...load default and save image to png file.
GetNexrad.exe -2 ...load default and save window to png file.
To FTP to your GetNexrad ftp setup include your password:
GetNexrad.exe -2 mypassword ...load default and save window to png file
and FTP it.
If shelling form GetRealtime, then the GetRealtime_setup.txt line could be:
SHELL-C:\Program Files\GetRealtime\GetNexrad\GetNexrad.exe -2;
0; Picture; Nashville Nexrad; -1
To use different GetNexrad setup files and ftp it:
SHELL-C:\GetProjects\GetIIDarea\GetNexrad\GetNexrad.exe -2
GetNexradFilesSouth24hrQPF.txt MyPassword; 0; Picture; Nexrad Picture to Web; 0
Use the -1 in base1 to show the window to capture.
Use 0 or blank if option -1 save image and you do not want to
show GetNexrad.
You could then add the png file to your GetGraphs setup list.
To SHELL dos commands like COPY in GetRealtime.exe you must put them in a BAT
file.
Update: One final thought. Try to resave
your setup with each new version of GetNexrad.exe to keep confusion do a
minimum.
Coordinating GetNexrad and GetRealtime Setups:
A typical folder setup would be:
C:\MyProjs\Project1\GetAccess
C:\MyProjs\Project1\GetGraphs
C:\MyProjs\Project1\GetRealtime
C:\MyProjs\Project1\GetNexrad
For a second project:
C:\MyProjs\Project2\GetAccess
C:\MyProjs\Project2\GetGraphs
C:\MyProjs\Project2\GetRealtime
C:\MyProjs\Project2\GetNexrad
Just create the
folders and copy all the files. Once GetRealtime and GetNexrad hav been
installed you can copy any of the files as needed with out re-installing.
GetNexrad should then select a radar image from the GetRealtime folder where the
boundary and point files will also be and 'Save Setup'. Updates require
only downloading the new exe file and replacing the old exe file.
Multiple Setup Files: Update 1/5/2021
now you can setup radar selections and surface obs and save to
GetNexradFilesxxxxxx.txt and then reload GetNexrad from a command line with the
new setup flilename. A simple example would be to include a radar image of the
whole USA with upadated radar, NWS flood sites, and QPF rings automatically.
A new command lines could be:
GetNexrade.exe -2 GetNexradFiles33.txt mypassword (update USA
radar and surface ops and ftp)
or
GetNexrade.exe GetNexradFiles33.txt (run GetNexrad and
automatically update radar and surface ops)
old way:
GetNexrade.exe -2 mypassword (use old default
GetNexradFiles.txt and ftp)
You can use GetRealtime.exe to Shell or create desktop links
with the command line.
Display All Canadian Radars:
Update 2/19/2022 to view map of Canada and toggle display all the radar sites
download these 3 files and...
Put this png in your radar image directory:
CAN_N0Q.png
Put these two in your GetNexrad.exe directory:
RadarSites.txt
CAN_N0Q.pgw
Now you can select the CAN_N0Q.png or use the New Site, Update
file list:
US CAN Canada Radars
You can DOUBLE-CLICK on the radar site you wish to get the
latest image for. These files are already in included in the latest full setup
download.
As of July 2024 only Constant Altitude Plan Position
Indicator (CAPPI) rain and snow are now available from the Canada
radars.
Attention NASCAR racing fans....

Gentlemen (and you too Larry McReynolds)
start your radars!!!
When rain is in the area, would you like to try to out guess Larry and the other
crew chiefs on when to pit, when to stay out, or if the day will be a rain out?
Well now you can. Your free GetNexrad download comes with setups for all
36 races on the NASCAR Cup Series schedule. So reach up there and
turn on that radar loop one more time cause we're getting ready to go racing!!!
Or as DW says, "Boogity, Boogity, Boogity, hey ho, let's go..." or something to
that effect.
After installing the NASCAR overlay files as described below, for each race fire up GetNexrad.exe and press 'Select Radar Gif Image' and select the gif file in the
C:\Program Files\GetNexrad\NascarRadarGifs\
folder from the list below, then right click the radar image and press 'Get Radars'
to update the image or loops. Remember... it's RIGHT CLICK THE IMAGE!!!.... dont be as stubborn as some crew chiefs
like Larry and his front tire changer that can't
remember righty tighty, lefty loosey. And one more thing, be sure to empty your Recycle Bin often or
Larry will not be pleased and you'll be sweeping out the shop.
I almost forgot to tell you how to estimate time of arrival (ETA) for
rain cells on the radar arriving at the race track. If you have an auto
updating radar loop going then you can click on loop 'Stepping'. With both
'Lat/Long' and 'Miles' unchecked back step to the beginning of the loop.
Left click a rain cell moving toward the track. Then step forward to the
end of the loop and click on the new rain cell position. The text in the
upper left of the screen will display the miles away to the current rain cell
location and the ETA of its arrival at the track. You can use a 5 minute
step, but the longer the time period between first and last step the more
accurate the ETA will probably be. (See newer examples and video above
Larry's head.) There is an art to determining what
rain cells and what location and what loop steps to select. Hey, I didn't
say you would out guess Larry, but now you have a better chance.
Nearest Radar for NASCAR Races:
(note: N0R & N0Q have been discontinued, use N0B images
Track--------------------------Radar Gif File
Daytona Clash-----------------MLB_N0B.png
Austin COTA------------------EWX_N0B.png
Nashville-----------------------OHX_N0B.png
Atlanta-------------------------FFC_N0B.png
Las Vegas-----------------------ESX_N0B.png
Phoenix-------------------------IWA_N0B.png
Fontana------------------------SOX_N0B.png
Martinsville -----------------------FCX_N0B.png
Texas -----------------------------FWS_N0B.png
Bristol --------------------------MRX_N0B.png
Richmond -----------------------AKQ_N0B.png
Talladega -------------------------BMX_N0B.png
Dover --------------------------DOX_N0B.png
Kansas ---------------------------TWX_N0B.png
North
Wilksboro -----------------FCX_N0B.png
Charlotte ---------------------GSP_N0B.png
Gateway --------------------------LSX_N0B.png
Iowa -------------------------------DMX_N0B.png
Road America --------------------MKX_N0B.png
Pocono --------------------------BGM_N0B.png
Michigan -----------------------IWX_N0B.png
Sonoma ------------------------MUX_N0B.png
Chicago ---------------------------LOT_N0B.png
Kentucky -------------------------LVX_N0B.png
Loudon -------------------------CXX_N0B.png
Watkins Glen-----------------BUF_N0B.png
Darlington -----------------CAE_N0B.png
Indianapolis ----------------IND_N0B.png
Homestead --------------AMX_N0B.png
www.nascar.com
After intially downloading and installing GetNexrad, race fans can install the NASCAR
race
overlays and boundary files by following these steps:
1) With Windows Explorer go to C:\Program Files\GetNexrad
2) Unzip the file C:\Program Files\GetNexrad\NASCARoverlays.zip by right
mouse clicking on it and select 'Extract All'
3) Select the destination C:\Program Files\GetNexrad (you will have
to change the default destination to this).
4) Then answer 'YES to ALL" when prompted to replace files.
5) Fire up GetNexrad and you should now be set to start the season with the
displayed radar image for Daytona Speedway. For the next race at Phoenix select
IWA_N0R_0.gif from the NASCARradarGifs directory as shown on the list of tracks above... and let's give Larry a run
for his money.
How to video on estimating storm ETA to race track:
Maps By


WEBSITE MAP
Comments/Questions
Email: getmyrealtime@yahoo.com
Label
|