|
NEXRAD Radar rainfall adjustment
A do it yourself real-time radar rainfall adjustment methods using free data and
software. 5-minute radar over a 30.5 sqmi catchment is adjusted using 1,
2a, 2b, 3 and 4 Wundergages and evaluated using 6 USGS tipping buckets and
runoff at a USGS streamflow gage. If I can, anybody can do it.
As a radar beginner wrestling with NEXRAD radar for 3 years, I finally figured out what wiser men have said all along... and that is
that radar rainfall must be adjusted. It is time to put emphasis on ADJUSTING THE RADAR instead
of looking at ADJUSTING THE RUNOFF. The runoff did not need help but has
been honed sharp, it just
needed better rainfall.
Anyone wishing to do so, can download my free Windows programs (see links at
top) to do the same
thing shown here in real-time or for historical analysis. Any questions are most welcomed. (yes, that's The King, pre STP
colors working at a Charlotte gas station.... so you too can be somebody someday
with the right radar colors.)
Radar N0Q 0.6 mile pixel versus USGS 8" tipping
bucket
There is an old saw (a NWS rationalizaion) that you cannot expect to get an 0.6
x 0.6 x 0.6 mile volume of rainfall to fit into an 8 inch rain gage with the
wind blowing from 10,000 feet and therefore the obvious collary would be you
cannot adjust a radar value written from on high with an 8 inch rain gage....
poppycock! Only a radar rube like me would have fallen for that line of
reasoning. Dang them, they should stop misleading us poor rubes. You
most certainly can and if you don't you are a bigger rube than I! The
new radar super resolution is 4 times finer than 0.6 miles but can you hit an 8"
rain gage from 10,000 ft with something even smaller??? We will find out.
Although I have found that the radar seasonal error can be corrected quite well
by a single constant correction factor for rainfall/snowfall
accumulations for climate studies like snowpack and melt,
rainfall-runoff at the catchment level requires a basin correction factor on at
least an hourly basis (if not more?) applied to the 5-minute radar rainfall from
a standard z-r relation (cool or convective). This is equivalent to
changing the 'a' in Z=a*R^b each hour, so let's get to it.
Study Setup:
I did a web search for
professional rainfall gage networks that are available on
line in real-time. I found that the USGS has had a network available for
the Charlotte, NC area that has been collecting 5-minute rainfall since 1992.
Their network location link is:
http://nc.water.usgs.gov/char/rainfall.html
The rainfall data site ID's are 15 digits instead of 8 and so I had to update
GetRealtime to recoginize these ID's. And as long as we are at it, I have
choosen a runoff basin and selected the 6 rain gages in it for comparisons. The
basin selected was for the 30.5 sqmi USGS gaged basin at
Irwin Creek near Charlotte, NC.
The basin centroid is 81 miles east by northeast of the GSP radar and mid-beam
elevation is 8,600 ft. The N0Q 1000x1000 image pixels are 0.57 miles x
0.69 miles. Each gage has a decimal pixel location where a 0.5 would be the ideal center of a pixel.
The 6 USGS raingages are:
#G1= 351502080512045; CHARLOTTE RAINGAGE BEATTIES FORD RD, NC
(-80.85555,35.2505>>635.3178,464.1883)
#G2= 351331080525945; CHARLOTTE RAINGAG FIRESTATION 10, NC
(-80.8830,35.2252>>632.6055,466.6881)
#G3= 351412080541245; CHARLOTTE RAINGAGE HARDING HIGH SCH, NC
(-80.9033,35.2366>>630.5997,465.5617)
#G4= 351642080533445; CHARLOTTE RAINGAGE CMUD ADMIN BLDG, NC
(-80.8927,35.2783>>631.6471,461.4414)
#G5= 351741080475045; CHARLOTTE RAINGAGE TURNING POINT ACADEMY, NC
(-80.7972,35.2947>>641.0832,459.8210)
#G6= 351954080493445; CHARLOTTE RAINGAGE FIRE STATION 28, NC
(-80.8261,35.3316>>638.2276,456.1750)
So now we have known points that we can
stuff 0.6 mile pixel rainfall in. My way to adjust radar is to
use free Wunderground Weather Stations. They usually have 5-minute time steps
so that the hourly total will be near hour hh:00 and are available online for
free in REALTIME. I weeded out some of the closer Wundergages and found
these three that look very reliable, but I have
fallen for bad ones before so we shall see (and I did... WG South has been
replaced 4/19/2013 and again 5/6/2013.
Wundegrage East had began having incomplete days and was replaced 5/21/2013 and
then that one was replaced yet again on 6/2/2013.. and again 6/13/2013.)
In a real world application, I
would imagine one could talk to the Wundergage owners and slip them a fin to
inspect there setup and do some QA or have your employees or relatives install
and operate Wundergages at their homes at strategic locations.
The 3 Wundergages located on the location screen below are
(ok, 2 have changed slightly but lat/long and distances below are correct for
current use):
Wundegrage East is KNCCHARL42 at
10.2 miles from basin centroid
(-80.703,35.329>>650.3908,456.4319)
Wundegrage South is KNCCHARL76 at 6.3 miles from basin centroid
(-80.845,35.192>>636.3602,469.9685).192>>636.3602,469.9685)
Wundegrage West is KNCGASTO8
at 12.2 miles from basin centroid
(-81.063,35.275>>614.8202,461.7675)
A 4th Wundergage was added to the north to see if that would hlep, it didn't:
Wundegrage
North is KNCCHARL12
at 8.3 miles from basin centroid
(-80.784,35.356>>642.3874,453.7641)
So far I have
found using the hourly ratio (not daily, thats a last resort) of the Gage/Radar to determine
an hourly adjust factor to apply to each 5-minute radar value in that hour and
that is what we will do here. The adjustment to the 5-minute radar at each
USGS rain gage will be the hourly 3WgageAvg / 3RadarAvg. You could use the
sums instead of averages but the sums do not compare graphically as nice and
looses some connotation. And should a Wundergage fail, the averages could
still give a good ratio but the totals would not. GetRealtime Help
web page describes the needed setups and its Setup Wizard will help you figure
it out. Remember we are using 5-minute hourly totals and that hopefully the only ratios that will be computed are viable
ones above 0.05 inches for the hour at the Wundergage. But on the other
hand setting the 0.05 too high allows radar over estimation to go uncorrected or
even zeroed out. There are other
refinements to this method that the user can make, like the 0.05 test before
ratioing, then what upper and lower limits of computed ratio to use. These
factors
can make a big difference as we shall see.... for the worst at extreme times... so 20 times
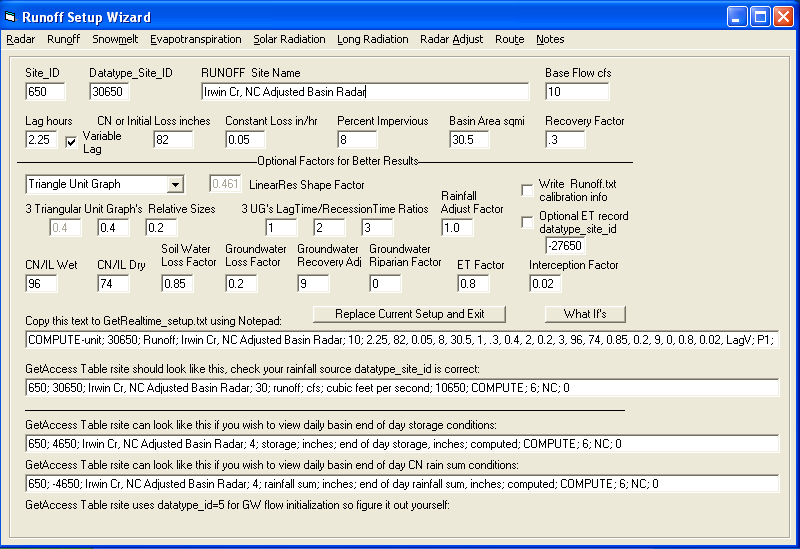
radar is not encouraged. My steups are:
GetRealtimeSetups:
COMPUTE-Hour; 10654; Rainfall; Irwin Cr, NC Avg of 3 Gages; 0; 0; (P1+P2+P3)/N
COMPUTE-Hour; -10654; Rainfall; Irwin Cr, NC Avg of 3 Radars; 0; 0; (P1+P2+P3)/N
COMPUTE-hour; 31654; Ratio; Irwin Cr, NC Avg of 3 Gages; 0; 0.05,1,5; P1/P2
.... at a gage adjustment example...
COMPUTE-unit; 11655; Rainfall; CHARLOTTE RAINGAGE Adjusted Radar; 0; -1, 1, 0.4,
0.5; P1*P2
Try to use the 11 datatype for adjusted rainfall... it really gets confusing so
remember to use 11 or -11 instead of 10. Ha, you won't believe this but
it's the DataType stupid that determines the computation methods in GetRealtime.
I changed the code so 11 would work same as 10 for rainfall so my
DatatypeSiteID' like 11654 would work like 10654 but in doing so I forgot to
actually change the database datatypes from 10 to 11 and so doy! It worked
the same without the change. Now I have the 11 datatype with no real
purpose. Dang! So 10654, 11654, or even 32654 would work just as
well if the datatype is 10. Live and learn... but I still like to
look at 11654 and know it's adjusted even if I forgot to change the datatype
from 10 to 11.
For the
database GetAccess table 'rsite' you can use GetRealtime with the Setup Wizard
with the above setup values and it will suggest the 'rsite' table setup.
All gage times are converted by GetRealtime to my computer's time which is
Pacific Time (rsite -3) as well as the radar time which is done automatically. And yes, keeping track of this
setup stuff can cause a brain clot but I do not know
how to make it simpler safely. So just pace yourself and use Notepad and some junk
mail envolope notes like I do. And dont blame me, the NWS should adjust
every pixel for us. Ha! The NWS radar rainfall products like N1P are
complete duds as I have noted in several of
my earlier learning studies
and should be avoided. Admittedly, I seem to pick sites 80 miles or more
from the radar so this may have something to do with it. On the other
hand, I bet even N1P could be adjusted using my adjustment methods, but why
would you? Its for an hour, has 1.2 mile squares and has real bad rainfall
precision steps so just stick with 5-minute 0.6mile x 0.5 dbz precision of N0Q
for realtime or 0.15 mile x 0.5 dbz Level2 for historical studies. Perhaps
my next radar adjustment study will be to redo these rainfall adjustsments but
with Level 2's 0.15 mile resolution to see if that is way over kill or
not. For now let's just see how things work in real-time with N0Q. A
guy could make a career out of this stuff if it paid something and anyone really
cared. (Update: Level2 versus N0Q has been added at the bottom.)
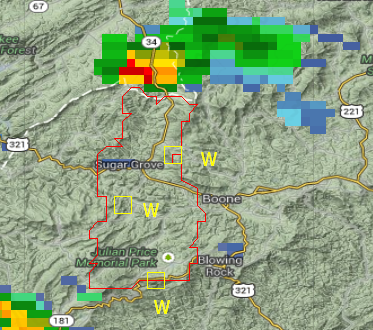
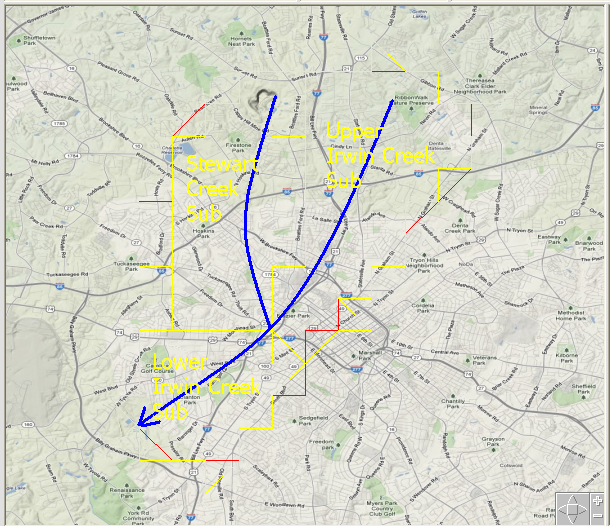
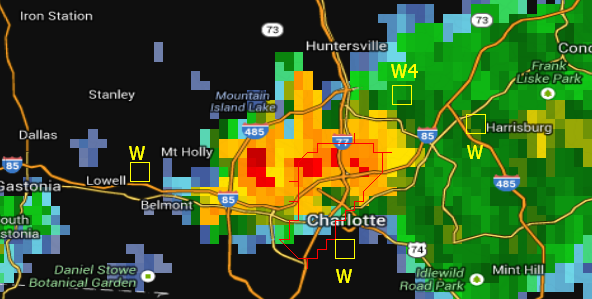
W=Wundergage location, Gn=USG gage locations, and the Irwin Creek basin radar
pixel boundary is shown:
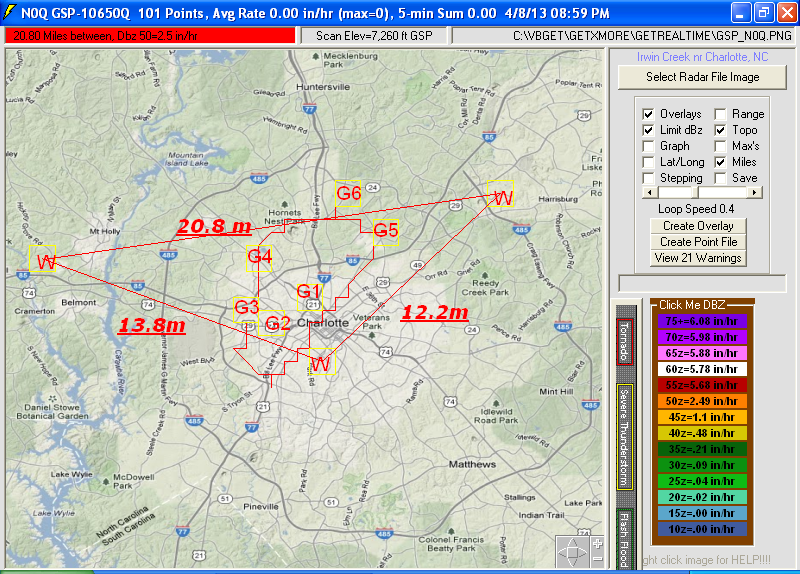
Boy, 20.8 miles is sure a long ways but these can be typical distances in areas
of sparce Wundergages. If we can't get these distances to work out then I
will rethink a Plan B. Maybe some full radar screen adjustement based on
distance and sector (Hey, dont we pay these NWS guys to just that???).
Something to note about adjusting radar is that
when the radar says near zero,
not much way to adjust it. (perhaps using the dbz below 20dbz=0.02
may help here???) Happens again and again but dont fall for
setting your adjust limit to 20... it will bite you bad... I would stick to 5
tops... and a lower limit of 0.3 seems to be where things are headed. I
quess this is why radar rainfall is usually obtained from a commercial radar
provider so as to let them figure this all out but you will soon see why you may
be in a better position and motivated to look into how to adjust your sites best. But already having
suffered through a brain clot or 2, you're nearly home. Here is adjusted radar rainfall in
all it's magnificent glory!!!
APRIL 4, 2013--N0Q Radar and 3Gage Adjusted Radar at USGS Rain Gage Comparison:
I hate to jinx this study so early but boy, I had hoped these adjustments would
be alot better. I can see I may be refinining GetRealtimes ratioing
methods as experience gets experienced.
% Difference is the error in cumulative rainfall, a measure of
bias, like runoff cares.
MAE % is the mean of the individual hourly unsigned differences,
like runoff does care.
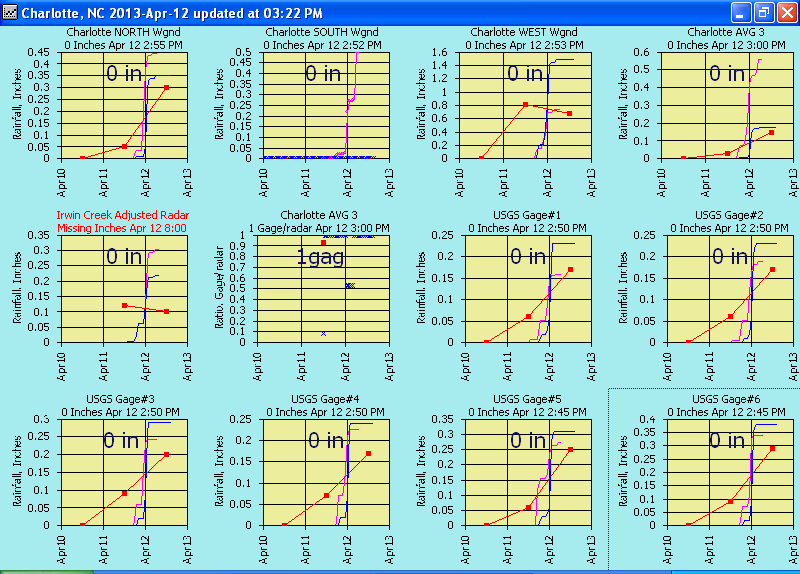
APRIL 11, 2013--N0Q Radar and 3G Adjusted Radar at USGS Rain Gage Comparison
in GetGraph:
Note that the 2nd graph, Chraroltte SOUTH Wgnd shows zero rainfall while the
violet radar shows 0.5". This screwed up the whole adjustment but thats
par for the radar course. ** I feel another brain clot ** The last 6
graphs at the USGS gages show the adjusted radar in violoet.
These screw ups tend to fade in time as bad Wundergages get weeded out.
APRIL 19, 2013--N0Q Radar and 3G Adjusted Radar at USGS Rain Gage Comparison
(BAD RESULTS):
I thought that the Wundergages were just too far away so I tried using just the
one closest gage but that gave even worse results. For this storm, setting
the 'Gage Minimum for Hourly Ratios' from 0.05 down to 0.02 would fix the
trailing bad radar values near hour 18:00 but lets see what the next storm does
before changing. Using 0.02" would reduce the %Diff from +28% to -6% at
Gage #1 and would drop from +78% to +35% at Gage #6.
APRIL 28, 2013--N0Q Radar and 3G Adjusted Radar at USGS Rain Gage Comparison:
The 'Gage Minimum for Hourly Ratios' has been
lowered from 0.05 down to
0.02. MAE's are still pretty poor.
May 5, 2013--N0Q Radar and 3G Adjusted Radar at USGS Rain Gage Comparison:
The 'Gage Minimum for Hourly Ratios'
is 0.02". Results are still pretty poor. South Wunder Gage was dead
so radar adjustment graphs use the 2Gages West and East Wundergages.
May 19, 2013--N0Q Radar and 3G Adjusted Radar at USGS Rain Gage Comparison:
The 'Gage Minimum for Hourly Ratios'
is 0.02". Results are the worst yet for 2 gage ratio.
The East Wundergage was down during the morning when it was not raining and may
be off???. (update: The East Wundergage failed again and was replaced May
21) The storms were scattered thunderstorms where it was only
raining at each Wundergage at different times so that the peak adjustments were
really more like a single gage adjustment. For thunderstorms it would be
easy to think
the 'Maximum Usable Ratio' should be reduced from winter's 5 to maybe 2 at this
basin but it would have not been anywhere near enough so is not something
reasonalble to do. The closest USGS gage had 1.77 inches while
the East WG had only 0.56 inches so may be the whole problem so no reason to
panic yet. Using the 3 WG ratio worked much better than the 2 WG ratio at
5 or 2 Max Usable ratio for
this day... safety in numbers.
June 2, 2013--N0Q Radar and 3G Adjusted Radar at USGS Rain Gage Comparison:
The East Wundergage was down AGAIN and replaced on June 2.
Although the adjusted rainfall was below the USGS gages, the runoff came in a
litte on the high side.
Ok, now that you have seen enough of the blow by blow
cringing graphics, lets
see the results over time as they pile up...
Study Results... as they come in:
As of 4/19/2013 these
3 storm results are not what I had expected and are about the worst I have seen. I have not shown
the closest 1 W gage ratio and 2 W gage ratio results but a closest 1 gage ratio
seems to be a very bad choice at Charolette. The best results so far are
obtained by using 2 W gages on opposite ends of the area of interest .
This opposite ends theory seems to also hold true to a similar sized basin I
have been looking at for urban Birmingham, AL but have not published. My Las Vegas, NV study
shows the closest W gage is better and has had a wee bit more testing... but not
always, sometimes distance does not matter there either meaning an improved
adjustment with distance. I even tried adjusting based on the #1 USGS gage
at the center of the basin which was actually worse than the 1 Wundergage adjust
(see peak flow table below). This radar stuff is just plain diabolical.
I have seen alot of adjustments but nothing as bad as April 19 above so I hope
this is just a one off case. But as noted above, setting the 'Gage Minimum
for Hourly Ratios' from 0.05" down to 0.02" would reduce the storm total bias by
half and may be the next step and doing so reduced peak runoff a good deal but
nowhere enough.
May 19 was even worse than April 19 for the 2 WG ratio. The 3 WG ratio
was not so bad. The 'Maximum Usable Ratio' value of 5 being
lowered to 2 for thunderstorms at this basin would not be sufficient so that for
these distances the more gages probably the better. The offending East
Wundergage failed again May 21 and was replaced with one 3 miles closer to the
basin and may have been the real cause for the problem.
After mid-May the storm cell areas have become smaller and tend to affect only
one Wundergage at a time at these far distances between Wundergages. Daily
ratioing as well as a 4th Wundergage has been added to see if this would help
overcome the distances with these smaller storm cells. You can see the
results below on the peak flow comparisons.
Summary of the
2 East-West Wundergages adjustment at the 6 USGS gages and for the Basin:
Comparison of unadjusted and 2 gage adjusted N0Q basin average rainfall to 6
Gage Average as Hourly Mean Absolute Error by event and their average. The
adjusted green average line is supposed to be much below the pink unadjusted
average line.
The adjusted basin radar vs 6 USGS gage average is a little less than hoped for.
I think the reason for this perception is that the UNADJUSTED radar is
surprisingly not too bad at this
location, but also 20.8 miles between Wundergages is not helping. My other studies unadjusted radars were just
not usable without adjusting (see 2nd graph below example).
As an example of adjusting a radar also 90 miles out using 3 Wundergages INSIDE
of a 91 sqmi basin
average radar comparison (note how bad the unadjusted radar is here and how nice
it seems above, and yes comparing the basin adjusted with the Wundergages used
to adjust it may be cheating):
Keep an eye on the all
important Basin vs 6 Gage Average because that is what we are
really using for runoff and remember even the 6 Gage Average aint sacred and
could be less reliable and could even be interpreted as the 6 Gage averaging
error as it has at times been shown to be based on peak flows.
You can see the 3gage ratio adjustments for each storm event on the Level 2
comparison below.
Gage/Radar Ratios:
The 3 gage ratio is the hourly ratio of the average of the 3 Wundergages divided
by the average of the 3 radars at the gages. The 2 gage ratio uses
the West Wundergage and East Wundergage. The 1 gage ratio uses the ratio
at the South Wundergage only and being closest to the USGS gages I would have
thought would provide the best results... so far that is not so. The MAE
(mean absolute error) in the graph titles below are computed when the 6 USGS
gage hourly average is 0.1 inches or more. The MAE should not imply that
the 6 rain gages give better basin average rainfall because they actually don't
seem to. The April 28 peak and volume runoff from the 6 gages was too high
and the 2Gage ratio was actually the best.
Daily Accumulations: Don't let the linear plots of
unadjusted daily totals fool you into thinking unadjusted radar is great like I
did. Some how the NWS has the bias down pat, but their 5-minute values and
hourly sums can be COMPLETE DISASTERS so don't fall for adusted radar bias as
any great feat. It's those 5-minutes that count. The daily
accumulations do show that the USGS gages are working and that there is no large
differences from gage to gage between the comparisons to radar and so all are working properly.
Actually this radar location has about the best UNADJUSTED radar rainfall I
think I have seen for any radar site so far, cumulative wise.
Yeah, whatever....
Also it's a good idea to monitor the Wundergages to be sure they are working
properly:
Wunder gages East, South,
and North look nice and linear. West is a bit sloppy and I will keep my eye
on it. Also note how the radar is above the East and South gages but
is always below the 6 USGS gages above. Perhaps West slop is helping here.
Daily accumulations will not show if leaves get in the tipping bucket and cause
slow tipping so an eye must be kept on the 5-minute plots vs
radar values for sharp steps indicating that it's leaf free and that is done
in my GetGraphs that is used for viewing all the hourly or unit data in real-time or
the next day.
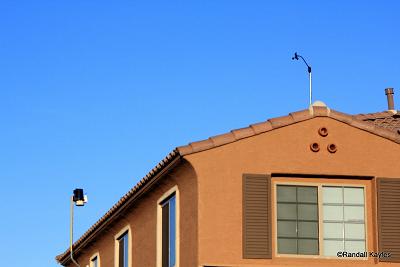
Logistics:
Typical Wunderground site and hard to maintain weather station:
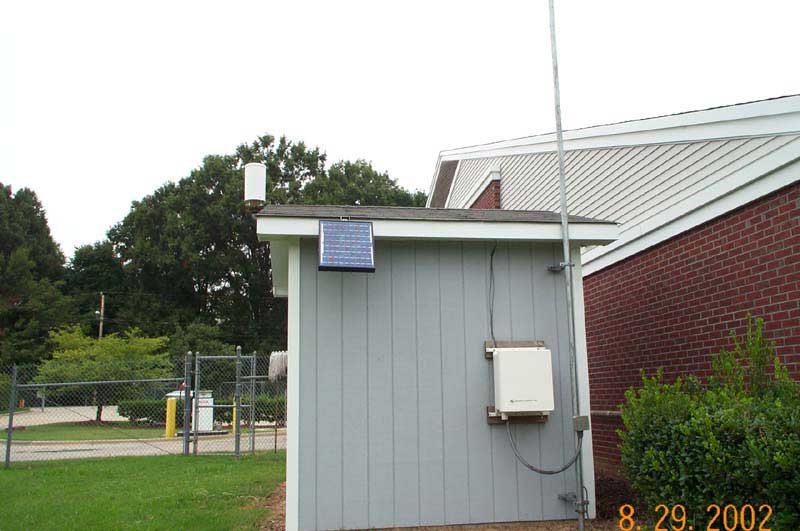
Professional USGS rain gage setup ... ok so the only difference is a bigger roof
top:
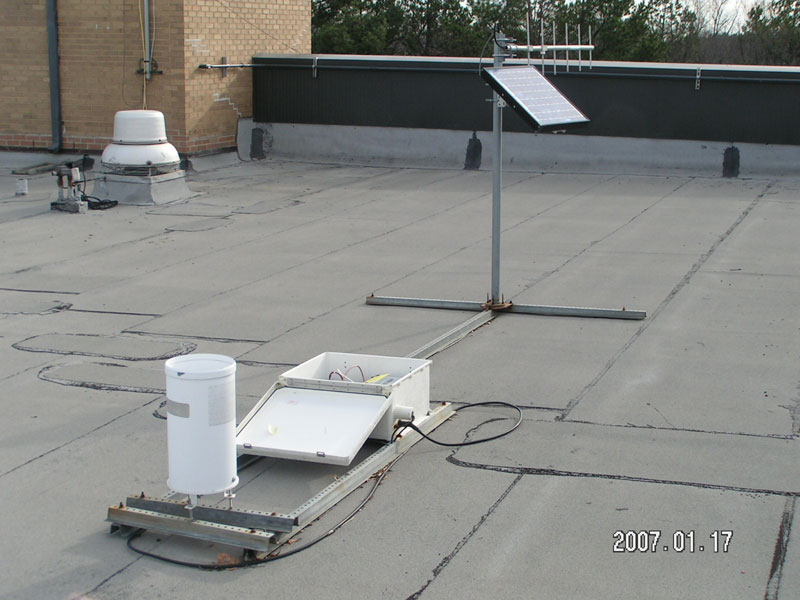
I'm a little concerned about all these USGS gages on flat rooftops getting roof
splash up and into their gages so I will check them againtst this one #G6=
351954080493445; CHARLOTTE RAINGAGE FIRE STATION 28, NC which should be more
splash proof. For winter storms Jan 1, 2013 to Apr 4, 2013 the nearly same
12" has been measured at the splash proof and 2 nearby rooftop gages, so far so
good:
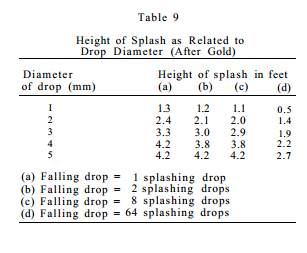
A web search indicates that heavy rainfall can splash vertically over 4 FEET!
but column (d) is more typical:
ADJUSTED BASIN AVERAGE RADAR RUNOFF:
My runoff loss method here is
GetRealtime's SCS curve number method adapted for continuous simulation and is
honed sharp to cover all the bases if need be.
The 30.5 sqmi basin lumped radar average 5-minute rainfall was adjusted using the
same
hourly ratio of the 3Wunder/3Radar used to adjust at the USGS rain gages above.
I prefer to use the 3 Triangular Unit Graph method because it allows mimicking a
bit of routing for a better calibration fit than a regional dimensionaless unit graph (you
could create your own unit graph but why bother). The Linear Reserovoir
method allows for a bit of routing adjustment too and is almost as good as the
triangles and you might even prefer it for its ease of adjustment. I
always check my initial unit graph method with the SCS dimensionaless graph just
to be sure the peak flows are reasonably close to what it says and then adjust
the recession to the flow gage. The % impervious can be adjusted by
fitting the smaller peaks where SCS CN losses are greater than rainfall.
I was surprised how easy it was to guess at the inital runoff coefficent setups.
I just grabbed a setup for Birmingham, AL, set the minumum base flow, lag time,
and forced most of the runoff into the peak Triangle runoff, and fiddled with
the recession slope, all in about 1 hours time and was surprised how good it
worked. But these runoff coefficients I have used here don't
have a snowball's chance in hell of working for the next storm forecast in about
2 days.... watch and learn... oops...ok the next one then. You need a few
storms to zero in on the longer term dry CN and such as the continous system
storage parameters gets initialized (see below).
Initial Calibration: (actually I don't think I ever changed this much)
This April 19 runoff had terribly bad adjustments to the radar.
Boy this is one big black eye for adjusting. I should add UNadjusted but I
know that's just crazy talk. Using a 0.02" instead of the 0.05" limit
before ratioing would help alot but not enough and is not shown but I suspect we
will soon be using 0.02" if this keeps up. (Actually I have been
using a 0.02" as the wundergage trigger for ratioing for my other studies so I
guess I must have already figured this out. But wiser men suggest 0.1" so
what can you do.) If you are wondering why not 0.01" is that
is special case and will zero out any radar rainfall over the basin if there is no
rainfall at the Wundergages. Not a deal killer for larger storms and I did
try it here but did not help. The Apr 4 storm of over 1" produced about
the same peak runoff as this 0.05" adjusted storm and thats a black eye... uh
maybe you need to adjust the runoff recovery factor like you suggested after one
storm duh!
April 28 Runoff (includes just using the 6 USGS raingage average which I am
shocked was not better):
May 5 Runoff: Something just does not look right about the lag times on
all thes hydrographs. I wonder if some sort of regulation is occurring
like fast storm drains , interbasin flows, or detentions. With the
continuous soil moisture pretty well initialized prior to this May 5 storm, I
will try to recalibrate this storm some more because something is fishy...
Ah Ha! After an online search of the Irwin Creek Basin it turns out there
is no significant regulation but the basin consists of two parallel branches of
similar size with their confluence 2.8 miles above the Irwin Creek stream gage.
I think the 30.5 sq mile basin needs subdividing at the 11.1 sq mile Steward
Creek branch and luckily it too is gaged. I think I will continue with
this lumped 30.5 sqmi example to show as a reason to subdivide and just add
another
hydrograph line for the subdivided case. After subdividing the basin for
the May 5 storm I didnt get consistant lag times as I hoped but I think I discovered the
real problem. The recent storms are training along a southeast to
northwest track while slowly moving eastward. The lower portion of the
basin is getting heavy rainfall while the upper basin portion not so much.
This causes a faster runoff near the gage until the whole basin is being
covered. I know you are thinking why I didnt I add a 3rd sub below the
confluence and well I should have but I'm hoping eventually the storm tracks will be west to east and
even more subdividing will not be needed but we shall see. Ok, I went
ahead and subdivided the basin into 3 subs but that still did not improve things
much. So much for my storm tracking theory. I guess that just leaves
poorly adjusted rainfall although using the 6 USGS gage basin aveage was no improvement.
I could use the subdivided basins with closest USGS rain gages but I won't.
I have since revised GetRealtime 3.1.2 to include a variable Lag time
and that made an improvement in peak flow comparisons for both
bias and %MAE. My variable lag is computed as Lag = Lag0 - SoilSpace * Lag0 / 2.
This reduces the Lag0 entered for dry conditions to 1/2 Lag0 when saturated. The
lag time and all unit graphs are updated on startup soilspace and when the
computed Lag changes by 5 minutes. So as rainfall increases, soil space is
reduced, and the Lag time is reduced. Under dry contitions soilspace increase and
Lag time increases. Pretty clever eh!
Looking at some of the rainfall accumulation graphs you can see where radar and
adjusted radar can preceed actual rainfall accumulatins at the 6 USGS gages by
several hours. I quess this is the real problem with lag times, although
the 6 gage runoff only improves the lag somewhat better. Hmm... 10%
impervious could be causing the early rise on the smaller peaks and then gets
lost in the large peaks. It's probably a trade off between getting the
peak values correct or getting the timing correct over the full range of peak
flows so I won't do nothing, but you could try.
Routing File:
Three sub basins Irwin Creek, NC
GET 4 30670 Upper Irwin Cr Subbasin #1
GET 4 30671 Stewart Cr Subbasin #2
COMBINE
ROUTE Modpul ModpulLowerIrwin.Rat (Tatum 0.75 hrs travel worked as
well)
GET 4 30672 Lower Irwin Cr Subbasin #3
COMBINE
END
Modpul Rating File:
Lower Irwin Creek, Steward branch to USGS gage
bw=30', bs=3, cs=6.8 ft/m, cl=2.8 m, n=0.035 using my free stuff
ChannelStorage.exe and Google Earth
5 0 0
5.2 3.144004 2.077091
5.4 10.04043 4.235637
5.6 19.85955 6.475636
5.8 32.29116 8.797091
6 47.16438 11.2 ... etc out to...
22.2 9999.145 476.3462
May 19 Runoff, Wundergage East produced a very high ratio and screwed it all up
but the 3 WG ratio did a heroic job of compensating for the East WG screw up:
June 2 Runoff, Wundergage East replaced again.
June 28 Runoff, Wundergage East had 3.45
inches of rain in 4 hours, WG South 0.88 inches, and WG West 1.30 inches.
Although the adjusted %MAE was very very bad, the % Diff was right on and so
helped bring the peak runoff right in on target. You can see the 3gage
ratio adjustments for each storm on the Level 2 comparison below.
July 11, 2013 All the rain was building over the basin and not so much at
the adjusting rain gages. Basin reflectivity gradients were so pronounced
that there was even a difference in the Level2 higher spatial resolution
boundary vs N0Q rainfall. A 4th Wundergage was added to see if that would
help which sometimes does and sometimes doesn't but did help on this event.
Current Setup
(updated 5/8/13)
for continuous simulation for graphs below April 1, 2013 to...:
Continuous runoff comparison graphs each month:
April 2013
May 2013 Wundergage East replaced and 2Gage adjusted soil
conditions reset May 21:
June 2013 Wundergage East died and was replaced AGAIN on June 2:
July 2013 :
August 2013 :
September 2013 :
Ongoing 2Gage adjusted Soil Space converted to CN:
Runoff wise, this is the most important thing of all. See my GetRealtime
Help.
2 gage adjust soil conditions reset May 21 after bad Wundergage replaced.
Divergence from the 6 USGS gages is probably not good and will lead to
over/under runoff which is probably not good. I need to add a table soon
of observed lag times vs peak flows to verify that the use of a variable lag is
warranted.
Observed lag time at the USGS gage and computed lags based on soil storage:
The 'observed' USGS lag time was computed as the modeled peak time versus USGS
gage peak time difference added to the 6 USGS average tipping bucket model's constant lag time. This let
the model figure out the excess rainfall centroid for us since lag=centroid of rainfall
to peak flow times. I tried using different soil lag time formulas and
adjusting the triangular unit graphs and did not get an over all improvement
over the yellow lag formula above Lag=2.25-Soil*2.25*0.5. This allows
reducing the lag in half from dry conditions to wet. And just because the
USGS knows the peak and lag time, it apparently does not mean that the radar and model will like
it. The violet formula above may look better but had slightly greater
%MAE. This soil lag technique did improve over the non-variable lag time
of 2.25 hours significantly. I think the radar sees the rain before it
actually falls and so it could just be floating up there!?. And my
evaluation of the lag time is based on best peak flow, not best lag. This method
needs checked out on a basin with sharper peaks than the round topped ones here
where differing the 0.5 value in the lag formula above may show improvements but
0.5 seems safer than trying greater values that may look better as the violet
graph data above.
Summary of event hourly peaks at USGS flow gage vs 6 USGS tipping bucket average
and Wundergage radar rainfall adjustments:
My Conclusions: I am hoping 2 Wundergages on opposite sides of the basin
aligned with storms general directions will be the way to go. The leading
gage outside the basin will start providing adjustments before the storm arrives
over the basin... or so the theory goes. There is not alot I can find on
the Web about practical applied studies for idiots. Kriging 50 gages is
just not my cup of tea... even if I knew how to Krig or had 50 gages then why
would I want to use radar anyway. I have tried using just the 2
Wundergages without adjusted radar and found that's not a smart idea so its
either a 1 gage adjustment or 2 adjustment... or 3 tops. And 1 gage
nearest the basin is the worst case so far because I have had to replace it
twice. But also I tried using USGS #1 gage at the center of the basin for 1
gage adjustment and very very interestingly that did not
improve on the Wudergage south 1 gage adjustment for peak flows. So it
seems 2 gage adjustment at a minimum and probably 3 gages for more safety.
The Apr 28 jump in USGS 6-gage runoff as well as the peak flow table above seems
to say adjusted basin RADAR IS BETER than a basin GAGE average from 1 rainfall
gage per 5 square miles.
The May 19 ratios indicate that 3 Wundergages
at these distances are much safer than 2 and
certainly 1. Using a lower 'Maximum Usuable Ratio' of 2 instead of 5 which was
better suited for winter stratiforms than for tall and scattered convective
would have helped some but 3WG was still much better. Once the bad
Wundergages get weeded out, hopefully better conclusions can be made.
And remember that storms are moving about 1 gage an hour so the closest gage
will hopefully have the most influence for better or worse. The Wwest gage
may have little infuence at it's distance but sure can't hurt... or can it???
I added a 4th Wundergage North to see if it helps. This is getting
interesting. I think a smarter mind is needed here on just how to evaluate
all this. On the other hand, who lives in Charlotte anyway. ;-) If
using the USGS gage at basin dead center for adjustment is bad, then this radar
stuff is just cat's sleeping with dogs. Boy, is this ever a good plug for
figuring out your own adjusted radar.
Because of the Wundergage distances and storm cell travel time
giving short point duration less than an hour
I added a table of hourly peak flow based on DAILY RATIO adjustment to see if
that would help. Sometimes it does and sometimes it don't. For
larger storms Hourly adjustments seem safer. If you only have one
Wundergage, then Daily ratio is better. If you subdivide the basin then
Hourly ratio is subtantially better. Why? Who knows why. Maybe
more time will tell.
On June 6 I had a huge spike in runoff with the 2Gage adjusted radar that
triggered a
snafu flag. I tracked it down to the Wizard setup for 'Gage Minimum for
Hourly Ratios'. Although setting this value at 0.02, it did not preclude
radar values coming in at 0.001 and creating a 5 limit ratio factor. I
have changed the Getrealtime code so that both the Gage AND THE RADAR must
exceed this 0.02 limit before issuing a new ratio factor. In this case the
Gage had 0.22 and the radar at the gage had 0.015 and the next hour at the gage
had below 0.02" causing the continuing 5 limit ratio to be applied across the basin
that had significant radar rainfall.
I can see why engineers would think this radar stuff is pretty flakey, cause at first glance it is.
We just need to show them you can adjust it!!!... for free... most of the
time... usually... ok you might have to use your engineering degree now and then.
I guess they aren't as
gullible as I was. Hey, I just sell tools, not the rules, so dog gonnit innovate...
and buy some rain gages.
Level2
0.15 mile versus N0Q 0.6 mile (and 'NCQ')
Is the extra effort to use super
high resolution Level2 reflectivity worth it rain wise or will
it actually hinder because of trying to hit a 8 inch rain gage with only 0.15
miles verus the 0.6 miles of N0Q? I sure hope N0Q wins out because
downloading and processing 4 megabyte zip files for a
5-minute image animation
KMZ file via the WTC Toolkit is a real aggrevation (it takes me 1 minute for
each radar image so 1 day would take 5 hours). Why can't the NWS break out the 0.5 degree
base reflectivity from all the other angles or better just give us an image like
N0Q??? Who uses all those high angles anyway! Ok, maybe Dr Forbes
but nobody else. Or maybe the NWS has seen this play out before and knows
the outcome here and why there is N0Q. Those ol' goats at headquarters may be sleepy but they
didn't get old without learning a thing or two.
Iowa Mesonet's N0Q
composite
cutting service has been added to GetNexrad. Iowa's cutting
service works for any lat/long box of any size but GetNexrad cuts each radar
site
as 'NCQ' 750x674 pixels out to only 150 miles which
provides smaller downloads and faster loops. The drawback to using these composite N0Q's is the highest dBz from
nearby radars gets used which causes much higher rainfall. Virga and
melting layer can over ride the nearest radar by these higher dBZ's from farther
away radar sites scanning higher elevations. Also, the higher elevations
(23,000 vs 8, 000 ft) lets the wind blow it farther when gage adjusting. If this 'NCQ' shows promise then it will be
added to GetRealtime. 'NCQ' is not a NWS product code. It's my code
for 'C'omposite N0Q = NCQ. At first look here,
you definately do not want to use this composite with out rain gage adjustment
but it may prove useful in certain locations and when there
is no melting layer in winter.
Let's look at the 30.5 sqmi Basin Average Radar versus the 6 USGS Gage Average.
% Difference is the error in cumulative rainfall
(r-g)/g.
% MAE is the mean of the individual hourly unsigned differences for pairs
greater than 0.1".
AVERAGE unsigned is like a %MAE of the table events.
AVERAGE bias is your normal average that indicates bias of the table values.
Wind is storm cell radar speed and direction of movement. Wind at the rain gages
is usually calm.
So far the unadjusted basin
area radar is essentially the same
for Level2 vs N0Q as would be expected.
The big difference shows up in the adjustments based on point values at
the 3 rain gages. Come on N0Q! You're pulling ahead. It would
be an ironic paradox if the old saw of not fitting a super high resolution 0.15 mile radar in an
8" rain gage proves true, but you CAN fit a 0.6 mile N0Q radar.
A rain drop falling from 10,000 ft at 19 mph in a 10 mph cross wind will be blown
1.0 miles. But after more thought the clouds are moving at 40 mph and
surface winds are calm so wind is not the problem presumably because the 40 mph
extends down to about 500 feet up. On the other hand this
sure looks like something is up with rainfall directions not being straight down
the last few thousand feet:
I had a problem with the WCT toolkit (big difference between level2 and N0Q
basin values for 6/10/13) where I somehow confused the WCT's generation of the
KML location file, but while tracking the problem I also tried Level2 gage
locations as 4 nearest pixels. Nice idea but because I had zoomed the WCT
in on Charlotte, the 4 nearest image pixels were in the same level2 pixel.
I then tried Unzoomed and got 0.6 mile pixels and so gave up.
I have tried the 4 nearest N0Q pixels at a gage location for my Las Vegas
Valley study and that was shown to be a very bad idea. So it would appear
that the ideal radar pixel size is 0.6 miles, not 1.2 miles at
Vegas, and not 0.15 miles as will be shown here. Expecting to adjust a 4km
(2.4miles) NWS multi-sensor MPE rainfall product pixel with a single rain gage
would simply be ludicrous (that would take 16 rain gages for the pixel). I
guess you could use 16 N0Q adjusted radar pixels based on a single gage to
adjust a MPE product LOL!!! What in the world where they thinking with 4km
pixels. This is getting interesting... if you want the best radar estimate
of rainfall at a point, then the N0Q is better than Level2 and it is
its equal for areas. Prior to 2007 Level2 was equivalent to N0Q
resolution, then super high resolution was introduced for tornado velocity
detection.
N0Q was introduced in 2011. It would seem the NWS has indeed seen this
play out before. For 2007-2011 you can use Level2 but do not zoom and
check your pixel size is 0.6 miles if you are going to rain gage adjust it.
Another thing to think about is that based on the irratic hourly adjustments at
the 6 USGS rain gages is that 1-km radar point rainfall, contrary to the
current popular vouge, may be better suited for lumped runoff modeling than the
effort needed for gridded point distributed models. At the 30.5 sqmi basin size
and sub-divided 10 sqmi basin sizes here, these point rainfall errors seem to
get corrected much better basin wise than at the 6 tipping bucket points and
their average. See summary table of the Basin vs 6 gages above; %Diff 19%
vs 30% and %MAE 32% vs 40%. So I would do some experimenting on point rainfalls
with your area's available rainfall adjustments before thinking you can model a
shopping mall parking lot with radar.
Executive Summary: Aside from a few minor brain clots
getting started, I think engineers can follow all this and could actually do
better at this radar stuff than I with some motivation based on their actual
site and actually getting paid. I give you the tools so have at it and
questions are most welcome. And no, I have never met The King... yet.
If anyone would like a zip file of all the Microsoft Excel 2003 xls files that
automate generating all the above Gif graphs from the GetRealtime Access
database with just a click, send me an email.
Some additional page links about
ET and Nexrad Radar help and comparisons:
List of How To Videos on Youtube
Help Page for GetNexrad.exe
Nexrad Rainfall to Tipping Bucket Comparison
ET and Radar Rainfall along the Lower Colorado
River, AZ-CA
Nexrad Rainfall-Runoff Comparison Las Vegas
Valley, NV
Nexrad
Rainfall-Runoff Comparison San Jouqin Valley, CA
Nexrad
Rainfall-Runoff Comparisons in northwestern Arizona
Nexrad Snowfall Comparisons in western
central Sierras, CA
Weather Underground is a registered trademark of Weather
Underground, Inc www.wunderground.com

WEBSITE MAP


WU USGS USBR USCS CWRD NWS
More Free Downloads
Comments/Questions
Contact Me
Label
|