|
|
Well, my point rainfall comparisons with Wunderground gages
at times were a little less than hoped for.
A search of the online literature of comparisons seem to suggest caution as do my less than stellar
results. One more color of DBZ precision between 50 and 55 dbz wouldn't hurt. Perhaps a basin averaged Nexrad N0R every 5 minutes will demonstrate a
point is just a point and computed runoff will redeem Nexrad. Let’s find out.
I should point out that no experience with rainfall-runoff modeling is expected
of new users of my methods. Hopefully anyone with interest in this stuff
can follow my steps in setting up and maintaining a Nexrad radar rainfall and
runoff record in real-time. The only things I can think of where experience is a big
advantage is in calibration of runoff coefficients and routings. Everything else is pretty
much a cook book. Remember there is a comment/question link at the bottom of
each of my web pages if you have a question and suggestions are always welcome.
On the other hand... As an aside illistrative of modeling and modelers I can
tell you a story about theory and untheory. I worked for a couple years with a
guy at BOR who had worked for COE for many years who was a real fire brand. He
would say monkies could do PMF studies (probable max flood) about once a week...
usually on Mondays... to everyone's dismay. I always thought he was just a
little off until I started this realtime runoff stuff myself. Boy was he
right... Compared to these real world problems in real time, PMF's CAN be done
by monkies. ;) Hey Tom!
And remember what someone said about models, "they are never right." But that
does not mean they are not useful. If your model tells you anything, it will
tell you what can go wrong always does. Watch and learn that right here.
A basin was selected within the Las Vegas, NV urban area for the USGS
stream gage 094196781 Flamingo Wash at
Nellis Blvd. The basin is mostly developed housing and yards with about 30%
commercial and apartments I am guessing. Little undeveloped area remains within
the basin boundary as I have selected it. The total basin area is 215 square
miles but 3 quarters of it are undeveloped desert located on the back side of an
intervening mountain. Contribution from the desert area only occurs with high
intensity rainfall and is regulated by intervening runoff detention basins. I’ll
deal with crossing that bridge when I have to. For now, only the 50.7 square
mile urban area will be used.
***The following is pretty much outdated now. I now always digitize the
basin boundary in Lat/Long using GetMapArea or even Google Earth can be used.
Then use LatLongPixelsFromFile.exe to create the boundary file.***
Here are the steps required to set up
GetRealtime.exe to automate retrieval of
the Nexrad N0R radar average basin rainfall as described on the help page
here but in the particulars of example as
follows:
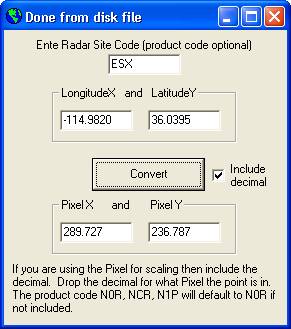
1) Radar ID= ESX.
2) Fire up GetMapArea's 'Google Map Lat/Long' menu item to determine
latitidude and longitude for points in Las Vegas Valley. Now find 2
intersections of the highways located within Vegas Valley that are located
roughly on a screen diagonal to enable determing both the X and Y scaling. 2
locations at about the same screen height would poorly determine the Y scaling
so choose 2 points on a diagonal. As an example my two highway intersections
have the long/lat locations -114.9820, 36.0395 and -115.2326, 36.2396.
3) Fire up LatLongPixels.exe to convert the long/lat locations to
radar image pixel locations:
Using GetMapArea.exe load a better map. As an example I used the menu
‘Load/Save Map’ then ‘Big Google Maps’ and zoomed into Vegas Valley in the
Terrain mode until both my scaling reference highway intersections were still
visible. Press Alt*PrtScr to capture
the Google Map to the Windows clipboard and close the Big Google Maps window. Select ‘Paste from Clipboard’ from
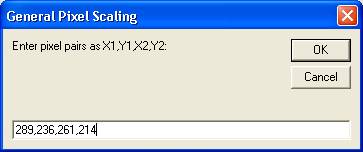
the menu and the map image will be loaded. Now set the scale by selecting ‘Set Scale’, click on the 2 highway
intersections, and select ‘General Pixels’ on the menu and enter the 2 pixel
locations.
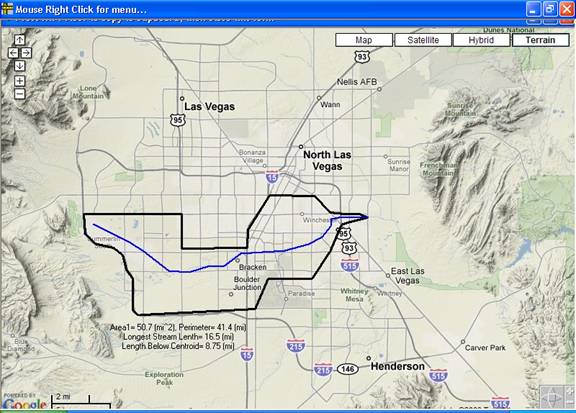
You can now start left click digitizing the basin boundary as pixels.
When finished right click and select 'End Area/Line' and then right click the
data box and save it to file
like this (add label is somewhere in here too):
Urbanized Flamingo Wash at Nellis Blvd X,Y Coordinates(pix)
280, 225
279, 224
277, 224
276, 224
274, 223
269, 223
267, 226
267, 227
260, 227
260, 225
249, 224
249, 226
250, 227
252, 227
253, 228
254, 229
254, 230
254, 233
255, 233
268, 233
269, 230
274, 230
276, 228
277, 225
280, 225
Xmin 249, Ymin 223, Xmax 280, Ymax 233
Area1= 167 (pix^2), Perimeter= 78.2 (pix), Centroid= 264, 229
With the basin Boundary pixel coordinate file we can now generate
the Point file that GetRealtime.exe will use to determine which radar image
pixels to average as being within the basin. Fire up
GetNexrad.exe, enter the file names and select ‘Create Basin Point File from
Boundary File’:
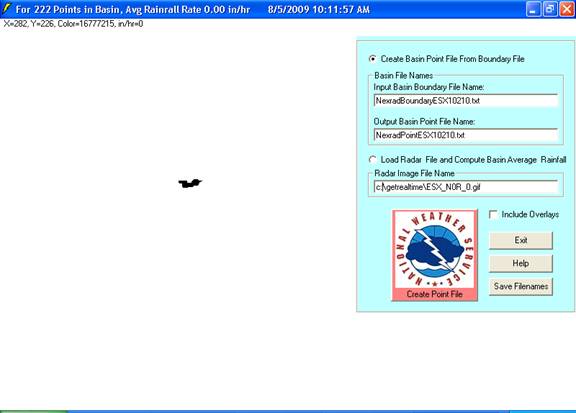
Example of the generated Point file: (note there is no title line)
249,223,280,233
0,0,0,0,0,0,0,0,0,0,0,0,0,0,0,0,0,0,0,0,1,1,1,1,1,1,1,0,0,0,0,0
1,1,1,1,1,1,0,0,0,0,0,0,0,0,0,0,0,0,0,1,1,1,1,1,1,1,1,1,1,1,1,0
1,1,1,1,1,1,1,1,1,1,1,1,0,0,0,0,0,0,0,1,1,1,1,1,1,1,1,1,1,1,1,1
1,1,1,1,1,1,1,1,1,1,1,1,0,0,0,0,0,0,1,1,1,1,1,1,1,1,1,1,1,0,0,0
0,1,1,1,1,1,1,1,1,1,1,1,1,1,1,1,1,1,1,1,1,1,1,1,1,1,1,1,0,0,0,0
0,0,0,0,1,1,1,1,1,1,1,1,1,1,1,1,1,1,1,1,1,1,1,1,1,1,1,1,0,0,0,0
0,0,0,0,0,1,1,1,1,1,1,1,1,1,1,1,1,1,1,1,1,1,1,1,1,1,1,0,0,0,0,0
0,0,0,0,0,1,1,1,1,1,1,1,1,1,1,1,1,1,1,1,1,1,1,1,1,1,0,0,0,0,0,0
0,0,0,0,0,1,1,1,1,1,1,1,1,1,1,1,1,1,1,1,1,0,0,0,0,0,0,0,0,0,0,0
0,0,0,0,0,1,1,1,1,1,1,1,1,1,1,1,1,1,1,1,0,0,0,0,0,0,0,0,0,0,0,0
0,0,0,0,0,1,1,1,1,1,1,1,1,1,1,1,1,1,1,1,0,0,0,0,0,0,0,0,0,0,0,0
Factoid: A pixel on the
ESX radar N0R image
is 0.00886 x 0.00886 degrees of long and lat or about 0.5 miles wide x 0.6
miles high. The current WSR-88D scan resolution is 1 degree in azimuth (0.5 mile
mid range) by 1 km (0.6 miles) in range. Update: The guys at
Nexrad are now in the process of making a higher resolution radar image available
(0.00532x0.00532 degrees, 0.37x0.37 mile, 1000x1000 pixel PNG image file) and
hopefully by
March, 2011 the Ridge II radar images will be operational, although in the
newer graphic format of PNG instead of GIF. Beta test versions of
GetRealtime.exe and GetNexrad.exe will soon be made available as the NOAA Ridge
II radar image test bed hopefully becomes more responsive to image requests.
With the Point file created we are all set to automate GetRealtime.exe radar
downloads.
Copy the Boundary and Point files to the GetRealtime.exe
directory. Fire up GetRealtime.exe and
select ‘Select Station from List’ and edit in our radar station and ID like
this:
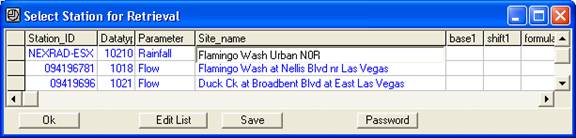
We now need to add the site to our HDB database. Fire up
GetAccess.exe and select the
‘DB Tables’ button and from the displayed list of tables select ‘rsite’, click
the ‘Allow Edit’ box , then hit the ‘Go’ button to display and edit in the new
site info like this:
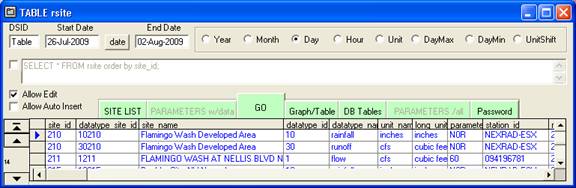
The datatype_id for rainfall is 10, the parameter_code is N0R with a zero, and
the station_id for retrieval is NEXRAD-ESX. Note that I combine the site_id 210 with the datatype_id 10 to give the
datatype_site_id 10210 entered here and used with the Boundary and Point file
naming convention.
GetRealtime.exe is now setup to automate the retrieval of our Vegas Valley basin averagedrainfall.
The next step is to determine runoff coefficients for automated
conversion of the rainfall to runoff. Also, don't forget to redigitize the
basin boundary in square mile scaling for runoff computation. Actually, I
have found it best to digitize the basin boundary using GetMapArea.exe first in
square miles and save the boundary image, THEN reload the saved image and
redigitize the basin boundary following its already shown boundary using the
general pixel method.
Creating a Boundary Area and Point File with GetMapArea.exe video:
Digitize Map Area and Stream Length with GetMapArea.exe video:
The art of runoff coefficient estimation: (if it fits, wear it) ;-)
1)
Wait for a runoff event to happen.
Could be awhile in the desert.
Bingo, we have our first recorded
runoff event and we have downloaded the USGS gage flow data for
Flamingo Wash
using GetRealtime.exe and stored it
and also our Nexrad basin averaged rainfall and we’re set to go.
2) Fire up GetAccess.exe and retrieve the Nexrad rainfall
as ‘Unit’ values which were stored every 5 minutes. We need to save these rainfall values
to Excel or text file and then create a GetMapArea storm file by pasting the
data into Notepad and saving to a stm file like this:
Flamingo Wash Urban Basin Nexrad N0R rainfall
57
0.083333
7/20/2009 21:05
0.00032
7/20/2009 21:10
0.00051
7/20/2009 21:15
0.00089
7/20/2009 21:20
0.00757
7/20/2009 21:25
0.0216
7/20/2009 21:30
0.03123
7/20/2009 21:35
0.01603
7/20/2009 21:40
0.01242
7/20/2009 21:45
0.01027
7/20/2009 21:50
0.00969
7/20/2009 21:55
0.01418
7/20/2009 22:00
0.01434
7/20/2009 22:05
0.01121…etc.
Download full storm file here.
This was cut from Excel and so is Tab delimited. See the GetMapArea help for other formats.
The 2nd title line shows there will be 57 data lines to read
and they have a time step of 0.083333 hours or 5 minutes. The date/time is not actually used by
GetMapArea so it is assumed the data is at a regular 5 minute interval.
Note: GetMapArea.exe can now read rainfall directly from the GetAccess.exe
HDB database so creation of the storm file is no longer needed. Simply select
'HDB Database' from the storm arrangement list.
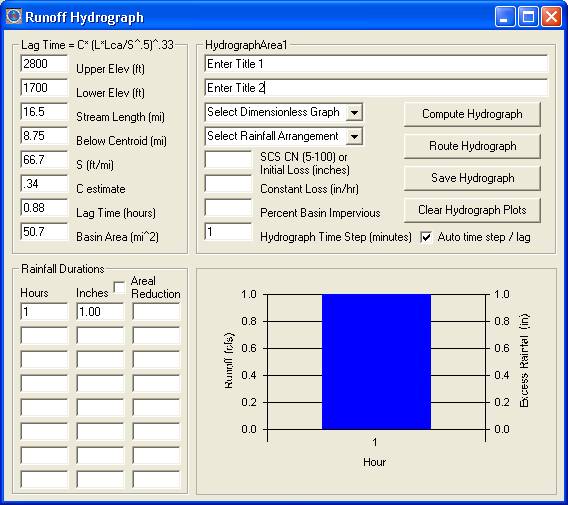
3) We now have our storm file. We need a hydrograph to visualize and
get its peak flow cfs and the event volume acre-feet. This we do using GetAccess.exe.
Retrieve the USGS Flamingo Wash
flow ‘Unit’ values. Save as Excel
and you have your graph at 15 minute intervals and peak flow cfs. To determine event volume average the
15 minute values. Take the average
cfs value and multiply it by 1.9835 then multiply it by the number of hours in
the event divided by 24. For a 6
hour event that averaged 50 cfs, the volume would be 50*1.9835*6/24 or 25
acre-feet. Knowing the peak flow and
volume we now have something to shoot for.
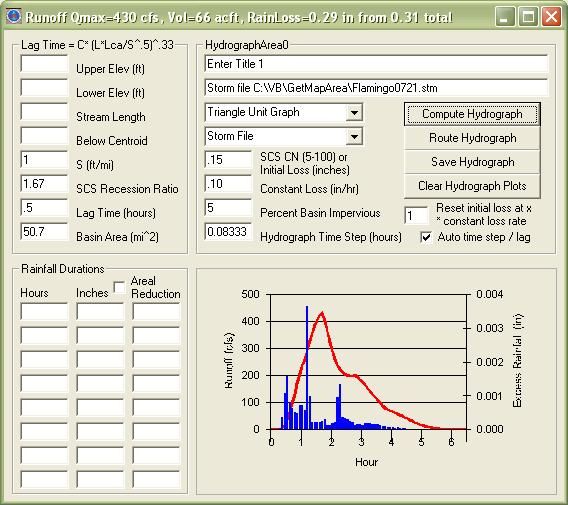
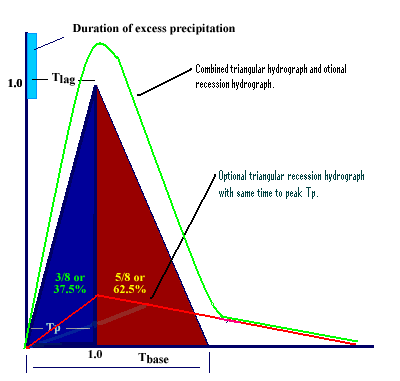
4) Fire up GetMapArea.exe and select ‘Runoff Hydrograph’.
Select Triangle Unit Graph for the
dimensionless graph as used by GetRealtime.exe.
The deceptively
simple
SCS triangle unit graph has the
following dimensions:
Timetopeak = (lag + udur / 2) / udur ...as time
steps
Timeofrecession = 1.67 * Timetopeak ...as time steps
Qpeak = 484 * area * excess / lag ...as cfs
Select 'Storm File' and play with the coefficients until you
get the right peak flow and volume as displayed on the window caption and the
hydrograph looks similar to the USGS recorded hydrograph in Excel. Note that the Lag is usually easily
determined from the peak rainfall to peak runoff on the USGS hydrograph…
USUALLY, what could go wrong?!! See
first comparison.
Note: For SCS Curve Number equivelants try 0.2 constant loss and vary the intial
loss.
5) After playing around for an hour or so we now have our
basin runoff coefficients required by GetRealtime.exe to automate computation of
runoff. Here is the Getrealtime.exe
setup showing the coefficients above:
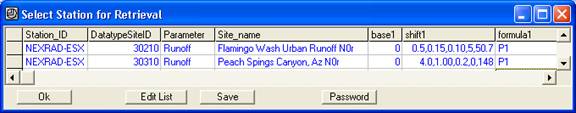
The shift1 cell contains our runoff coefficients separated by commas as Lag,
Initial Loss, Constant Loss, Percent Impervious, and Basin Area. Our HDB database needs the ‘rsite’
table setup for storing the computed runoff as shown above in the rainfall
setup. If you ever need to change
coefficients and rerun the runoff computations it’s as simple as changing the
coefficients and rerunning, either by number of past days or using the
‘Historical’ button on the GetRealtime.exe interface for just that time period.
Likewise, version 2.0.1 can also compute runoff using Station_ID= COMPUTE-Unit
like this:
COMPUTE-Unit; 30210; Runoff; Flamingo Wash Urban Runoff N0r; 0;
0.5,0.15,0.1,5,50.7; P1
The database table RSITE would have the Parameter_Code= 10210 and Station_Id=
COMPUTE.
We are now all set to automatically retrieve radar rainfall and USGS flows for
comparison so let's getr' done.... except you might want to consider how often
you want to run GetRealtime retrievals. Unless you're an
obsessive-compulsive radar freak like me, you can just wait for an event to
occur and then retrieve the past 4 hours of radar and take it from there.
You can then set GetRealtime.exe to get the radar every 5 minutes and watch the
fun using GetGraphs.exe. Or if you'ld rather be doing something else then
set GetRealtime to retrieve the Nexrad rainfall every 4 hours and check in every
few days to see what's up. Setting the retrieval interval to less than 15
minutes will only retrieve the current radar gif. With storm activity I find 15
minutes (or greater) seems to work well for me and assures not missing a radar
gif and eases demand on any other sources such as Wunderground on your retrieval
list.
If you have subdivided your basin into sub basins then you can use
GetGraphs.exe
to route and combine sub basin runoff for display using Modpul or Tatum's travel
time in real-time as the runoff is being downloaded and HDB updated every
5-minutes. Better yet, you can now use GetRealtime to do the complex
routings and save them in the Access HDB database for viewing. (see GetRealtime Help here)
For basins having significant indirect runoff and need
better definition of the recession then you may optionally add 2 additional
coefficients to describe the recession in addition to first Tp/Tr ratio as
described on GetRealtime's help page. Video example
Estimating Triangular Unit
Graph Coefficients with GetMapArea
Example of Estimating Basin Lag Time (if no USGS gage or has a broken clock):
One method of calculating basin lag time for ungaged basins as used by the USBR
as adapted from COE as adapted from Snyder is:
Lag Time = C*(L*Lca/S^0.5)^0.33.
Where:
C=26*K where K=Manning’s roughness for longest stream course.
L=length of longest stream course in miles.
Lca=length of stream course below basin centroid in miles.
S=slope of longest stream course in feet per mile.
Based on observed urban runoff events the USBR as found C to vary from 0.34 to
0.88. So based on the lower limit
for C of 0.34 we can estimate a likely lower limit to our Vegas Valley
basin lag time of 0.88 hours:
So much for the 0.5 hour lag time I used to get things to fit.
I will stick with 0.5 hours for now
until I have more information on each storms centering over the basin.
Something that could also be changed when using the Triangle Unit Graph method
is using a different Recession to Rising ratio that can be entered on the left
of GetMapArea as shown above. I did not change from the standard SCS 1.67
ratio but this may help the hydrograph shape somewhat. If you want
GetRealtime.exe to use a different ratio, then just add it to the coefficients
after the basin area in Shift1. Here are some
different ratios to try:
Hydrograph peaking factors and recession limb ratios (Wanielista, et al.
1997)
|
General Description
|
Peaking Factor
|
Limb Ratio
(Recession to Rising)
|
|
Urban areas; steep slopes
|
575
|
1.25
|
|
Typical SCS
|
484
|
1.67
|
|
Mixed urban/rural
|
400
|
2.25
|
|
Rural, rolling hills
|
300
|
3.33
|
|
Rural, slight slopes
|
200
|
5.5
|
|
Rural, very flat
|
100
|
12.0
|
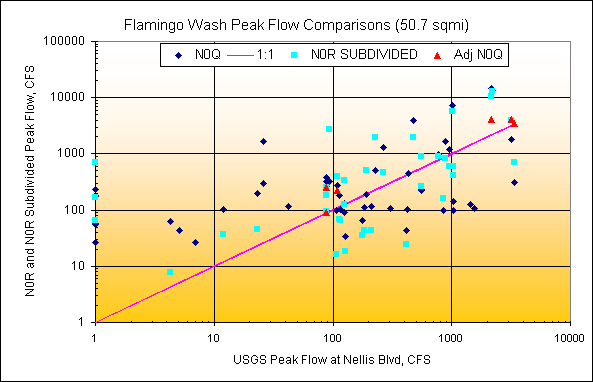
Runoff Comparison
Flamingo Wash
7/20/2009:
Lag Time = 0.5 hours
Basin Area = 50.7 mi^2
Loss0 = 0.15 inches
Loss = 0.10 in/hr
%Impervious = 5
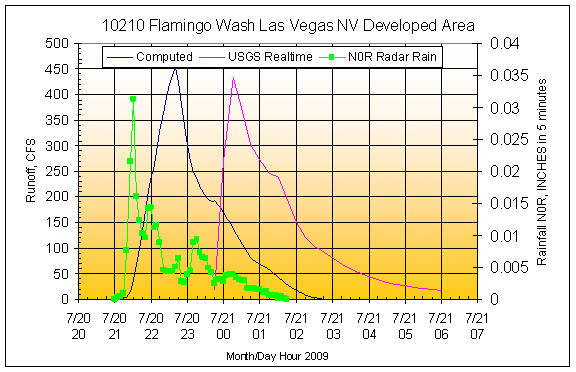
Well right off the bat the USGS cant figure out what time it is. It also turns out this gage is very
erratic in data availability so hopefully the USGS will fix their clock.
I just can’t catch a break in this
radar comparison stuff. ;-)
None the less, the peak and volume comparisons are good.
Flamingo Wash Urban Area Averaged Rainfall and Runoff
|
|
N0R
|
N0R
|
USGS
|
N0R
|
USGS
|
|
Date
|
Rain inches
|
Peak cfs
|
Peak cfs
|
acre-feet
|
acre-feet
|
|
7/20/2009
|
0.31
|
452
|
433
|
66
|
67
|
The next event will test the runoff assumptions for fitting different storms.
After further review...
The peak at the USGS gage Flamingo Wash at Nellis Blvd was recorded at
12:15 am and arrived at the USGS gage Flamingo at Confluence 0.96 miles
downstream at 12:45 am for a velocity of 3 feet/second which seems ok for 400
cfs in a cobble and gravel channel. It appears the USGS clocks are probably ok.
My apologies to the USGS. Now what???
My background comes from computing Probable Maximum Floods for basins like
Hoover Dam so any assistance here is welcome. On the other hand my methods
here have improved early warning by 2 hours!!! ;-) Easily worth the price
of admission. Who can compete with these results!
(Since no one has offered any comments, I will offer this... the answer to
my time anomally lies in sub-dividing the basin into areas of excess rainfall
and routing... but the runoff volume will remain about the same and the
hydrograph routing will fix the time of arrival at the gage. So no fix is
actually needed. As you were... All is well... I hope!)
Clark County maintains a network
of precip gages through out the county of which these are located on the
Flamingo Wash stream course and are listed here at the indicated mile to help define the storm
distribution and verify radar reported rainfall:
|
Clark County Flood District
Tipping Bucket Precip
|
|
|
|
|
|
Inches
|
Mile16.8
|
Mile 14.0
|
Mile 10.7
|
Mile9.2
|
Mile 5.5
|
Mile 3.8
|
Mile 2.6
|
Mile 0.0
|
|
Date
|
TownCtr
|
TheLakes
|
TorreyPines
|
Decatur
|
Swenson
|
Eastern
|
Mojave
|
Nellis
|
|
7/20/2009
|
0.08
|
0
|
0.08
|
0.42
|
---
|
0.35
|
0.12
|
0.04
|
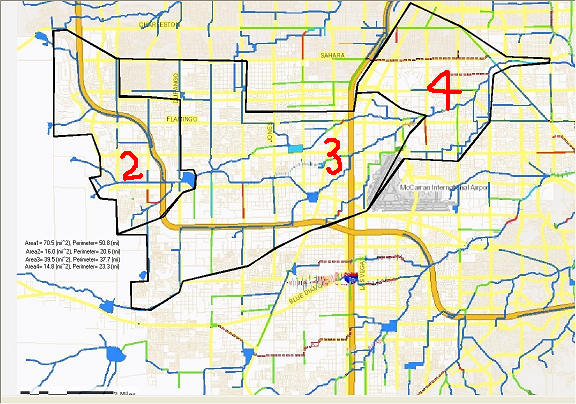
Beginning July 3, 2011, the urbanized area was expanded to include the area west
and south of the Beltway for a total basin area of 70.3 sqmi. The
subdivided areas are Area 2 (16.0 sqmi) above Flamingo Detention Basin, Area 3
(39.5 sqmi) below FDB to Maryland Pkwy, and Area 4 (14.8 sqmi) as Maryland Pkwy
to Nellis Blvd. Subbasin 2 was Mod Puls routed through the Flamingo Detention
Basin, and then channel Mod Puls routed to Maryland Parkwy and combined with
Area 3... then channel Mod Puls routed to Nellis Blvd and combined with Area 4
for total runoff at Nellis Blvd.
GetRealtime_setup.txt:
NEXRAD-ESX; 30210; Runoff; Flamingo Wash Urban; 0;
1.5,0.25,0.20,5,70.3,0.4,0.04,0.5,1.5,0.2,3; P1
NEXRAD-ESX; 30209; Runoff; Flamingo abv FDB; 0;
0.25,0.30,0.25,45,16.0,0.4,0.04,0.5,1.5,0.2,3; P1
NEXRAD-ESX; 30212; Runoff; Flamingo abv M Pkwy; 0;
0.5,0.30,0.25,5,39.5,0.4,0.04,0.5,1.5,0.2,3; P1
NEXRAD-ESX; 30213; Runoff; Flamingo blw MPkwy; 0;
0.5,0.30,0.25,5,14.8,0.4,0.04,0.5,1.5,0.2,3; P1
ROUTE; 1214; Flow; Routed Flamingo Wash at Nellis, Blvd Nv
MyRoutingFile.txt:
Three subbasins on Flamingo Wash Las Vegas Valley
GET 4 30209 Upper West Flamingo
#2
ROUTE Modpul RatingFlamingoDetentionBasin.RAT (2 or more here means
cascading modpul routing)
ROUTE Modpul Flamingo.Rat
(0.01 to 1.99 here means adjust storage by value*storage)
GET 4 30212 Middle Flamingo #3
COMBINE
ROUTE Modpul Flamingo.Rat reuse same channel rating
GET 4 30213
Lower Flamingo #4
COMBINE
END
MyDetentionModPul.txt:
Flamingo Detention Basin ModPul Rating (Elv, Flow cfs, Storage AcFt)
7
<<lines below to read tab seperated
0 0 0
5 300 25
10 700 100
15 900 300
20 1200 500
25 1350 1000
30 31500 1500
MyChannelModPul.txt:
Flamingo Channel ModPul 8 miles w=40' side 2:1 s=60'/mi n=.03
15 << lines below(stage, cfs, acft)
0 0 0
.2 14.5 7.84
.4 46.0 15.8
.6 90.7 24
.8 146.8 32.3
1 213.5 40.7
1.4 376 58.1
1.8 575 76.1
2 687 85.3
2.6 1074 114
3 1372 134
4 2255 186
5 3331 242
6 4601 303
6.4 5164 328
Now we are getting the essence of a recession going, not sure why the USGS gage
is stuck in the mud at this party.
Ok, Let's have just the facts of this matter:
The results below come from continuous rainfall runoff modeling in real-time so
once the model parameters are set in the GetRealtime.exe setup the real-time
results are on their own until/if parameters are changed (initial loss, costant
loss, % impervious, recession ratio). Only the initial loss is self
adjusting.
Runoff Comparison Flamingo Wash:
No change to runoff coefficients were made until 3-Jul-2011.
|
Flamingo Wash Urban Area Averaged Rainfall and Runoff |
|
|
SubDivide |
SubDivide |
|
|
N0R |
Tipping |
N0R |
USGS |
N0R |
USGS |
N0R |
N0R |
|
Date |
Rain in |
Rain in |
Peak cfs |
Peak cfs |
acre-feet |
acre-feet |
Peak cfs |
acre-feet |
|
7/20/2009 |
0.31 |
0.16 |
452 |
433 |
66 |
67 |
|
|
|
7/22/2009 |
0.06 |
0.02 |
115 |
42 |
10 |
7 |
|
|
|
8/6/2009 |
0.02 |
0.00 |
43 |
5.1 |
4 |
0 |
|
|
|
8/22/2009 |
0.04 |
0.00 |
57 |
1 |
6 |
0 |
|
|
|
8/23/2009 |
0.02 |
0.00 |
26 |
1 |
3 |
0 |
|
|
|
9/4/2009 |
0.21 |
0.10 |
1660 |
26 |
118 |
2.1 |
|
|
|
revised9/4 |
0.15 |
0.10 |
302 |
26 |
24 |
2.1 |
|
|
|
12/7/2009 |
0.2 |
0.30 |
108 |
305 |
33 |
86 |
|
|
|
12/12/2009 |
0.06 |
0.03 |
56 |
1 |
9 |
0 |
|
|
|
12/13/2009 |
0.04 |
0.03 |
26 |
7 |
2 |
2 |
|
|
|
1/19/2010 |
0.13 |
0.43 |
126 |
1440 |
20 |
200 |
|
|
|
1/20/2010 |
0.24 |
0.30 |
104 |
423 |
38 |
119 |
|
|
|
1/21/2010 |
0.26 |
0.93 |
105 |
1540 |
39 |
772 |
|
|
|
1/27/2010 |
0.61 |
0.41 |
1320 |
265 |
203 |
201 |
475 |
278 |
|
2/5/2010 |
0.17 |
0.03 |
180 |
1 |
28 |
2 |
66 |
20 |
|
2/6/2010 |
0.47 |
0.35 |
3980 |
478 |
531 |
125 |
1930 |
303 |
|
2/9/2010 |
0.14 |
0.29 |
66 |
177 |
22 |
104 |
36 |
21 |
|
2/22/2010 |
0.15 |
0.18 |
115 |
209 |
24 |
37 |
43 |
12 |
|
2/24/2010 |
0.04 |
0.01 |
62 |
4.3 |
7 |
1 |
7.6 |
3 |
|
2/27/2010 |
0.09 |
0.11 |
34 |
128 |
15 |
45 |
18 |
7 |
|
3/7/2010 |
0.16 |
0.27 |
110 |
183 |
26 |
108 |
44 |
17 |
|
4/22/2010 |
0.05 |
0.10 |
44 |
415 |
7 |
50 |
24 |
9 |
|
8/8/2010 |
0.13 |
0.03 |
194 |
23 |
20 |
5 |
45 |
20 |
|
9/7/2010 |
0.08 |
0.03 |
102 |
12 |
14 |
15 |
37 |
16 |
|
10/2/2010 |
0.09 |
0.04 |
182 |
113 |
14 |
18 |
69 |
12 |
|
10/17/2010 |
0.16 |
0.11 |
104 |
116 |
24 |
36 |
64 |
18 |
|
10/18/2010 |
0.07 |
0.10 |
98 |
108 |
11 |
43 |
16 |
10 |
|
10/19/2010 |
0.17 |
0.06 |
322 |
88 |
27 |
18 |
179 |
28 |
|
10/20/2010 |
0.13 |
0.15 |
189 |
193 |
21 |
53 |
503 |
48 |
|
10/20 PM |
0.45 |
0.29 |
1180 |
957 |
130 |
325 |
586 |
128 |
|
12/20/2010 |
0.41 |
0.52 |
1630 |
879 |
186 |
502 |
817 |
162 |
|
12/22 AM |
1.75 |
1.01 |
13390 |
2210 |
3240 |
943 |
13110 |
3205 |
|
12/22 PM |
0.42 |
0.22 |
7160 |
1020 |
660 |
537 |
5680 |
775 |
|
New Coeffs: Unsubdivided 1.5,0.25,0.20,5,70.3,0.4,0.04,0.5,1.5,0.2,3 Subdivided
0.5,0.3,0.25,5 A=16.0, 39.5 and 14.8 |
|
7/3/2011 |
0.22 |
0.22 |
234 |
560 |
44 |
76 |
892 |
108 |
|
7/9/2011 |
0.41 |
0.11 |
975 |
772 |
190 |
133 |
904 |
300 |
|
9/11/2011 |
0.3 |
0.07 |
226 |
555 |
60 |
96 |
263 |
160 |
|
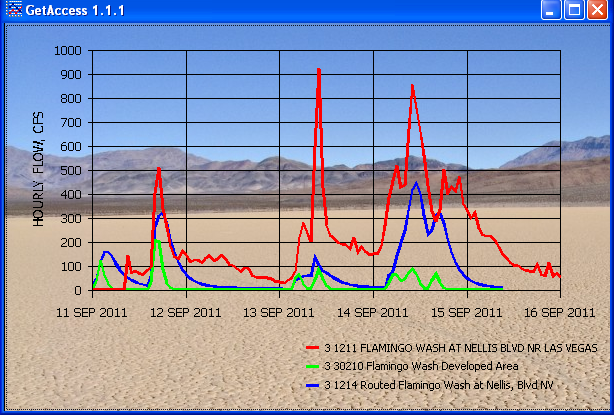
9/13/2011 |
0.15 |
0.09 |
98 |
854 |
30 |
81 |
164 |
84 |
|
9/14/2011 |
0.3 |
0.34 |
97 |
1030 |
60 |
324 |
413 |
358 |
|
9/14 Level2 |
0.33 |
0.34 |
140 |
1030 |
66 |
324 |
588 |
450 |
|
9/24/2011 |
0.1 |
0.03 |
89 |
125 |
20 |
84 |
126 |
25 |
|
9/24 Level2 |
0.14 |
0.03 |
132 |
125 |
42 |
84 |
331 |
41 |
|
10/3/2011 |
0.33 |
0.27 |
497 |
230 |
142 |
103 |
1990 |
308 |
|
Start N0Q |
N0Q |
Tipping |
N0Q |
|
N0Q |
|
N0Q |
N0Q |
|
11/30/2011 |
0.25 |
0.00 |
174 |
1 |
82 |
1 |
167 |
140 |
|
12/1/2011 |
1.31 |
0.00 |
236 |
1 |
274 |
1 |
694 |
950 |
|
7/23/2012 |
0.23 |
0.02 |
319 |
93 |
62 |
44 |
2770 |
416 |
|
8/1/2012 |
0.44 |
0.32 |
272 |
109 |
104 |
104 |
392 |
282 |
|
8/22/2012 |
0.73 |
1.27 |
309 |
3400 |
164 |
580 |
702 |
656 |
|
9/11/2012 |
0.52 |
0.83 |
1770 |
3200 |
320 |
486 |
3960 |
440 |
|
10/11/2012 |
2.8 |
1.22 |
14400 |
2170 |
4400 |
1110 |
10700 |
5820 |
|
12/13/2012 |
0.64 |
0.18 |
374 |
89 |
Sub w/adust rain>> |
93 |
|
|
1/26/2013 |
0.35 |
0.36 |
261 |
89 |
Sub w/adust rain>> |
251 |
|
|
|
|
|
|
|
|
|
|
|
|
Clark County Flood District Tipping Bucket |
|
|
|
|
|
|
Inches |
Mile16.8 |
Mile 14.0 |
Mile 10.7 |
Mile9.2 |
Mile 5.5 |
Mile 3.8 |
Mile 2.6 |
Mile 0.0 |
|
Date |
TownCtr |
TheLakes |
TorreyPines |
Decatur |
Svenson |
Eastern |
Mojave |
Nellis |
|
7/20/2009 |
0.08 |
0 |
0.08 |
0.42 |
--- |
0.35 |
0.12 |
0.04 |
|
7/22/2009 |
0 |
0 |
0 |
0.05 |
0 |
0.08 |
0 |
0 |
|
8/6/2009 |
0 |
0 |
0 |
0 |
0 |
0 |
0 |
0 |
|
8/22/2009 |
0 |
0 |
0 |
0.03 |
0 |
0 |
0 |
0 |
|
8/23/2009 |
0 |
0 |
0 |
0 |
0 |
0 |
0 |
0 |
|
9/4/2009 |
0.59 |
0.08 |
0 |
0.01 |
0 |
0.04 |
0.04 |
0 |
|
12/7/2009 |
0.28 |
0.31 |
0.31 |
0.27 |
0.28 |
0.35 |
0.31 |
0.31 |
|
12/12/2009 |
0.04 |
0.04 |
0 |
0 |
0.04 |
0.04 |
0.04 |
0 |
|
12/13/2009 |
0.16 |
0.04 |
0.04 |
0.02 |
0 |
0 |
0 |
0 |
|
1/19/2010 |
0.27 |
0.27 |
|
0.39 |
0.47 |
0.55 |
0.55 |
0.51 |
|
1/20/2010 |
0.4 |
0.2 |
0.28 |
0.26 |
0.43 |
0.35 |
0.28 |
0.23 |
|
1/21/2010 |
1.02 |
0.87 |
0.86 |
0.85 |
0.87 |
1.11 |
0.86 |
1.03 |
|
1/27/2010 |
0.43 |
0.35 |
0.55 |
0.43 |
0.28 |
0.47 |
0.39 |
0.39 |
|
2/5/2010 |
0.04 |
0.04 |
0 |
0.01 |
0 |
0.04 |
0.04 |
0.04 |
|
2/6/2010 |
0.27 |
0.31 |
0.35 |
0.3 |
0.35 |
0.43 |
0.35 |
0.43 |
|
2/9/2010 |
0.39 |
0.35 |
0.31 |
0.24 |
0.2 |
0.32 |
0.2 |
0.31 |
|
2/22/2010 |
0.08 |
0.08 |
0.12 |
0.11 |
0.2 |
0.31 |
0.28 |
0.28 |
|
2/24/2010 |
0.04 |
0 |
0 |
0 |
0 |
0 |
0 |
0 |
|
2/27/2010 |
0.16 |
0.16 |
0.16 |
0.14 |
0.08 |
0.08 |
0.04 |
0.04 |
|
3/7/2010 |
0.28 |
0.2 |
0.16 |
0.11 |
0.2 |
0.44 |
0.35 |
0.39 |
|
4/22/2010 |
0 |
0 |
0 |
0 |
0.43 |
0.16 |
0.16 |
0.02 |
|
8/8/2010 |
0 |
0 |
0.04 |
0.04 |
0.04 |
0 |
0 |
0.08 |
|
9/7/2010 |
0.08 |
0.08 |
0.04 |
0.06 |
0 |
0 |
0 |
0 |
|
10/2/2010 |
0 |
0 |
0.04 |
0.01 |
0.24 |
0 |
0 |
0 |
|
10/17/2010 |
0.24 |
0.08 |
0.04 |
0.04 |
0.12 |
0.16 |
0.12 |
0.04 |
|
10/18/2010 |
0.19 |
0.31 |
0.12 |
0.06 |
0.04 |
0.04 |
0.04 |
0 |
|
10/19/2010 |
0.04 |
0.08 |
0.08 |
0.08 |
0.16 |
0 |
0 |
0 |
|
10/20/2010 |
0.08 |
0.04 |
0.04 |
0.04 |
0.16 |
0.35 |
0.28 |
0.24 |
|
10/20 PM |
0.31 |
0.31 |
0.51 |
0.22 |
0.23 |
0.28 |
0.23 |
0.19 |
|
12/20/2010 |
0.67 |
0.75 |
0.55 |
0.41 |
0.39 |
0.46 |
0.39 |
0.51 |
|
12/22 AM |
1.11 |
1.02 |
0.95 |
0.97 |
0.87 |
1.1 |
0.87 |
1.18 |
|
12/22 PM |
0.23 |
0.2 |
0.23 |
0.17 |
0.2 |
0.24 |
0.2 |
0.27 |
|
7/3/2011 |
0 |
0 |
0 |
|
0.35 |
0.04 |
0.31 |
0.86 |
|
7/9/2011 |
0 |
0.04 |
0.16 |
|
0.35 |
0.12 |
0.12 |
0 |
|
9/11/2011 |
0.08 |
0.04 |
0.24 |
|
0.12 |
0 |
0 |
0 |
|
9/13/2011 |
0.04 |
0.08 |
0.07 |
|
0.08 |
0 |
0.12 |
0.24 |
|
9/14/2011 |
0.71 |
0.67 |
0.52 |
|
0.19 |
0 |
0.23 |
0.04 |
|
9/14same |
0.71 |
0.67 |
0.52 |
|
0.19 |
0 |
0.23 |
0.04 |
|
9/24/2011 |
0 |
0 |
0 |
|
0.12 |
0 |
0.08 |
0 |
|
9/24/same |
0 |
0 |
0 |
|
0.12 |
0 |
0.08 |
0 |
|
10/3/2011 |
0.04 |
0.04 |
0.16 |
|
0.08 |
0.55 |
0.79 |
0.2 |
|
Start N0Q |
|
|
|
|
|
|
|
|
|
11/30/2011 |
0 |
0 |
0 |
|
0 |
0 |
0 |
0 |
|
12/1/2011 |
0 |
0 |
0 |
|
0 |
0 |
0 |
0 |
|
7/23/2012 |
0 |
0 |
0.16 |
0 |
0 |
0 |
0 |
0 |
|
8/1/2012 |
0.35 |
0.31 |
0.35 |
0.07 |
0.24 |
0.51 |
0.31 |
0.39 |
|
8/22/2012 |
0.59 |
0.63 |
1.14 |
1.18 |
1.1 |
1.43 |
1.1 |
2.95 |
|
9/11/2012 |
0.31 |
0.31 |
0.59 |
0.51 |
1.93 |
1.54 |
1.22 |
0.2 |
|
10/11/2012 |
1.65 |
2.01 |
1.85 |
0.75 |
1.06 |
1.42 |
0.75 |
0.27 |
|
12/13/2012 |
0.1 |
0.12 |
0.18 |
|
0.24 |
0.3 |
0.28 |
0.06 |
|
1/26/2013 |
0.35 |
0.39 |
0.39 |
0.35 |
0.35 |
0.43 |
0.35 |
0.28 |
|
|
|
|
|
|
|
|
|
|
|
Nexrad N0R Radar Image Pixel Precip |
|
|
|
|
|
|
Inches |
Mile16.8 |
Mile 14.0 |
Mile 10.7 |
Mile9.2 |
Mile 5.5 |
Mile 3.8 |
Mile 2.6 |
Mile 0.0 |
|
Date |
TownCtr |
TheLakes |
TorreyPines |
Decatur |
Svenson |
Eastern |
Mojave |
Nellis |
|
7/20/2009 |
--- |
--- |
--- |
--- |
--- |
--- |
--- |
--- |
|
7/22/2009 |
--- |
--- |
--- |
--- |
--- |
--- |
--- |
--- |
|
8/6/2009 |
--- |
--- |
--- |
--- |
--- |
--- |
--- |
--- |
|
8/22/2009 |
0.07 |
0.06 |
0.04 |
0.02 |
0.03 |
0.01 |
0.01 |
0.02 |
|
8/23/2009 |
0 |
0.01 |
0.11 |
0.04 |
0.01 |
0.02 |
0.01 |
0.01 |
|
9/4/2009 |
0.32 |
0.36 |
0.04 |
0.02 |
0.06 |
0.14 |
0.17 |
0.02 |
|
12/7/2009 |
0.25 |
0.26 |
0.22 |
0.19 |
0.16 |
0.17 |
0.17 |
0.16 |
|
12/12/2009 |
0.08 |
0.04 |
0.03 |
0.06 |
0.08 |
0.07 |
0.08 |
0.06 |
|
12/13/2009 |
0.06 |
0.06 |
0.04 |
0.04 |
0.03 |
0.03 |
0.02 |
0.02 |
|
1/19/2010 |
0.05 |
0.09 |
0.11 |
0.12 |
0.23 |
0.18 |
0.19 |
0.18 |
|
1/20/2010 |
0.23 |
0.22 |
0.22 |
0.25 |
0.26 |
0.27 |
0.28 |
0.26 |
|
1/21/2010 |
0.29 |
0.25 |
0.26 |
0.26 |
0.29 |
0.29 |
0.27 |
0.33 |
|
1/27/2010 |
0.43 |
0.41 |
0.75 |
0.81 |
0.58 |
0.52 |
0.55 |
0.56 |
|
2/5/2010 |
0.24 |
0.22 |
0.13 |
0.13 |
0.15 |
0.19 |
0.16 |
0.24 |
|
2/6/2010 |
0.28 |
0.44 |
0.55 |
0.46 |
0.42 |
0.37 |
0.47 |
0.38 |
|
2/9/2010 |
0.13 |
0.15 |
0.13 |
0.13 |
0.12 |
0.15 |
0.18 |
0.23 |
|
2/22/2010 |
0.15 |
0.15 |
0.14 |
0.16 |
0.15 |
0.17 |
0.17 |
0.14 |
|
2/24/2010 |
0.06 |
0.03 |
0.02 |
0.02 |
0 |
0 |
0 |
0.02 |
|
2/27/2010 |
0.08 |
0.09 |
0.11 |
0.11 |
0.12 |
0.09 |
0.07 |
0.08 |
|
3/7/2010 |
0.08 |
0.11 |
0.12 |
0.1 |
0.18 |
0.33 |
0.28 |
0.22 |
|
4/22/2010 |
0.03 |
0.02 |
0.02 |
0.03 |
0.11 |
0.08 |
0.11 |
0.02 |
|
8/8/2010 |
0.01 |
0.01 |
0.07 |
0.09 |
0.12 |
0.1 |
0.04 |
0.03 |
|
9/7/2010 |
0.13 |
0.12 |
0.19 |
0.12 |
0.08 |
0.07 |
0.05 |
0.03 |
|
10/2/2010 |
0 |
0 |
0.11 |
0.04 |
0.2 |
0.05 |
0.01 |
0 |
|
10/17/2010 |
0.24 |
0.16 |
0.1 |
0.05 |
0.24 |
0.22 |
0.16 |
0.09 |
|
10/18/2010 |
0.12 |
0.26 |
0.15 |
0.04 |
0.01 |
0.01 |
0.01 |
0.02 |
|
10/19/2010 |
0.25 |
0.27 |
0.1 |
0.2 |
0.34 |
0.09 |
0.04 |
0.01 |
|
10/20/2010 |
0.09 |
0.09 |
0.06 |
0.06 |
0.27 |
0.25 |
0.25 |
0.35 |
|
10/20 PM |
0.92 |
0.53 |
0.47 |
0.27 |
0.27 |
0.23 |
0.22 |
0.3 |
|
12/20/2010 |
0.7 |
0.54 |
0.42 |
0.35 |
0.21 |
0.27 |
0.28 |
0.27 |
|
12/22 AM |
1.62 |
1.88 |
1.8 |
1.83 |
1.84 |
2.1 |
1.79 |
1.94 |
|
12/22 PM |
0.29 |
0.31 |
0.33 |
0.33 |
0.45 |
0.44 |
0.43 |
0.46 |
|
7/3/2011 |
0 |
0.01 |
0.01 |
0.18 |
0.34 |
0.27 |
0.23 |
0.58 |
|
7/9/2011 |
0.06 |
0.06 |
0.17 |
1.04 |
0.43 |
0.09 |
0.17 |
0.02 |
|
9/11/2011 |
0.5 |
0.16 |
0.68 |
0.36 |
0.14 |
0.05 |
0.04 |
0 |
|
9/13/2011 |
0.06 |
0.08 |
0.09 |
0.38 |
0.17 |
0.32 |
0.1 |
0.25 |
|
9/14/2011 |
0.43 |
0.48 |
0.35 |
0.34 |
0.09 |
0.16 |
0.19 |
0.03 |
|
9/14 Level2 |
0.56 |
0.63 |
0.35 |
0.37 |
0.09 |
0.16 |
0.19 |
0.03 |
|
9/24/2011 |
0.01 |
0.08 |
0.04 |
0.05 |
0.3 |
0.72 |
0.33 |
0.01 |
|
9/24 Level2 |
0.01 |
0.08 |
0.07 |
0.05 |
0.42 |
1.62 |
0.72 |
0.01 |
|
10/3/2011 |
0.15 |
0.12 |
0.06 |
0.43 |
0.2 |
1.29 |
1.62 |
0.62 |
|
Start N0Q |
N0Q |
N0Q |
N0Q |
N0Q |
N0Q |
N0Q |
N0Q |
N0Q |
|
11/30/2011 |
0.14 |
0.15 |
0.34 |
0.44 |
0.38 |
0.27 |
0.24 |
0.24 |
|
12/1/2011 |
1.41 |
1.35 |
1.47 |
1.42 |
1.13 |
0.9 |
0.81 |
0.65 |
|
7/23/2012 |
0 |
0 |
0.44 |
0.23 |
0 |
0.02 |
0.01 |
0 |
|
8/1/2012 |
0.61 |
0.55 |
0.55 |
0.52 |
0.37 |
0.51 |
0.39 |
0.24 |
|
8/22/2012 |
0.52 |
0.28 |
0.64 |
0.84 |
1.11 |
0.77 |
0.86 |
1.1 |
|
9/11/2012 |
0.2 |
0.21 |
0.22 |
0.31 |
0.8 |
0.69 |
0.75 |
0.41 |
|
10/11/2012 |
2.09 |
4.00 |
3.02 |
2.81 |
3.16 |
2.00 |
1.81 |
2.53 |
|
12/13/2012 |
0.19 |
0.26 |
0.45 |
0.72 |
1.16 |
1.25 |
1.25 |
1.54 |
|
1/26/2013 |
0.75 |
0.55 |
0.40 |
0.41 |
0.37 |
0.39 |
0.38 |
0.38 |
|
|
|
|
|
|
|
|
|
|
|
% Diff |
21% |
41% |
34% |
20% |
38% |
35% |
38% |
26% |
|
MAE% |
99% |
92% |
70% |
115% |
79% |
93% |
82% |
187% |
|
|
|
|
|
|
|
|
|
|
|
2 of 3 Wunderground Tipping Buckets Used for Hourly Corrections (daily ratios
shown here) |
|
|
Inches |
Mile ~11 |
N0Q |
gage/radar |
|
Mile ~0 |
N0Q |
gage/radar |
|
|
Date |
KNVLASVE71 |
at Gage |
Ratio |
|
KNVLASVE25 |
at Gage |
Ratio |
|
|
8/1/2012 |
0.39 |
0.17 |
2.29 |
|
0.29 |
0.09 |
3.22 |
|
|
8/22/2012 |
0.89 |
0.61 |
1.46 |
|
1.74 |
0.91 |
1.91 |
|
|
9/11/2012 |
0.57 |
0.33 |
1.73 |
|
0.67 |
0.43 |
1.56 |
|
|
10/11/2012 |
1.43 |
2.65 |
0.54 |
|
0.81 |
1.2 |
0.68 |
|
|
12/13/2012 |
0.17 |
0.44 |
0.39 |
|
0.3 |
1.55 |
0.19 |
|
|
1/26/2013 |
0.31 |
0.41 |
0.76 |
|
0.36 |
0.34 |
1.06 |
|
|
|
|
|
|
|
|
|
|
|
|
Corrected Hourly 5-minute Radar at Clark County Flood District Tipping Bucket |
|
|
|
Inches |
Mile16.8 |
Mile 14.0 |
Mile 10.7 |
Mile9.2 |
Mile 5.5 |
Mile 3.8 |
Mile 2.6 |
Mile 0.0 |
|
Date |
TownCtr |
TheLakes |
TorreyPines |
Decatur |
Svenson |
Eastern |
Mojave |
Nellis |
|
8/1/2012 |
0.49 |
0.4 |
0.41 |
0.38 |
0.3 |
0.45 |
0.62 |
0.37 |
|
8/22/2012 |
0.62 |
0.47 |
0.99 |
1.11 |
1.61 |
1.09 |
1.46 |
2.16 |
|
9/11/2012 |
0.34 |
0.37 |
0.35 |
0.55 |
1.08 |
1.02 |
1.16 |
0.78 |
|
10/11/2012 |
1.47 |
2.12 |
1.78 |
1.7 |
1.62 |
1.14 |
1.29 |
1.48 |
|
12/13/2012 |
0.08 |
0.11 |
0.17 |
0.28 |
0.32 |
0.35 |
0.3 |
0.33 |
|
1/26/2013 |
0.5 |
0.38 |
0.32 |
0.3 |
0.39 |
0.44 |
0.4 |
0.44 |
|
|
|
|
|
|
|
|
|
|
|
% Diff |
4% |
2% |
-11% |
51% |
8% |
-20% |
30% |
34% |
|
MAE% |
17% |
18% |
16% |
146% |
40% |
21% |
43% |
244% |
|
|
|
|
|
|
|
|
|
|
|
% Difference Corrected Hourly 5-minute Radar at Clark County Flood District
Tipping Bucket |
|
|
Inches |
Mile16.8 |
Mile 14.0 |
Mile 10.7 |
Mile9.2 |
Mile 5.5 |
Mile 3.8 |
Mile 2.6 |
Mile 0.0 |
|
Date |
TownCtr |
TheLakes |
TorreyPines |
Decatur |
Svenson |
Eastern |
Mojave |
Nellis |
|
8/1/2012 |
40% |
29% |
17% |
443% |
25% |
-12% |
100% |
-5% |
|
8/22/2012 |
5% |
-25% |
-13% |
-6% |
46% |
-24% |
33% |
-27% |
|
9/11/2012 |
10% |
19% |
-41% |
8% |
-44% |
-34% |
-5% |
290% |
|
10/11/2012 |
-11% |
5% |
-4% |
127% |
53% |
-20% |
72% |
448% |
|
12/13/2012 |
-20% |
-8% |
-6% |
|
33% |
17% |
7% |
450% |
|
1/26/2013 |
43% |
-3% |
-18% |
-14% |
11% |
2% |
14% |
57% |
|
|
|
|
|
|
|
|
|
|
|
Flamingo Wash Urban Area Basin Averaged Rainfall and Runoff |
|
|
|
|
|
|
Unadj N0Q |
Adj N0Q |
Tipping |
Unadj N0Q |
Adj N0Q |
Adj N0Q |
Unadj N0Q |
Adj N0Q |
|
Date |
Rain in |
Rain in |
Rain in |
%Diff |
%Diff |
Peak cfs |
Peak%Diff |
Peak%Diff |
|
8/1/2012 |
0.44 |
0.27 |
0.32 |
38% |
-16% |
220 |
150% |
102% |
|
8/22/2012 |
0.73 |
1.12 |
1.27 |
-43% |
-12% |
3470 |
-91% |
2% |
|
9/11/2012 |
0.52 |
0.76 |
0.83 |
-37% |
-8% |
4020 |
-45% |
26% |
|
10/11/2012 |
2.8 |
1.59 |
1.22 |
130% |
30% |
4100 |
564% |
89% |
|
12/13/2012 |
0.64 |
0.17 |
0.18 |
256% |
-6% |
91 |
320% |
2% |
|
1/26/2013 |
0.35 |
0.39 |
0.36 |
-3% |
8% |
251 |
193% |
182% |
Note: Radar hourly ratio adjustments are being added
(green) beginning Aug 1,
2012. The UN-subdivided basin uses the ratio of 3GageAvg/3RadarAvg.
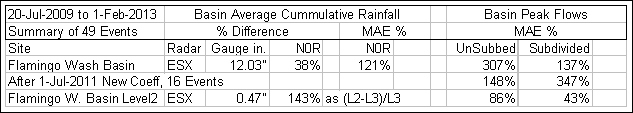
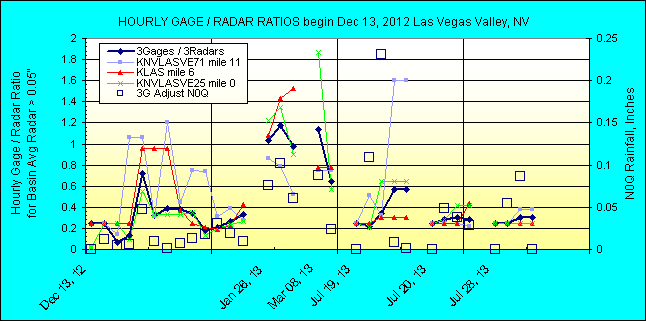
The 3 subdivided basins began using the 3 seperate gage/radar ratios on Dec 13,
2012. For tipping bucket comparisons, Svenson and Eastern use the McCarran
gage ratio and the others use the other closer of the two ratios. It only
took me 3 years to figure out one must adjust the radar and it
looks like it's really paying off!!!
Level 2 is the high resolution NEXRAD base reflectivity radar images that
are downloaded using the NOAA Weather Toolkit for comparison with the real-time
Level 3 N0R Ridge 1 product used here. N0Q now has the same dBz resolution
as Level 2 of 0.5 but spatial is like old N0R 0.6mi x 0.6 mi mid-mid range.
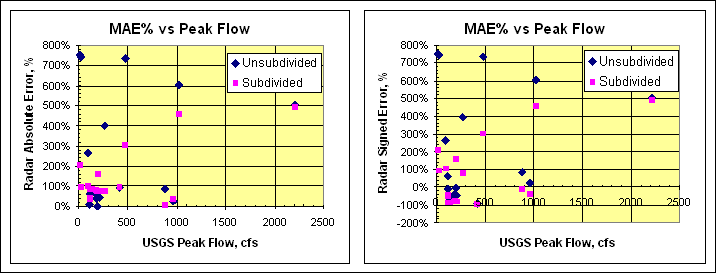
% Diff is the difference between the two totals of rainfall events.
MAE% is the mean absolute error as the average of the individual unsigned
difference for each event.
Ongoing Averaged Rainfall Comparison:
Average distace to the ESX radar is 33 miles, average mid-beam base scan
elevation is 5,000 ft.
I find it amazing that no matter how bad the 5-minute correlation is to tipping
buckets or how far Nexrad missed the event total rainfall, in the end, Nexrad
actually consistantly reports the actual seasonal accumulated rainfall for the
basin. Time after time. How do they do that?
It appears that runoff computation just exaserpates the radar rainfall errors.
Perhaps I should take the average of tipping buckets rainfall and recalibrate
the runoff coefficients to get back in the ball park. My initial calibration did
not even look at the tipping bucket rainfall. Boy, was I optimistic. But
basins without rain gauges do not allow for the luxary of calibration from rain
gauges. And I thought this would all be so easy. As noted at the beginning
the experts suggested "A search of the online literature of comparisons seem to
suggest caution." Boy was that an under statement. The average of
the tipping buckets for the calibration storm of July 20, 2009 was 0.16 inches
versus the N0R of .31 inches.
An attempt was made to convert the tipping bucket records for July 20, 2009 to
5-minute steps and then averaged for the basin. This met with nothing resembling
the runoff record for that day. Correlation of the 5-minute record with a
single tipping bucket was also futile. At least the radar found rainfall in the basin
that the tipping buckets missed so that's good.
A simple correction of the radar N0R rainfall record by the average TipB/N0R
ratio resulted in the following improvements. No changes to the original runoff
coefficients were made. Hopefuly summer rainfall will redeem this winter's
Nexrad radar rainfall record or Nexrad rainfall will simply be a waste of time
out here...
beyond the hundredth meridian.
|
Flamingo Wash Urban Area Runoff as % of USGS
|
|
|
N0R
|
Adjusted
|
N0R
|
Adjusted
|
|
Date
|
Peak cfs
|
Peak cfs
|
acre-feet
|
acre-feet
|
|
7/20/2009
|
104%
|
34%
|
99%
|
39%
|
|
7/22/2009
|
274%
|
|
143%
|
|
|
8/6/2009
|
843%
|
|
|
|
|
8/22/2009
|
|
|
|
|
|
8/23/2009
|
|
|
|
|
|
9/4/2009
|
6385%
|
804%
|
5619%
|
762%
|
|
revised9/4
|
1162%
|
0%
|
|
|
|
12/7/2009
|
35%
|
114%
|
38%
|
73%
|
|
12/12/2009
|
|
|
|
|
|
12/13/2009
|
371%
|
300%
|
100%
|
200%
|
|
1/19/2010
|
9%
|
290%
|
10%
|
239%
|
|
1/20/2010
|
25%
|
30%
|
32%
|
40%
|
|
1/21/2010
|
7%
|
9%
|
5%
|
7%
|
|
1/27/2010
|
498%
|
188%
|
101%
|
44%
|
|
2/5/2010
|
|
|
|
|
|
2/6/2010
|
833%
|
429%
|
425%
|
203%
|
|
2/9/2010
|
37%
|
77%
|
21%
|
45%
|
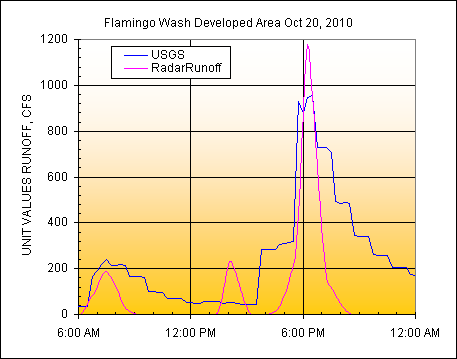
Something I have failed to point out is the EARLY WARNING that Nexrad radar
can provide in the absense of rain gages and should be noted here. Also radar
lets you see it comming. Although a 0.5 hour lag time is not
much early warning it is better than waiting for the USGS to report the peak up
to an hour later. The data below for the runoff comparison below seems to show
the USGS clock has fixed itself (see initial calibration above):
USGS Peak time 18:30
with peak cfs=957 |
|
|
|
|
|
Actual |
|
Radar |
Radar |
Minutes to |
Time to |
|
Rain Time |
Peak CFS |
Peak |
Peak |
|
10/20/10 17:00 |
123 |
0:20 |
1:30 |
|
10/20/10 17:15 |
195 |
0:20 |
1:15 |
|
10/20/10 17:30 |
244 |
0:10 |
1:00 |
|
10/20/10 17:45 |
913 |
0:25 |
0:45 |
|
10/20/10 17:50 |
1130 |
0:25 |
0:40 |
|
10/20/10 17:55 |
1170 |
0:25 |
0:35 |
|
10/20/10 18:00 |
1170 |
0:15 |
0:30 |
|
10/20/10 18:05 |
1180 |
0:10 |
0:25 |
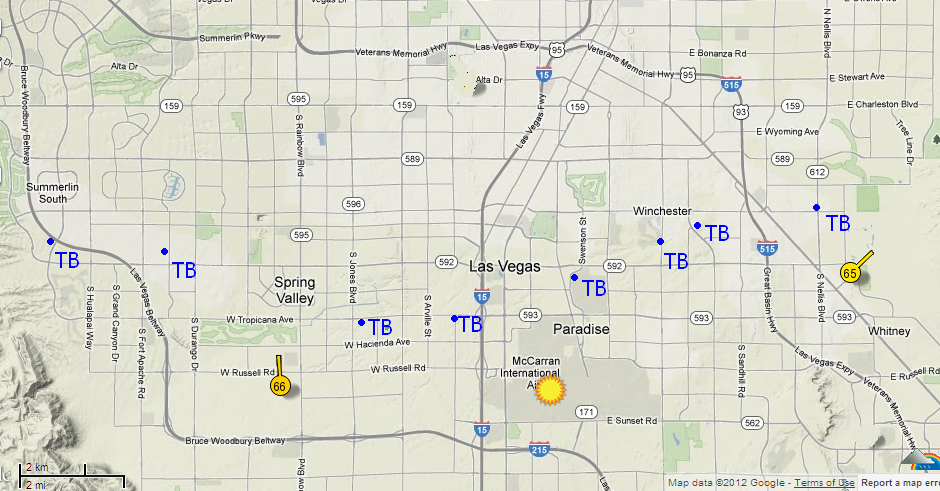
Two Weahter Underground Rain Gage
and NWS McCarran Airport Locations used for hourly gage/radar ratios
used to adjust radar:
(Tip: never use an airport rain gage unless you know exactly what you are
doing!... ok maybe I do now.)
Check out another of my Nexrad real-time runoff comparisons for Central Valley
California at my web page
RunoffComparisonsBigCrCA.aspx. and in Arizona
RunoffAZ.aspx ...they get
better at the end.
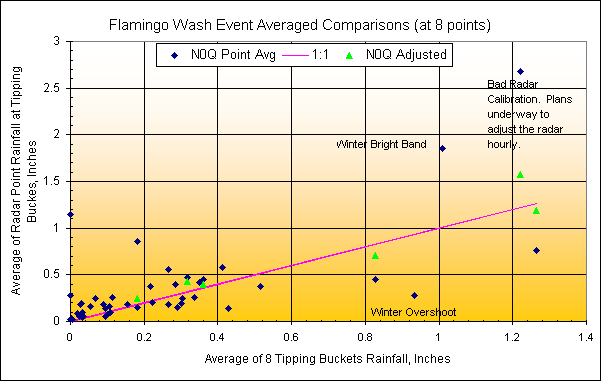
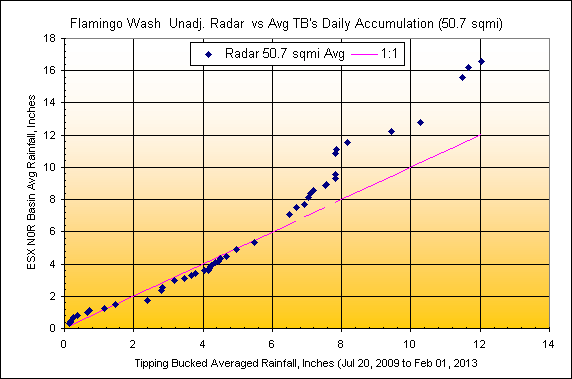
Also as a way to evaluate the NEXRAD rainfall 5-minute record and put the blame
where it belongs, runoff for hypothedical 1 square mile basins are now computed
for both the tipping bucket and Nexrad rainfall record at some of the
point rainfall
comparison sites here. This elimanates any actual basin characteristcs and
shows the effect of only the difference in rainfall records on a hypothetical
runoff sequence.
Part 2
Radar Rainfall Adjustment
(A continuation with just the adjusted radar)
GetRealtime's hourly gage/radar ratioing method was used to add the much needed
hourly adjustments. Three Wunderground gages were used for ratios. For the full
basin average runoff, the ratioing was Avg3Gages/Avg3Radars. You could use
the sums instead of averages but the sums do not compare graphically as nice and
looses some connotation. And should a Wundergage fail, the averages could
still give a good ratio but the totals would not. For the 3
subdivided basins each subbasin average radar rainfall was based on the single
nearest Wundergage ratio. The adjusted radar at the Clark County tipping buckets
was computed both ways for comparison, 3G/3R and neaerest 1G/1R. These
hourly ratios are applied to 5-minute rainfall computed from N0Q radar
reflectivity using the standard NWS Convective Z-R year around.
It may have taken me over 3 years but I think my adjusted Nexrad radar rainfall
is now ready for the big time. I think my future example studies should try to
look at ratioing methods... like how far away from a basin can a good Wundergage
be?... so I will try to do that here.
Three Wunder Gage locations and 8 Clark County Tipping Buckets:
|
Flamingo Wash Urban Area Adjusted Averaged Rainfall and Runoff |
|
SubDivide |
SubDivide |
|
|
N0Q |
Tipping |
N0Q |
USGS |
N0Q |
USGS |
N0Q |
N0Q |
|
Date |
Rain in |
Rain in |
Peak cfs |
Peak cfs |
acre-feet |
acre-feet |
Peak cfs |
acre-feet |
|
12/13/2012 |
0.17 |
0.18 |
88 |
89 |
88 |
79 |
84 |
65 |
|
1/26/2013 |
0.39 |
0.36 |
251 |
89 |
139 |
61 |
160 |
114 |
|
3/8/2013 |
0.19 |
0.17 |
153 |
136 |
55 |
48 |
110 |
38 |
|
7/19/2013 |
0.35 |
0.24 |
2940 |
3110 |
414 |
458 |
2130 |
402 |
|
7/20/2013 |
0.11 |
0.19 |
162 |
502 |
42 |
79 |
283 |
40 |
|
7/28/2013 |
0.15 |
0.16 |
194 |
278 |
52 |
75 |
272 |
144 |
|
8/18/2013 |
0.25 |
0.17 |
94 |
194 |
96 |
96 |
73 |
81 |
|
8/4/2014 |
0.6 |
0.71 |
823 |
716 |
275 |
307 |
895 |
267 |
|
9/8/2014 |
0.8 |
0.60 |
5430 |
6390 |
946 |
2596 |
12240 |
1487 |
|
|
|
|
|
|
|
|
|
|
|
Clark County Flood District Tipping Bucket |
|
|
|
|
|
|
Inches |
Mile16.8 |
Mile 14.0 |
Mile 10.7 |
Mile9.2 |
Mile 5.5 |
Mile 3.8 |
Mile 2.6 |
Mile 0.0 |
|
Date |
TownCtr |
TheLakes |
TorreyPines |
Decatur |
Svenson |
Eastern |
Mojave |
Nellis |
|
12/13/2012 |
0.1 |
0.12 |
0.18 |
|
0.24 |
0.3 |
0.28 |
0.06 |
|
1/26/2013 |
0.35 |
0.39 |
0.39 |
0.35 |
0.35 |
0.43 |
0.35 |
0.28 |
|
3/8/2013 |
0.16 |
0.2 |
0.12 |
0.08 |
0.16 |
0.24 |
0.2 |
0.2 |
|
7/19/2013 |
0.08 |
0.2 |
0.47 |
0.28 |
|
0.16 |
0.47 |
0.03 |
|
7/20/2013 |
0.04 |
0.04 |
0 |
0.04 |
0.35 |
0.04 |
0.63 |
0.36 |
|
7/28/2013 |
0.94 |
0.31 |
0 |
0 |
0 |
0 |
0 |
0 |
|
8/18/2013 |
0.28 |
0.16 |
0.12 |
0.08 |
0.2 |
|
0.28 |
0.08 |
|
8/4/2014 |
0.79 |
0.86 |
1.65 |
|
|
0.47 |
0.35 |
0.12 |
|
9/8/2014 |
0.35 |
0.71 |
1.26 |
0.63 |
|
0.39 |
0.43 |
0.4 |
|
|
|
|
|
|
|
|
|
|
|
Nexrad N0Q Radar Image Pixel Precip Unadjusted |
|
|
|
|
|
|
Inches |
Mile16.8 |
Mile 14.0 |
Mile 10.7 |
Mile9.2 |
Mile 5.5 |
Mile 3.8 |
Mile 2.6 |
Mile 0.0 |
|
Date |
TownCtr |
TheLakes |
TorreyPines |
Decatur |
Svenson |
Eastern |
Mojave |
Nellis |
|
12/13/2012 |
0.19 |
0.26 |
0.45 |
0.72 |
1.16 |
1.25 |
1.25 |
1.54 |
|
1/26/2013 |
0.75 |
0.55 |
0.40 |
0.41 |
0.37 |
0.39 |
0.38 |
0.38 |
|
3/8/2013 |
0.42 |
0.34 |
0.26 |
0.27 |
0.32 |
0.30 |
0.29 |
0.40 |
|
7/19/2013 |
0.44 |
0.36 |
1.32 |
1.41 |
1.37 |
0.84 |
0.94 |
0.18 |
|
7/20/2013 |
0.17 |
0.12 |
0.13 |
0.13 |
0.65 |
0.58 |
1.40 |
1.55 |
|
7/28/2013 |
1.70 |
0.88 |
0.08 |
0.04 |
0.08 |
0.09 |
0.09 |
0.11 |
|
8/18/2013 |
1.47 |
0.88 |
0.68 |
0.80 |
1.05 |
0.96 |
1.34 |
0.59 |
|
8/4/2014 |
0.80 |
1.07 |
2.06 |
0.90 |
0.66 |
0.70 |
0.69 |
0.51 |
|
9/8/2014 |
0.44 |
0.90 |
1.33 |
0.79 |
0.53 |
0.74 |
0.61 |
0.38 |
|
|
|
|
|
|
|
|
|
|
|
% Diff |
106% |
79% |
60% |
275% |
376% |
188% |
134% |
269% |
|
MAE% |
186% |
133% |
95% |
251% |
171% |
274% |
138% |
500% |
|
|
|
|
|
|
|
|
|
|
|
2 of 3 Wunderground Tipping Buckets Used for Hourly Corrections (daily ratios
shown here) |
|
|
Inches |
Mile ~11 |
N0Q |
gage/radar |
|
Mile ~0 |
N0Q |
gage/radar |
KLAS |
|
Date |
KNVLASVE71 |
at Gage |
Ratio |
|
KNVLASVE25 |
at Gage |
Ratio |
RatioOnly |
|
12/13/2012 |
0.17 |
0.44 |
0.39 |
|
0.30 |
1.55 |
0.19 |
0.28 |
|
1/26/2013 |
0.31 |
0.41 |
0.76 |
|
0.36 |
0.34 |
1.06 |
1.32 |
|
3/8/2013 |
0.14 |
0.32 |
0.44 |
|
0.31 |
0.44 |
0.70 |
0.43 |
|
7/19/2013 |
0.43 |
1.23 |
0.35 |
|
0.36 |
1.34 |
0.27 |
0.26 |
|
7/20/2013 |
0.02 |
0.14 |
0.14 |
|
0.68 |
2.24 |
0.30 |
0.20 |
|
7/28/2013 |
0.15 |
0.42 |
0.36 |
|
0.00 |
0.11 |
0.00 |
0.00 |
|
8/18/2013 |
0.1 |
0.74 |
0.14 |
|
0.24 |
0.9 |
0.27 |
0.14 |
|
8/4/2014 |
1.21 |
1.83 |
0.66 |
|
0.26 |
0.47 |
0.55 |
0.58 |
|
9/8/2014 |
1.11 |
1.7 |
0.65 |
|
0.18 |
0.44 |
0.41 |
0.64 |
|
|
|
|
|
|
|
|
|
|
|
Corrected by Hourly 3G/3R ratio 5-minute Radar at Clark County Flood District
Tipping Bucket |
|
|
Inches |
Mile16.8 |
Mile 14.0 |
Mile 10.7 |
Mile9.2 |
Mile 5.5 |
Mile 3.8 |
Mile 2.6 |
Mile 0.0 |
|
Date |
TownCtr |
TheLakes |
TorreyPines |
Decatur |
Svenson |
Eastern |
Mojave |
Nellis |
|
12/13/2012 |
0.07 |
0.09 |
0.14 |
0.24 |
0.36 |
0.38 |
0.43 |
0.47 |
|
1/26/2013 |
0.58 |
0.46 |
0.31 |
0.32 |
0.29 |
0.32 |
0.31 |
0.34 |
|
3/8/2013 |
0.21 |
0.18 |
0.17 |
0.18 |
0.22 |
0.18 |
0.17 |
0.25 |
|
7/19/2013 |
0.14 |
0.09 |
0.32 |
0.41 |
0.33 |
0.21 |
0.23 |
0.04 |
|
7/20/2013 |
0.05 |
0.04 |
0.04 |
0.04 |
0.19 |
0.17 |
0.4 |
0.45 |
|
7/28/2013 |
0.43 |
0.24 |
0.02 |
0.01 |
0.02 |
0.03 |
0.03 |
0.03 |
|
8/18/2013 |
0.37 |
0.23 |
0.18 |
0.22 |
0.26 |
0.24 |
0.33 |
0.14 |
|
8/4/2014 |
0.5 |
0.56 |
1.46 |
0.55 |
0.36 |
0.38 |
0.37 |
0.26 |
|
9/8/2014 |
0.84 |
0.98 |
0.79 |
0.68 |
0.43 |
0.44 |
0.44 |
0.3 |
|
|
|
|
|
|
|
|
|
|
|
% Diff |
3% |
-4% |
-18% |
82% |
89% |
16% |
-9% |
49% |
|
MAE% |
54% |
27% |
28% |
60% |
36% |
66% |
24% |
126% |
|
|
|
|
|
|
|
|
|
|
|
% Difference Corrected Hourly 5-minute Radar at Clark County Flood District
Tipping Bucket |
|
|
Inches |
Mile16.8 |
Mile 14.0 |
Mile 10.7 |
Mile9.2 |
Mile 5.5 |
Mile 3.8 |
Mile 2.6 |
Mile 0.0 |
|
Date |
TownCtr |
TheLakes |
TorreyPines |
Decatur |
Svenson |
Eastern |
Mojave |
Nellis |
|
12/13/2012 |
-30% |
-25% |
-22% |
|
50% |
27% |
54% |
683% |
|
1/26/2013 |
66% |
18% |
-21% |
-9% |
-17% |
-26% |
-11% |
21% |
|
3/8/2013 |
31% |
-10% |
42% |
125% |
38% |
-25% |
-15% |
25% |
|
7/19/2013 |
75% |
-55% |
-32% |
46% |
|
31% |
-51% |
33% |
|
7/20/2013 |
25% |
0% |
|
0% |
-46% |
325% |
-37% |
25% |
|
7/28/2013 |
-54% |
-23% |
|
|
|
|
|
|
|
8/18/2013 |
32% |
44% |
50% |
175% |
30% |
|
18% |
75% |
|
8/4/2014 |
-37% |
-35% |
-12% |
|
|
-19% |
6% |
117% |
|
9/8/2014 |
140% |
38% |
-37% |
8% |
|
13% |
2% |
-25% |
|
|
|
|
|
|
|
|
|
|
|
Flamingo Wash Urban Area Basin Averaged Rainfall and Runoff |
|
|
|
|
|
|
Unadj N0Q |
Adj N0Q |
Tipping |
Unadj N0Q |
Adj N0Q |
|
UnSubD |
SubDivid |
|
Date |
Rain in |
Rain in |
Rain in |
%Diff |
%Diff |
|
Peak%Diff |
Peak%Diff |
|
12/13/2012 |
0.64 |
0.17 |
0.18 |
250% |
-7% |
|
-1% |
-6% |
|
1/26/2013 |
0.35 |
0.39 |
0.36 |
-3% |
8% |
|
182% |
80% |
|
3/8/2013 |
0.33 |
0.19 |
0.17 |
94% |
12% |
|
13% |
-19% |
|
7/19/2013 |
1.22 |
0.35 |
0.24 |
405% |
45% |
|
-5% |
-32% |
|
7/20/2013 |
0.4 |
0.11 |
0.19 |
113% |
-41% |
|
-68% |
-44% |
|
7/28/2013 |
0.53 |
0.15 |
0.16 |
231% |
-6% |
|
-30% |
-2% |
|
8/18/2013 |
0.96 |
0.25 |
0.17 |
465% |
47% |
|
-52% |
-62% |
|
8/4/2014 |
1.05 |
0.6 |
0.71 |
48% |
-15% |
|
15% |
25% |
|
9/8/2014 |
0.98 |
0.8 |
0.60 |
63% |
33% |
|
-15% |
92% |
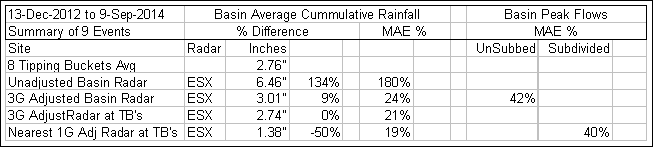
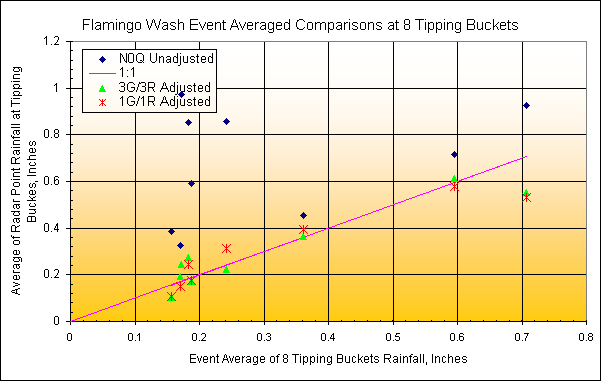
Event average rainfall at the
gage points based on both 3G/3R ratioing and nearest 1G/1R ratioing:
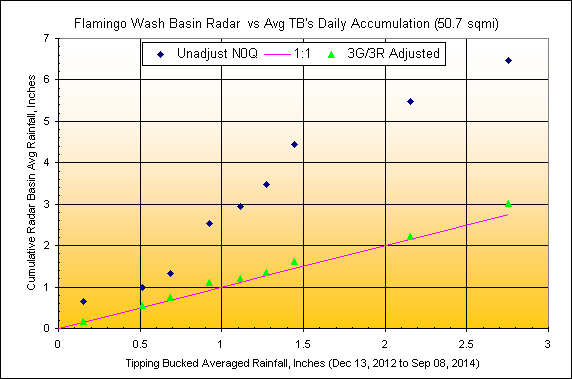
Cumulative basin 50.7 sqmi average versus 8 tipping bucket average
based on 3G/3R ratioing:
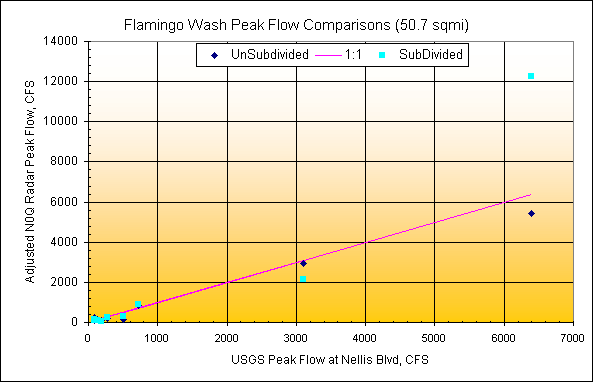
Computed
peak runoff versus USGS peak flow; is using single closest Wundergage
ratio better?:
Hourly Gage/Radar ratios:
GetRealtime_setup.txt:
**get the 3 Wundergages rainfall
KNVLASVE71; 10229; Rainfall; Russel at Rainbow LV, NV
KNVLASVE25; 10230; Rainfall; Nellis at Flamingo LV, NV
KLAS; 10234; Rainfall; McCarran Airpot, NV
**get the radar 5-minute rainfall at the 3 Wundergages
NEXRAD-ESX; -10229; Rainfall; Russel at Rainbow LV, NV; 0
NEXRAD-ESX; -10234; Rainfall; McCarran Airpot, NV; 0
NEXRAD-ESX; -10230; Rainfall; Nellis at Flamingo LV, NV; 0
**compute the hourly average for the 3 Wundergage locations
COMPUTE-hour; 10231; Rainfall; Avg of Rainbow,Nellis,Klas Gages; 0; 0;
(P1+P2+P3)/N
COMPUTE-hour -10231; Rainfall; Avg of Rainbow,Nellis,Klas Radars; 0; 0;
(P1+P2+P3)/N
**Compute the hourly ratio 3GageAvg/3RadarAvg
COMPUTE-hour; 31231; Ratio; Ratio of Avg of Rainbow, Nellis, KLAS LV, NV; 0;
0.0,0.25,3; P1/P2
**get the average basin radar 5-minute rainfall
NEXRAD-ESX; -10210; Rainfall; Flamingo Wash Urban Nexrad N0Q; 0
**Compute the adjusted basin average radar 5-minute rainfall
COMPUTE-unit; 11210; Rainfall; Flamingo Wash Full Developed Basin Adj N0Q; 0;
-1, 0.25, .01, 0.50; P1*P2
Note that the GetAccess table 'rsite' entry for each setup line above is not
shown so see Help web page. Also getting the radar rainfall requires radar
point file.
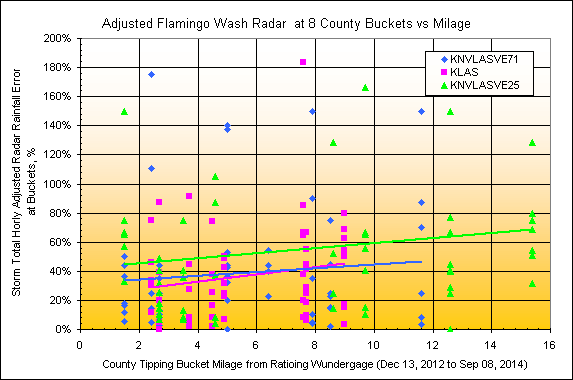
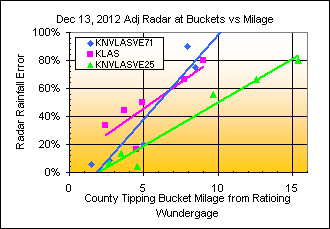
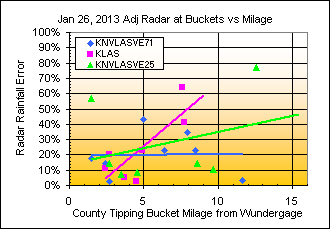
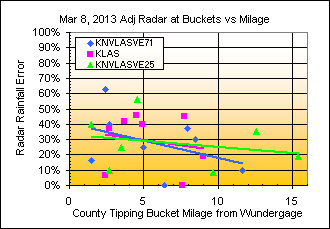
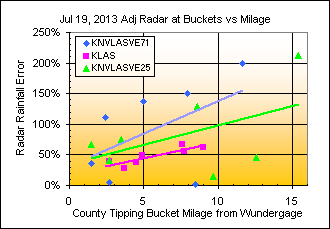
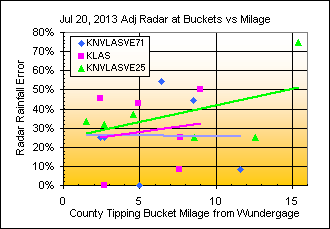
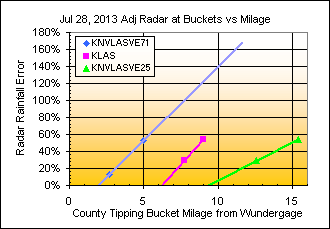
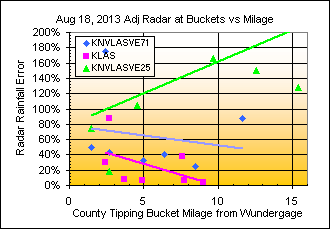
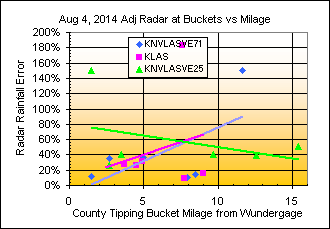
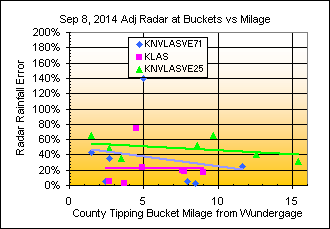
Radar Adjustment Error versus Distance
The graphs below will attempt to show if distance from the adjusting Wunderage
will have an affect on the adjusted radar error. I would assume the closer to
the Wunder gage the better but I hope this will prove not to be the case. The
idea for G/R hourly adjustment is that you are hoping every radar pixel in your
area of interest has a perfect distribution so by knowing the error at just one
pixel, you can perfectly correct them all. We shall see. The tipoff that this
will probably not be the case is that the G/R adjustment must be done hourly,
meaning conditions are constantly changing. But remember, radar is better
at area averages than at any particular point so although these point errors
look horrendus, averaging the 3 points for error would look much better.
For each storm event, the % error
as 100*Abs(R-G)/G of the adjusted radar storm total at each
County Tipping Bucket is plotted against its distance to the Wundergage used to
adjust it. The Gage/Radar hourly adjustment factor is the single G/R ratio at
the Wundergage (not 3gage avg). The 3 trend lines are the linear regressions for
error vs distance for each of the correcting Wundergages.
Ideally, a horizontal trend line near zero % error would be ideal and would
demonstrate radar images have perfect knowlege of the rainfall distribution, it
just does not know the actual error bias.
Here's a thought experiment: Do you think puting 4
rain gages in the 1 km adjustment radar pixel would improve the adjustment? Ha!
You would likely just get 4 rain gages saying the same thing. How about 4
closest radar pixels to 1
gage??? This I have looked at and does not seem to help but hurts (see below). If you
got better ideas, please let me know.
Adjusted radar
hourly error by storm event:
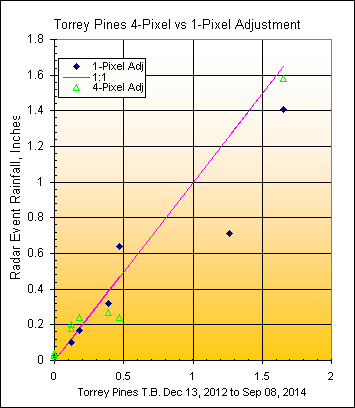
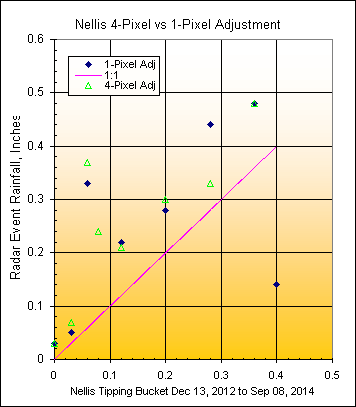
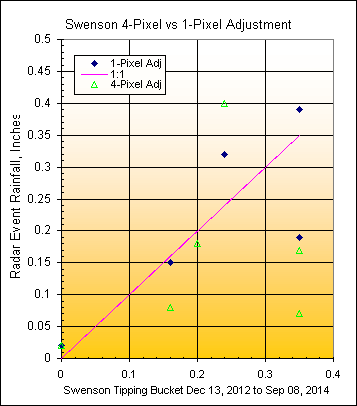
4-Pixel versus 1-Pixel Adjustment
To find out what would work better for adjusting radar, multiple radar pixels
nearest the Wundergage or the single pixel containing the Wundergage, the
following 3 graphs show the comparisons at 3 county tipping buckets. Looks like hands down, 1 single pixel
is by far better. The radar pixels are 1km x 1km. Does this imply that Level 2's
0.25km pixel would work even better? Or how about adjusting the 4km x 4km NWS
precip products, should they have 16 gages inside the pixel to adjust them???
The G/R adjustments below were for the closest Wundergage to each tipping
bucket, Russel WG vs Torrey, Nellis WG vs Nellis, and McCarran Airport WG vs
Swenson. Note that Airport Wunder Gages are a last resort to use for
hourly values because they do not report rainfall at the top of the hour.
In this case, McCarran reports at hh:56 each hour and GetRealtime uses that as
the end for summing to hourly values.
The Radar Adjustment Wizard Values:
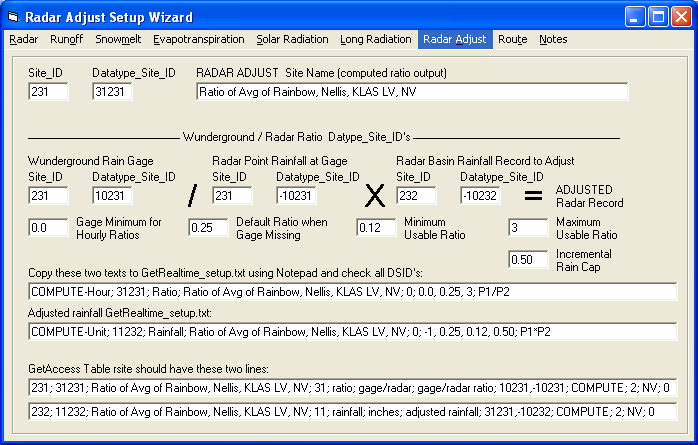
The Las Vegas ESX radar is only 34 miles from the Flamingo Basin centroid but
usually way overestimates rainfall (reflectivity) as seen by the hourly ratios
graph above. From the Ratio Wizard above you will see that the 'Default
Ratio When Gage Missing' is 0.25. What is up with that??? The
'Gage
Minimum for Hourly Ratios' is set to zero. This means any value greater
than zero for the average of the 3 Wunrgages will have ratio computed. If
the value of 3 Wundergage average is zero, the defualut 0.25 ratio will be used.
(If 0.01 was entered then anytime the Wundergage average was zero, then the
basin radar would be zeroed out and is not what we want here. Normally I
would not go below 0.02" so I must have had a good reason here.) The
'Minimum Usuable Ratio' is 0.12 or half the default ratio. The
'Maximum Usable
Ratio' is 3. The 'Incremental Rain Cap' is 0.50 inches in 5 minutes or 6 in/hr
rainfall rate. I'm not sure if this cap should be much higher or just what it
should be. 6 in/hr is above the hail cap at about 5 in/hr and the 100yr 5-min
rainfall from NOAA Atlas-14 is 0.5" for LV Valley. Just something you may wish
to consider raising back east and in tropical conditions or even lowering for
large basins.
Some runoff comparisons using 3G/3R adjusted radar N0Q rainfall
with Initial Loss method (not CN):
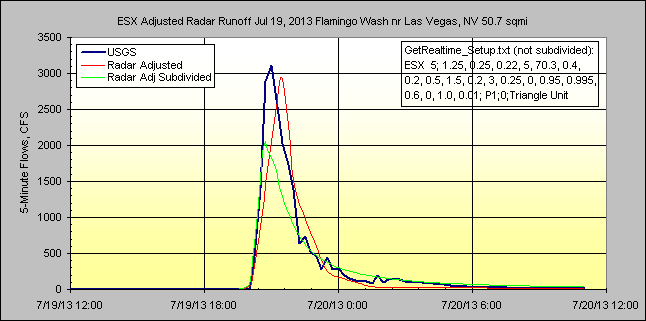
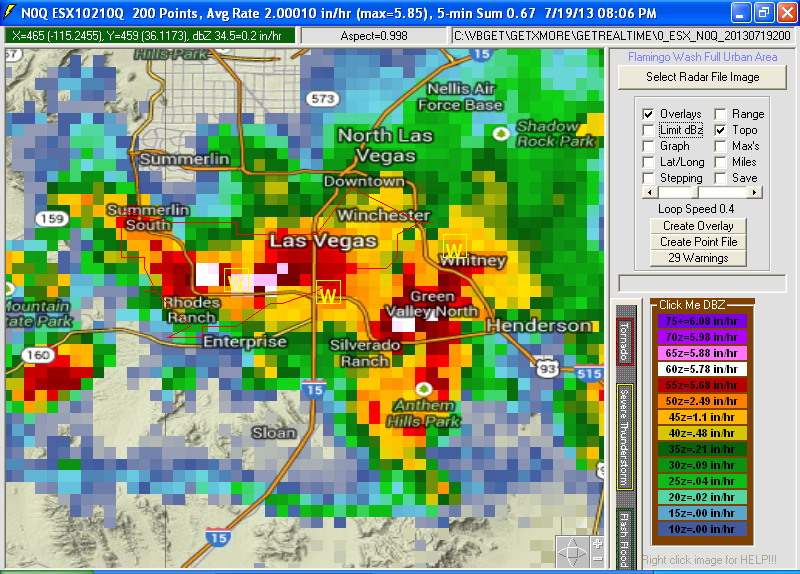
Radar image for July 19, 2013. This should have had the end of the world sirens
blowing in Las Vegas if were not for the fact that the ESX radar is 400% out of
wack. The unadjusted peak flow would have been 22,000 cfs versus the radar
adjusted and measured 3,000 cfs at the USGS stream gage.
While waiting for the paint to dry in real-time desert rainfall, check out another
of my ongoing radar adjustment studies in Charlotte, NC
go here. My
Charlotte study takes a closer look at continuous runoff modeling affects for
different adjustment stratigies. All my other ongoing studies also use
adjusted real-time radar rainfall and snowmelt.
Important Note: Nothing on this page is intended as
interpretation of any legal authority such as water rights and supply. This page
is intended solely as a demonstration of techniques in flood potential
monitoring. The reader assumes all risk for any damages whatsoever in connection
with the access, use, quality, or performance of the supplied data just so you
know.
|
|