Demonstrates methods for hourly Radar Adjustment and continous runoff
with SCS Curve Number loss method and 5-minute Radar Snowpack and Melt in
real-time.
*** GetRealtime is my free
Windows program that automates downloading free real-time hydrologic and
meteorlogical data at scheduled intervals for display. Supports USGS,
Wunderground, USBR, COE, USCS Snotel, CDEC, CIMIS, and NOAA WSR-88D radar for
continuous computation and simulation and it's also
free.***
07/02/2012 Important news for all GetRealtime users!
I had an appalling realization about Wunderground rain gage reporting. I
had assumed from prior year studies that the Wundergage rainfall parameter
'HourlyPrecipIn' for a 5-minute value was the incremental rainfall over the 5
minute period and reported as inches/hour. To see what Blue Ridge Mtn folk think
this means skip to the bottom of the page here.
The Beech Mountain
area Wundergages are located in the higher elevations of the Blue
Ridge Mountains of western North Carolina. The 6 selected Wundergage elevations
range from 2850 to 4960 feet. The area was chosen at random to see if
better results could be obtained as compared to sub-tropical Ft Lauderdale gage
comparisons I made
here.
Three Nexrad Radars will simultaneously be used to also see how radar sites
compare with one another. 5-minute radar and gage rainfall values are computed in real-time
using my free Windows program
GetRealtime. Snowpack and melt will also be computed from the NEXRAD Radar N0Q images
in winter.
In addition to the 6 Wundergages, a 90.8 sqmi catchment of the
upper Watauga River for radar site comparisons of area averaged rainfall,
snowmelt, and runoff. Gage #6 is the only gage inside the basin but is
located near the basin centroid. The other Wundergages are located just
west of the basin. Update 6/23/2012 Gage #1 died and was replaced with a
gage also inside and near the Watauga Basin centroid at a higher elevation.
Also gage #4 died and replaced 7/2/2012 with one on the Watauga Basin's southern
boundary making a total of 3 gages inside the basin.
Update 7/19/2012: I have also added a hypothedical basin
to compare the
average of all 6 Wundergages with the 3 radars. Included below is the step by
step method used.
Also note that I thought the MRX radar being slightly closest to the catchment
would be the best calibrated to actual rainfall. I don't know who calibrates
these radars and for what reason but I doubt it 's a fair fight. I quess MRX
Knoxville radar is not called Knoxville radar for nothing. Doesn't headquarters
know what these 3 guys are up to? MRX and GSP are scanning the the same
elevation while FCX is 2000 feet higher, but somehow FCX and GSP are at least in
the same ballpark. MRX is way under registering rainfall and gage ratio
adjusting is poor because you cannot adjust zero rainfall. Also take these
Wundergage's with a grain of salt and look at trends and gage averages.
Summary Table
Beech Mountain Area Daily Rainfall
% Difference is the error in total rainfall, a
measure of bias.
MAE % is the mean of the individual daily or hourly unsigned
differences, a measure of error variablility, and has been limited to values >0.1 inches.
Live shot from elevation 3030 feet:

This new comparison of NEXRAD radar rainfall is with the new Ridge 2
Testbed N0Q Level 3 product with high dBz resolution of 0.5 dbz versus the old 5
dbz. Rainfall is
computed from the 5-minute radar images using the standard WRD-88D Convective Z-R
relationship and East Cool in winter using GetRealtime.exe in real-time.
For additional information on NEXRAD radar rainfall using GetRealtime.exe go
here. For
info on the great new N0Q radar reflectivity product go
here.
GetRealtime dBz to Rainfall Conversion
Wunderground Gage Loactions:
#1 Beech Mtn, NC Wunder Gage KNCBOONE12:
Wunderground Gage:
KNCBOONE12, Lat 36.227, Lon -81.720, gage
elev=3400 ft.
MRX Pixel
664,494, radar distance=94.1 miles, mid scan elev=10,890 ft
GSP Pixel 549,367, radar distance=97.0 miles, mid scan elev=10,890 ft
FCX Pixel
361,577, radar distance=97.7 miles, mid scan elev=12,870 ft
Radar image pixel size 0.57 x 0.70 miles, radar scan bin size 0.62 range x 1.5
width miles
GetRealtime_setup.txt: KNCBOONE12; 10811; Rainfall; Beech Mtn. #1, NC
GetAccess rsite table:
811; 10811; Beech Mtn. #1, NC ; 10; rainfall; inches; inches;
dailyrainin;
KNCBOONE12; 8; NC;-3
GetRealtime_setup.txt: NEXRAD-MRX; -10811; Rainfall; Beech Mtn
#1, NC; 0
GetAccess rsite table:
811; -10811; Beech Mtn. #1, NC ; 10; rainfall; inches; inches; N0Q-Ridge2;
NEXRAD-MRX; 8; NC; 0
(note: Gage daily values computed from unit value rates based on a Pacific time
-3 hr shift to match radar converted to my local Pacific time.) First gage
KNCELKPA2 died and replaced 6/23/2012.
#2 Beech Mtn, NC Wunder Gage
KNCBEECH5:
Wunderground Gage:
KNCBEECH5, Lat 36.202, Lon -81.886, gage elev=4,849 ft
MRX Pixel 647,497, radar distance=84.3 miles, mid scan elev=9,450 ft
GSP Pixel 533,370, radar distance=92.8 miles, mid scan elev=10,320 ft
FCX Pixel 345,579, radar distance=105.9 miles, mid scan elev=14,220 ft
GetRealtime_setup.txt: KNCBEECH5; 10812; Rainfall; Beech Mtn. #2, NC
GetAccess rsite table:
812; 10812; Beech Mtn. #2, NC ; 10; rainfall; inches; inches; dailyrainin;
KNCBEECH5; 8; NC;-3
GetRealtime_setup.txt: NEXRAD-MRX; -10812; Rainfall; Beech Mtn
#2, NC; 0
GetAccess rsite table: 812; -10812; Beech Mtn. #2, NC ; 10;
rainfall; inches; inches; N0Q-Ridge2; NEXRAD-MRX; 8; NC; 0
(note: Gage daily values computed from unit value rates based on a Pacific time
-3 hr shift to match radar converted to my local Pacific time.)
#3 Beech Mtn, NC Wunder Gage
MD8069:
Wunderground Gage:
MD8069, Lat 36.225, Lon -81.897, gage elev=3,998 ft.
MRX Pixel 646,494, radar distance=83.8 miles, mid scan elev=9,380 ft
GSP Pixel 532,367, radar distance=94.7 miles, mid scan elev=10,610 ft
FCX Pixel 344,577, radar distance=106.0 miles, mid scan elev=14,170 ft
GetRealtime_setup.txt: MD8069; 10813; Rainfall; Beech Mtn. #3, NC
GetAccess rsite table:
813; 10813; Beech Mtn. #3, NC ; 10; rainfall; inches; inches; dailyrainin;
MD8069; 8; NC;-3
GetRealtime_setup.txt: NEXRAD-MRX; -10813; Rainfall; Beech Mtn
#3, NC; 0
GetAccess rsite table: 813; -10813; Beech Mtn. #3, NC ; 10;
rainfall; inches; inches; N0Q-Ridge2; NEXRAD-MRX; 8; NC; 0
(note: Gage daily values computed from unit value rates based on a Pacific time
-3 hr shift to match radar converted to my local Pacific time.)
#4 Beech Mtn, NC Wunder Gage
KNCBLOWI4:
Wunderground Gage:
KNCBLOWI4, Lat 36.121, Lon -81.758, gage elev=3,800 ft.
MRX Pixel 660,505, radar distance=91.9 miles, mid scan elev=10,550 ft
GSP Pixel 546,378, radar distance=89.2 miles, mid scan elev=9,790 ft
FCX Pixel 357,587, radar distance=103.9 miles, mid scan elev=13,830 ft
GetRealtime_setup.txt: KNCBLOWI4; 10814; Rainfall; Beech Mtn. #4, NC
GetAccess rsite table:
814; 10814; Beech Mtn. #4, NC ; 10; rainfall; inches; inches; dailyrainin;
KNCBLOWI4; 8; NC;-3
GetRealtime_setup.txt: NEXRAD-MRX; -10814; Rainfall; Beech Mtn
#4, NC; 0
GetAccess rsite table:
814; -10814; Beech Mtn. #4, NC ; 10; rainfall; inches; inches; N0Q-Ridge2;
NEXRAD-MRX; 8; NC; 0
(note: Gage daily values computed from unit value rates based on a Pacific time
-3 hr shift to match radar converted to my local Pacific time.) First gage
KNCBEECH3 replaced 7/2/2012.
#5 Beech Mtn, NC Wunder Gage
KNCBANNE7:
Wunderground Gage:
KNCBANNE7, Lat 36.174, Lon -81.913, gage elev=3,458 ft.
MRX Pixel 645,499, radar distance=82.6 miles, mid scan elev=9,290 ft
GSP Pixel 530,372, radar distance=91.1 miles, mid scan elev=10,060 ft
FCX Pixel 342,582, radar distance=108.9 miles, mid scan elev=14,650 ft
GetRealtime_setup.txt: KNCBANNE7; 10815; Rainfall; Beech Mtn. #5, NC
GetAccess rsite table:
815; 10815; Beech Mtn. #5, NC ; 10; rainfall; inches; inches; dailyrainin;
KNCBANNE7; 8; NC;-3
GetRealtime_setup.txt: NEXRAD-MRX; -10815; Rainfall; Beech Mtn
#5, NC; 0
GetAccess rsite table: 815; -10815; Beech Mtn. #5, NC ; 10;
rainfall; inches; inches; N0Q-Ridge2; NEXRAD-MRX; 8; NC; 0
(note: Gage daily values computed from unit value rates based on a Pacific time
-3 hr shift to match radar converted to my local Pacific time.)
#6 Beech Mtn, NC Wunder Gage
KNCVILAS2:
Wunderground Gage:
KNCVILAS2, Lat 36.246, Lon -81.765, gage elev=2,850 ft.
MRX Pixel
659,492, radar distance=91.3 miles, mid scan elev=10,480 ft
GSP Pixel
545,365, radar distance=97.8 miles, mid scan elev=11,090 ft
FCX Pixel
357,575, radar distance=98.8 miles, mid scan elev=13,040 ft
GetRealtime_setup.txt: KNCVILAS2; 10816; Rainfall; Beech Mtn. #6, NC
GetAccess rsite table:
816; 10816; Beech Mtn. #6, NC ; 10; rainfall; inches; inches; dailyrainin;
KNCVILAS2; 8; NC;-3
GetRealtime_setup.txt: NEXRAD-MRX; -10816; Rainfall; Beech Mtn
#6, NC; 0
GetAccess rsite table: 816; -10816; Beech Mtn. #6, NC ; 10;
rainfall; inches; inches; N0Q-Ridge2; NEXRAD-MRX; 8; NC; 0
(note: Gage daily values computed from unit value rates based on a Pacific time
-3 hr shift to match radar converted to my local Pacific time.)
Just Wunder Gage Accumulations:
When it comes to recording precipitation, all Wunderground stations are not
alike. This comparison is made to check for any large deviations over
time. It's not that easy calibrating and maintaining a good precip record
so a huge thank you to those of you that really try.
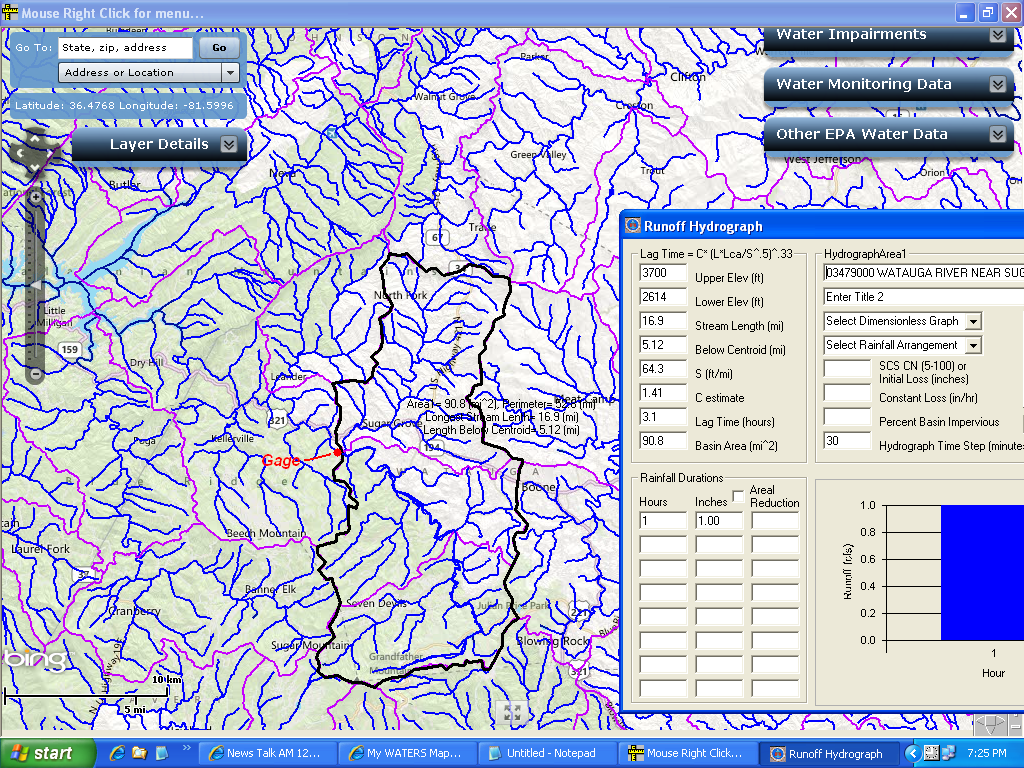
USGS 03479000 WATAUGA RIVER NEAR SUGAR GROVE, NC (90.8 sqmi) Runoff Computations:
The Watauga River upper most gaged catchment was planimetered for basin area and
basin radar image boundary pixels using my free Windows program GetMapArea.
For an example using GetMapArea go
here or even better
right below is anothr example.
USGS Gage:03479000,
basin centroid Lat 36.209, Lon -81.757, gage datum elev=2,607.84 ft.
MRX
Centroid Pixel 645,499, radar distance=91.2 miles, mid scan elev=10,540 ft, scan
width=1.5 miles, radar antenna elev=1,434 ft.
GSP
Centroid Pixel 545, 369, radar distance=95.1 miles, mid scan elev=10,670 ft,
scan width=1.5 miles, radar antenna elev=1,050 ft.
FCX
Centroid Pixel 357, 578, radar distance=99.4 miles, mid scan elev=13,230 ft,
scan width=1.6 miles, radar antenna elev=2,963 ft.
Radar image pixel size 0.57 x 0.70 miles
GetRealtime_setup.txt: NEXRAD-MRX; -10817; Rainfall; Watauga R
nr Sugar Grove, NC; 0
GetAccess rsite table: 817; -10817; Watauga R nr
Sugar Grove, NC ; 10;
rainfall; inches; inches; N0Q-Ridge2; NEXRAD-MRX; 8; NC; 0
(note: Gage flows stored based on a Pacific time
-3 hr shift to match radar converted to my local Pacific time.)
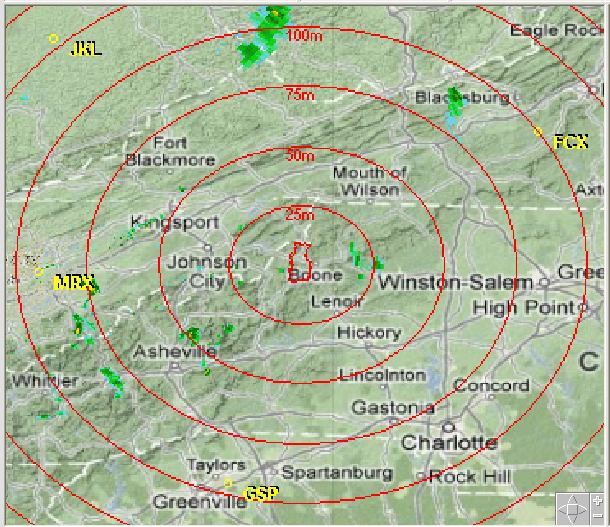
Watauga basin area with radar sites MRX, GSP, and FCX as shown on GetNexrad
radar viewer:
5-minute Snowpack and Melt Computations:
The temperature, humidity, windspeed at WunderGage #6 (or #1 if missing) was
used to compute solar radiation and long wave radiation. With these 5
parameters and adjusted rainfall, the snowpack and melt was computed at a
5-minute time step in real-time (or the next day). The 3 radars are using
the Cool East Z-R for converting radar reflectivity to rainfall/snowfall.
The Cool East Z-R provides precip down to 10dbz for adjusting (convective only
20dbz). The graphs below shows what factors, if any, were used to adjust
the 5 weather inputs and precip and albedo for the snowmelt computation.
It appears only Gage #4 of the 3 Wundergages in the basin is equipped with a heated
tipping bucket and so radar ajustment will be based only on Gage #4 this winter. Actual reported snow
values of some sort (depth or new or swe???) can be found
here
for comparison but the reported values so far are not even in the ballpark with
the Wunderground gages or with visual comparisons at Wunderground webcams in the
area. Snow will show up as white stuff on webcams and when reported values
are off the chart and no white stuff, well I am not dumb enough to use those
reported values... yet.
For more info on snowmelt computations see my past
Sierra study,
San Juaquin
study, and Help.
USGS Gage vs Radar Rainfall (and melt) Runoff:
The radar unit values used have a 5-minute time step for runoff computations.
The Wudergages 3-gage average time step is 1-hour.
SCS Curve Number CN method used with my CNwet and CNdry.
GetRealtime_setup.txt: NEXRAD-GSP; -30827; Runoff; Watauga R nr
Sugar Grove, NC;
50; 6.5,65,0.2,3,90.8,1.0,0.015,0.3,6,0.4,12,85,64,0.8; P1
GetAccess rsite table: 827; -30827; Watauga R nr
Sugar Gr; 30;runoff;cfs,cubic feet per second; -27811; NEXRAD-GSP; 8; NC; 0
Where -27811 is tall ET computed from Beech Mtn Wundergage #1 above.
Quick CN method calibration tip: Always start with a
yellow 0.2
constant loss and a yellow 0.8 GW loss.
Increase the red 65 CN to increase initial peak
flow and then increase red 0.015 reset factor to reduce
subsequent peak flows. Adjust the yellow 0.8 GW
loss when finished. Sometimes the recession slope
red 0.015 needs to be ballparked first for several
dry days. I have ignored the percent impervious so see more tips below.
Note that Nexrad Radars do not report the same rainfall.
Each radar has been adjusted using GetRealtimes hourly ratio
method where the average of Gages 1, 4, 6 are ratioed against
the average of the radar at each gage point. The hourly ratio is then
applied to basin average 5-minute radar rainfall values. If a gage is missing, the
average for the other 2 or even 1 will still be computed and ratioed against the
average of the 3 radar points. Probaly 1 good gage would work better than
my 3 iffy gages, but I wanted to try this averaging of multible gages.
Calibration Period Jun 20 to Jul 30, 2012:
USING THE ABOVE CALIBRATION AND JUNE 20, 2012 START DATE
(tip, for speed don't save unit values to the database until you got it all
looking good with the hourly's.)
Summer hourly comparison with the least accurate radar MRX ajdusted:
Winter hourly comparison with the least accurate radar MRX ajdusted N0Q EastCool
Z-R:
Hypothedical Basin Wunderground 6 Gage Average vs Radar Basin Area Average
Because radar rainfall should be better for areas rather than points, lets see
how our 6 Wunderground tipping buckets stack up against our 3 all seeing radars.
GetMapArea.exe was used to determine the 3 radar's basin 'Boundary
File' used by GetRealtime.exe. GetNexrad.exe was used to read the 3 boundary files and create the
3 'Point File's for the MRX, GSP, and FCX radar's N0Q images.
I will set you an example:
You may want to first watch these how to
videos for conceptionaliztions:
NEXRAD Radar image basin
area averaged rainfall to digitize a radar area.
Real-time Record of Nexrad
Radar Area Averaged Rainfall to add the area to GetRealtime.
For a full list of more helpful videos click on Site Map at the very top.
Using the Gif image below, I loaded it into GetMapArea.exe. To determine
the Hypo Basin's sqmi area, I need to set the milage scale. I selected
points #3 and #4 and then loaded the radar MRX to find the distance between
these gages as:
#3
Wunderground Gage:
MD8069, Lat 36.225, Lon -81.897
#4
Wunderground Gage:
KNCBLOWI4, Lat 36.121, Lon -81.758
Using GetNexrad I selected Boundary #3 and zoomed in. I clicked menu
'Lat/Long' and entered gage #4's Lat and Long, and clicked 'Set Point'. I
clicked menu 'Miles', clicked on the set point and then the center of Gage #3
and got the distance as 10.7 miles. Checking this value with Google
Earth's distance I got 10.6 miles but was more tedious but highly preferred, so lets use 10.6
because N0Q pixels are 0.6x0.7 miles.
Using GetMapArea
2.7.0 and setting the scale form Gages #3 to #4 as 10.6 miles, I
planimetered a 58.2 sqmi area for the gage centers in the Gif below.
Next is to create the MRX radar pixel Boundary File. Above I have X,Y pixel
values for each Gage and Radar. For MRX #3 pixel is 646,494 and MRX
pixel for #4 is 660,505. Using these pixels we can reset the
GetMapArea image scaling using General Pixels. The X1,Y1,X2,Y2 text to
enter is 646,494,660,505. We are now set to start the area. Right
click select Start Area and planimeter the area again. Click End Area,
Right click the coordinate text box and save as MRXHypoBoundary.txt.
Now we need to add a rainfall site to the GetAcces database table
rsite. I
will use 819 as the site_id and so the rainfall datatype_site_id will be -10819.
I use a negative to remind me I calculated it and is not a real gage.
Having our datatype_site_id we have to rename our Boundary file
MRXHypoBoundary.txt to our standard format as NexradBoundaryMRX-10819Q.txt.
The Q means the new Ridge2 N0Q product image is being used.... (and edit the the
title line in the file.)
To create the Nexrad Point file, start up GetNexrad.exe, select Create Point
File, and select Find our new file NexradBoundaryMRX-10819Q.txt in the
GetMapArea folder. Select No Conversion and then Create File. You
can zoom in on the red area to see our filled pixeled area.
Copy the 2 files NexradBoundaryMRX-10819Q.txt and NexradPointMRX-10819Q.txt
from the GetMapArea folder to your GetRealtime.exe folder (and also to your
GetNexrad images folder if you are using some other folder for GetNexrad
images?).
All that is left is to add this Boundary to our GetRealtime_setup.txt file using
Notepad as:
NEXRAD-MRX; -10819; Rainfall; MRX Hypo Basin, NC; 0
Test out a GetRealtime.exe radar retrieval for this site and if it works
then repeat the above planimetering for the GSP and FCX radars with these scale
points:
GSP 3 to 4 scale points: 532,367,546,378 >>> NexradBoundaryGSP-10829Q.txt
FCX 3 to 4 scale points: 344,577,357,587 >>> NexradBoundaryFCX-10839Q.txt
... and we are set to
make some comparisons.
To compute the 6 gage Wunderground average add a
819 site to the GetAccess database table rsite with the 6 datatype_site_ids and
you could add this text to your GetRealtime_setup.txt file as (I use a seperate
folder for GetRealtime.exe for weather and flow data because I don't need it downloaded
every 30 minutes like the radar):
COMPUTE-Hour; 10819; Rainfall; Hypo Basin Avg of 6 Rain Gages; 0; 0;
(P1+P2+P3+P4+P5+P6)/N
where using N instead of 6 returns average of
non-missing P's.
You should use COMPUTE-Hour because Wunderground gages use every kind of unit
time-step imanginable.
 You could do the inverse distance
to basin centroid squared weighting in my simple mean if it makes you feel
better and each adjust weighting by 6/N for missing gages. You could do the inverse distance
to basin centroid squared weighting in my simple mean if it makes you feel
better and each adjust weighting by 6/N for missing gages.
The GetAccess database table rsite would have parameter_code:
10811,10812,10813,10814,10815,10816
and the station_id is COMPUTE
Wunderground Parameters 'HourlyPrecipIn' versus 'dailyrainin'
I had an appalling realization about Wunderground rain gage reporting. I
had assumed from prior year studies that the Wundergage rainfall parameter
'HourlyPrecipIn' for a 5-minute value was the incremental rainfall over the 5
minute period and reported as inches/hour. For a 0.01" 5-min increment the
hourly rate would be 0.12" (0.01*60/5). This would be consistant with
meteorlogical convention. I had noticed a few past cases of what I thought
was a leafed clogged tipping bucket that delayed the unit values sometimes over
several hours.
Noticing lately that Wunderground was now reporting a new parameter
'dailyrainin' along side, I decided to compare the new 5-minute increments to the 5-minute
reported rates. To my schock and horror I found most of these tipping
buckets are
glogged or something. Some gages seem to report the 5-minute rates as the average rate
over the past hour and some are just what ever fits their fancy.
The take away here is that if in doubt, use the parameter 'dailyrainin'
accumulation values because rainfall rates are a lost art in the backwoods of
these here Blue Ridge Mtns. You be the judge:
Wundergage #1:
Gage #1 looks like a traditional hourly rate with some slop, just one really bad
rate at the start.
Wundergage #2:
Gage #2 looks like a lagging average
rate for the preceeding hour that eliminates the variability.
Wundergage #3:
Gage #3 looks like a lagging average
rate for the preceeding hour that eliminates the variability.
Wundergage #4:
Gage #4 looks like a lagging average
rate for the preceeding hour that eliminates the variability.
Wundergage #5:
Gage #5 looks like a lagging average rate for the preceeding hour that died.
Wundergage #6:
Gage #6 looks like a lagging average
rate for the preceeding hour that eliminates the variability.
After further review of all the Wunderground gages I've recently used in other
studies, the Beech Mtn #1 gage above is the only one I can find correctly
reporting the hourly rainfall rate 'HourlyPrecipIn' so my apologies to the Blue
Ridge Mtn folks. Apparently the new standard rainfall rate
'HourlyPrecipIn' reported each 5-minutes is total rainfall for the past 60
minutes which who the heck cares! That's a crying shame. To get the
5-minute increments,
'dailyrainin' must be differenced.
For my other current study at Ft Lauderdale, FL, I have
had to redownload and replaced all 4 gage's unit values using the new
'dailyrainin' parameter. My GetRealtime.exe 07/02/2012 has been
updated to make this an easy task. Live and learn.
For more radar adjustment stategies and comparison of N0Q and Level 2
go here or for a
list of my studies go here.
|