|
|
Summary of what lies below
Current Year
Past Years
(The Burro Creek Basin study has been extended on my web page
Runoff_BurroCrAZ.)
***GetRealtime is my free
Windows program that automates downloading free real-time hydrologic and
meteorlogical data at scheduled intervals for display. Supports USGS,
Wunderground, USBR, COE, USCS Snotel, CDEC, CIMIS, and NOAA WSR-88D radar for
continuous computation and simulation and it's also
free.***
Being in the Arizona deserts, these 4 basins have relatively few rainfall runoff
events so calibration may take a few years... I'm kidding. And many of the
largest runoffs come in winter with rainfall on snow in the upper elevations.
Not sure how to deal with that. Lets see how it goes. All but the
Burro Creek gage has a tipping bucket and daily rainfall accumulation
comparisons for these gages are shown at the bottom of this page.
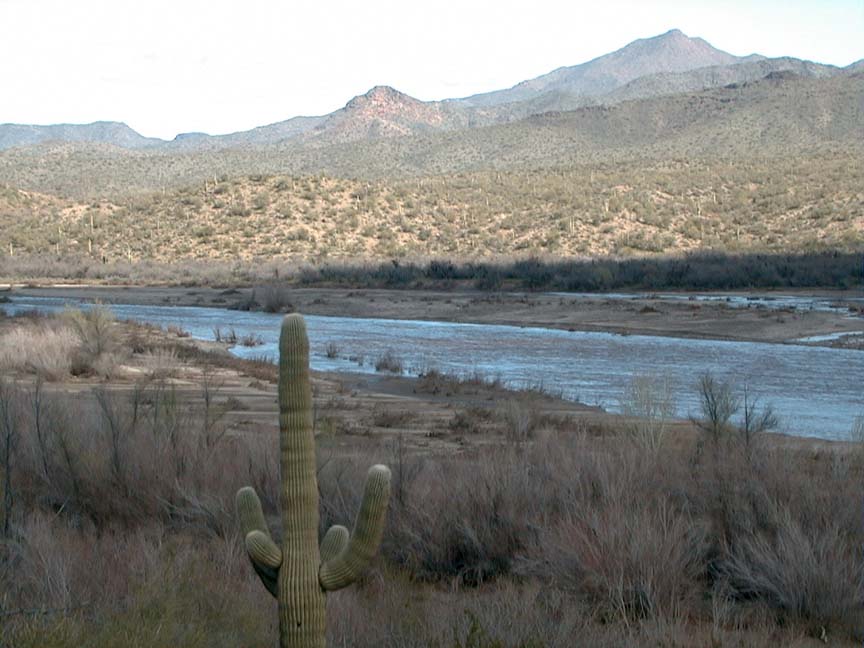
Diamond Creek flows into the Colorado River of the Grand Canyon above Lake Mead.
Big Sandy, Burro Creek, and Santa Maria combine above the COE's flood control at
Alamo Lake to form the Bill Williams River that flows into Colorado River just
above Paker Dam. These desert "rivers" and "creeks" can often be bone dry
one minute and hell's fury the next and NEXRAD can tell you Why... or Nothing.
;) The results below come from continuous rainfall runoff modeling in
real-time so once the model parameters are set in the GetRealtime.exe setup the
real-time results are on their own until/if parameters are changed (initial
loss, costant loss, % impervious, recession ratio). Only the initial loss
is self adjusting. I know when winter comes radar overshoot will leave these basins high
and dry with Nothing at these distances. So just cool your tamales and
stop asking Why.
1) USGS Gage 09404208 Diamond Creek near Peach Springs, AZ with radar ESX-Las
Vegas
2) USGS Gage 09424450 Big Sandy River near Wikieup, AZ with radar ESX-Las Vegas
3) USGS Gage 09424447 Burro Creek near Bagdad, AZ with radars ESX-Las Vegas &
FSX-Flagstaff
4) USGS Gage 09424900 Santa Maria River near Nothing, AZ with radars
FSX-Flagstaff & IWA- Phoenix
(Note that these GetRealtime setups have been changed on July 1, 2012 to the new
SCS Curve Number Method for continuous simulations as shown above graphs below)
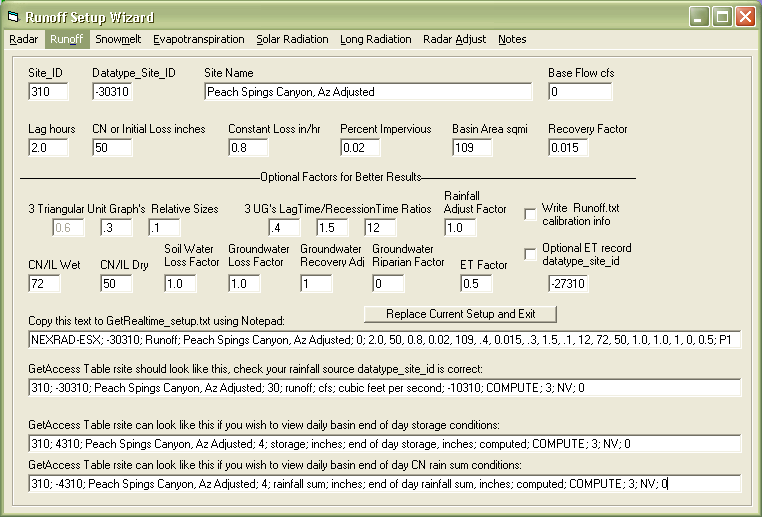
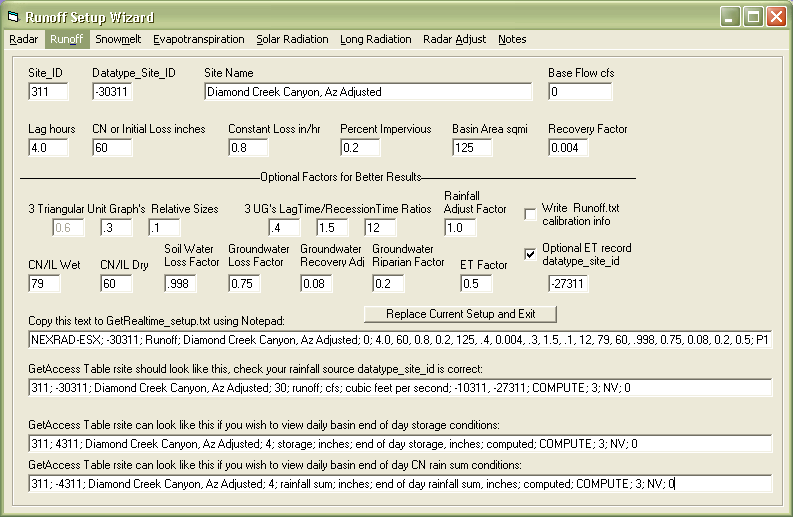
1) USGS Gage 09404208 Diamond Creek nr Peach Springs, AZ
The Diamond Creek gage basin shown below was subdivided into the Peach Springs
Canyon and Diamond Creek Canyon sub areas.
For help in using GetMapArea and GetNexrad to set the basin boundary and point
files go here for an
example. The Peach Springs Canyon subarea centroid is 80 miles east of
the ESX-Las Vegas radar and the Diamond Creek Canyon subarea centroid is 90
miles east of the ESX radar.
The Peach Springs Canyon subarea runoff GetRealtime_Setup.txt coefficients:
NEXRAD-ESX; 30310; Runoff; Peach Spings Canyon, Az N0r; 0; 7.0,0.85,0.2,0,109;
P1
(7 hr lag, 0.85 inch initial loss, 0.2 in/hr
constant loss, 0 % impervious, 109 sqmi)
The Diamond Creek Canyon subarea runoff GetRealtime_Setup.txt coefficients:
NEXRAD-ESX; 30311; Runoff; Diamond Creek Canyon, Az N0r; 0;
3.5,0.65,0.2,0.5,125; P1
(3.5 hr lag, 0.65 inch initial loss, 0.2 in/hr constant loss, 0.5 % impervious,
125 sqmi)
The Routing GetRealtime_Setup.txt coefficients:
ROUTE; 1313; Flow; Routed Peach And Diamond Creeks, Az
Route file reads:
Combine Peach Canyon and Diamond Canyon at mouth
GET 4 30310 Peach Springs Canyon
GET 4 30311 Diamond Creek Canyon
COMBINE
END
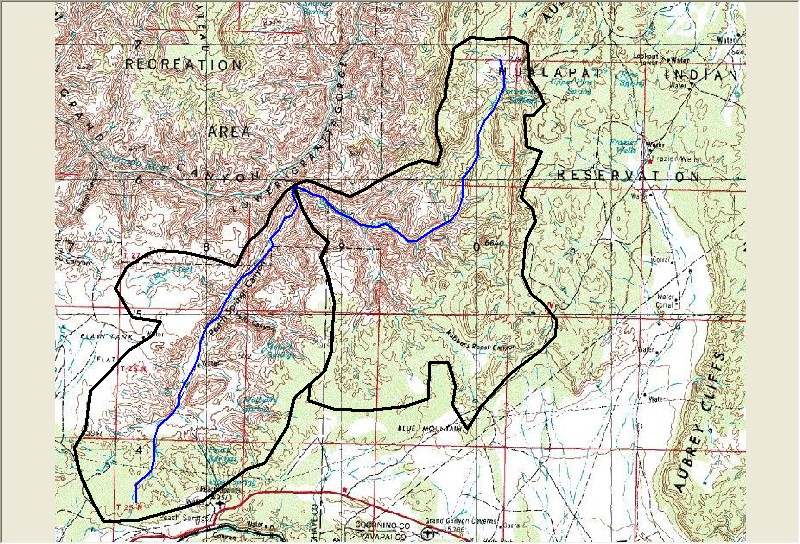
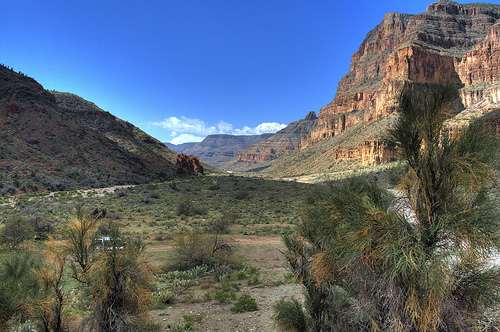
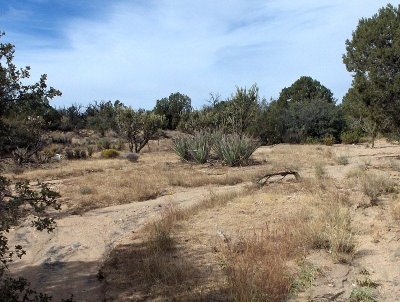
View of Peach Springs Canyon area:
A calibration was made on Peach Springs Canyon as shown below. Little
rain fell on Diamond Creek Canyon which had only a few cfs runoff and made
things simpler. Looks like the USGS gage was filling after the peak then
cutting so runoff volume was not compared. These real-time values have been
red lined by the USGS and will probably be recomputed after the peak.
2) USGS Gage 09424450 Big Sandy River near Wikieup, AZ
The Big Sandy River basin shown below was determined by cut and paste of
the HUC by the
EPA's Enviromapper into GetMapArea.
For help in using GetMapArea and GetNexrad to set the basin boundary and point
files go here for an
example. Update: GetMapArea now has the USGS National Map Viewer in full screen
with HUC's and is better than the Enviromapper or just about anything else.
The basin area centroid is 95 miles southeast of
the ESX-Las Vegas radar. The Big Sandy Gage is downstream of Burro Creek
(see below) and the Daily Peak graph shows both the runoff from the Big Sandy
basin combined with the Burro Creek runoff.
The Big Sandy River area runoff GetRealtime_Setup.txt coefficients:
NEXRAD-ESX; 30333; Runoff; Big Sandy River, Az Esx; 0; 11,0.5,0.2,0,1760; P1
(11 hr lag, 0.5 inch initial loss, 0.2 in/hr constant loss, 0 % impervious,
1760 sqmi) w/o Burro Cr
The GetRealtime_Setup.txt routing says:
ROUTE; 1337; Flow; Routed Combine Burro and Big Sandy only, Az
The routing file to route the Burro Creek and combine with Big Sandy runoff
reads:
title: 1337 Route Burro Cr to Alamo and combine with Big Sandy ONLY for Big
Sandy Gage Comparison
GET 4 30332 Burro Creek FSX ...the 4 means 5 minute unit values...not hourly or
daily
ROUTE Tatum 5.0 Route to Alamo with 5 hour travel time
GET 4 30333 Big Sandy River ESX
COMBINE
END
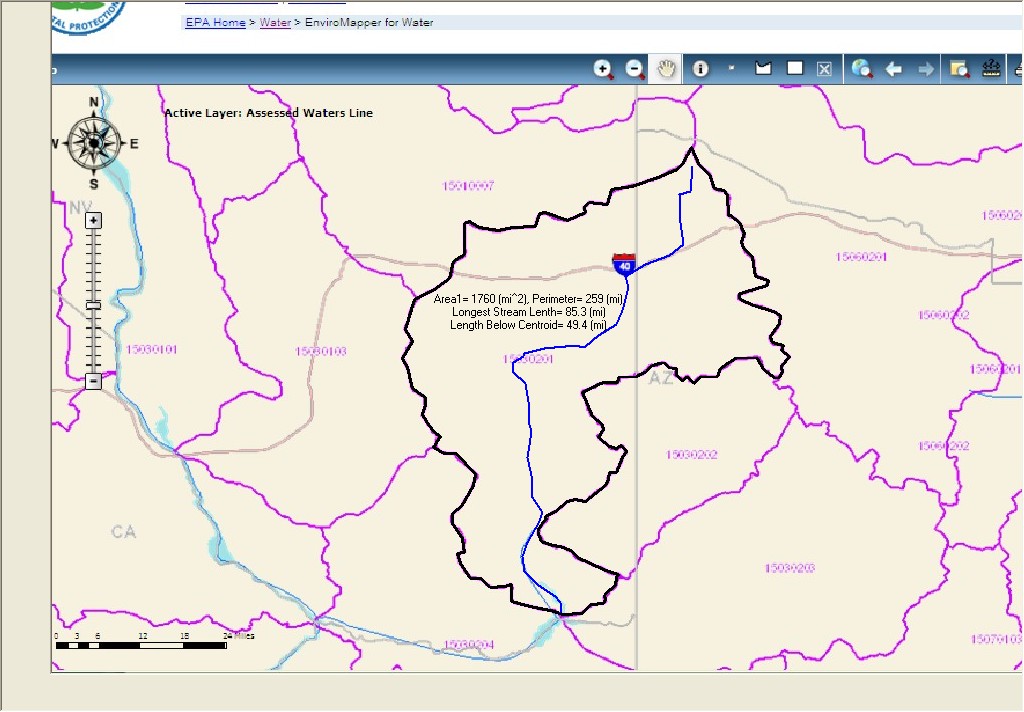
View of Big Sandy River basin area:
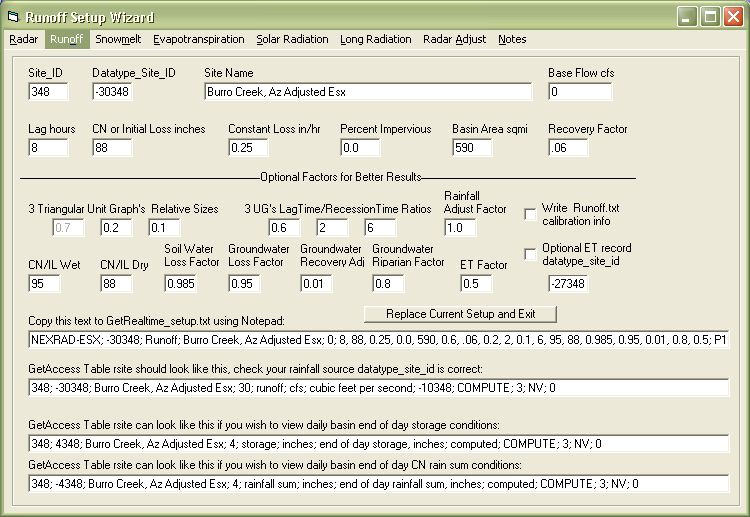
3) USGS Gage 09424447 Burro Creek near Bagdad, AZ
The Burro Creek gage basin shown below was determined by cut and paste of
the HUC by the
EPA's Enviromapper into GetMapArea.
For help in using GetMapArea and GetNexrad to set the basin boundary and point
files go here for an
example. The basin area centroid is 115 miles southeast of
the ESX-Las Vegas radar and 117 miles west of the FSX-Flagstaff radar and will have
rainfall and runoff determined from both radars.
The Burro Creek area runoff GetRealtime_Setup.txt coefficients:
NEXRAD-ESX; -30332; Runoff; Burro Creek, Az Esx; 0; 24,0.8,0.2,0,590; P1
(24 hr lag, 0.8 inch initial loss, 0.2 in/hr constant loss, 0 % impervious,
590 sqmi)
NEXRAD-FSX; 30332; Runoff; Burro Creek, Az Fsx; 0; 24,0.5,0.2,0,590; P1
(24 hr lag, 0.5 inch initial loss, 0.2 in/hr constant loss, 0 % impervious,
590 sqmi) try a different initial loss
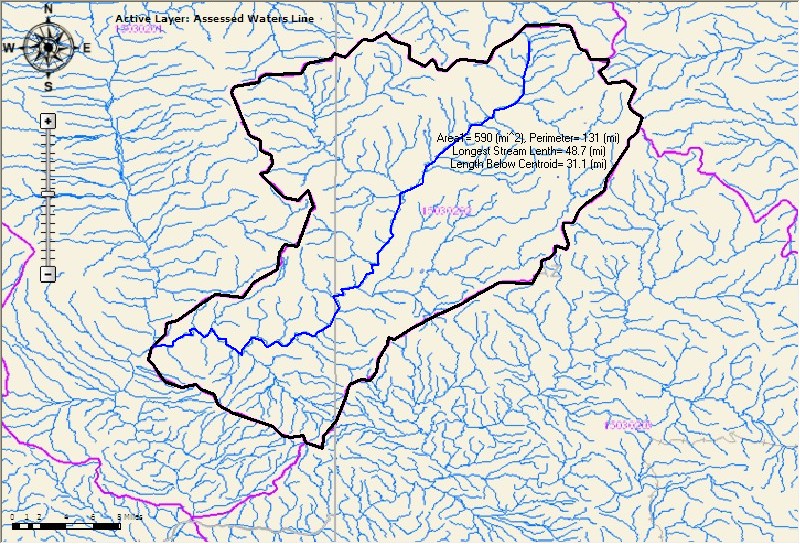
View of Burro Creek basin area:
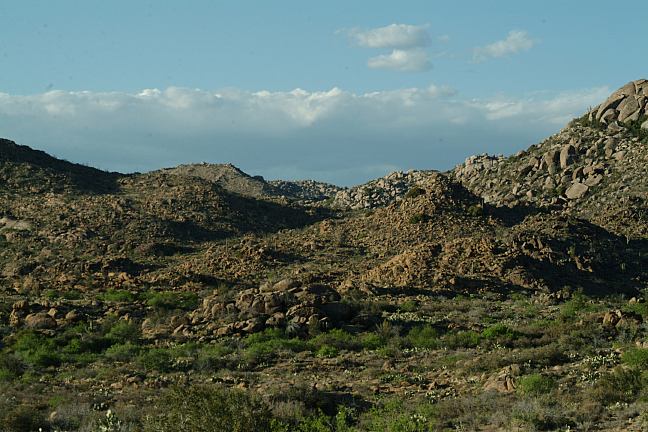
A calibration was made on Burro Creek with the ESX-N0R rainfall as shown below.
Looks like the upper reaches got saturated and oozed out some flow 32 hours
after the peak rainfall. Not much of a peak in rainfall. Well this
is something to look at until something better comes along. I used a 24
hour lag as sort of a way to match the peak flow. The ESX and FSX radar
daily basin average rainfall is shown below on the Daily Peak Flow graph.
4) USGS Gage 09434900 Santa
Maria River near Nothing, AZ
The Santa Maria gage basin shown below was determined by cut and paste of
the HUC by the
EPA's Enviromapper into GetMapArea.
For help in using GetMapArea and GetNexrad to set the basin boundary and point
files go here for an
example. The basin area centroid is 109 miles northwest of
the IWA-Phoenix radar and 103 miles west of the FSX-Flagstaff radar and will have
rainfall and runoff determined from both radars.
The Santa Maria River area runoff GetRealtime_Setup.txt coefficients:
NEXRAD-IWA; -30331; Runoff; Santa Maria River, Az Iwa; 0; 9,0.5,0.2,0,1184; P1
(9 hr lag, 0.5 inch initial loss, 0.2 in/hr constant loss, 0 % impervious,
1184 sqmi)
NEXRAD-FSX; 30331; Runoff; Santa Maria River, Az Fsx; 0; 9,0.5,0.2,0,1184; P1
(9 hr lag, 0.5 inch initial loss, 0.2 in/hr constant loss, 0 % impervious,
1184 sqmi)
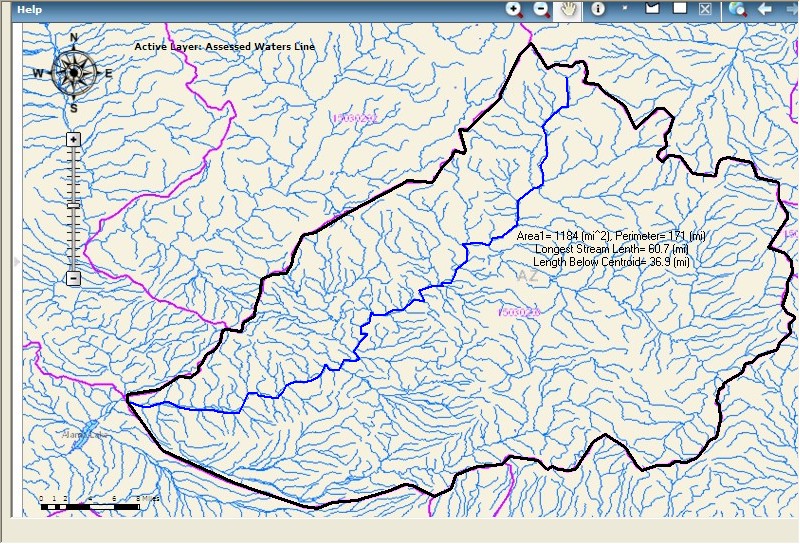
View of Santa Maria River basin area:
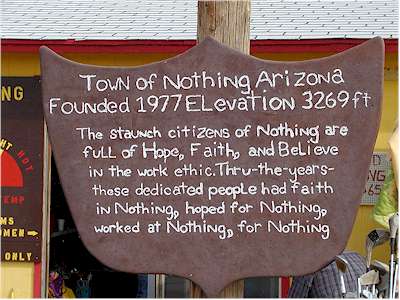
And just to show there is such a place, here is Nothing, AZ, just beyond Why and
west of Bagdad... stop! you're giving me the Wikieups:
Sounds like the guys at Nexrad headquarters. ;0 ...uh oh... Ok,
yes NEXRAD saves 100's of lives and billions of dollars each year, but if you
ever had your radiator boil over or want your kids in the back seat to shut up
on that long hot drive to Vegas in the middle of the Arizona summer heat... then
it takes stopping at Nothing to do what Nexrad cannot yet do... Is Nothing
sacred... some say so. ;)
The standard Convective Z-R radar to rainfall relation was used Oct 1 - Nov
1, 2010 then West Cool Z-R to May 18, 2011.
The standard Convective Z-R radar to rainfall relation was used Oct 1 - Nov
1, 2010 then West Cool Z-R
to May 18, 2011.
The standard Convective Z-R radar to rainfall relation was used Oct 1 - Nov
1, 2010 then West Cool Z-R
to May 18, 2011.
The standard Convective Z-R radar to rainfall relation was used Oct 1, 2010
to present.
Point Rainfall and 1 sqmi Runoff Comparisons:

New SCS Curve Method Loss for Continuous Simulation
And
With Daily Ratio Adjusted 5-Minute Basin Average Rainfall
The
Diamond Creek basin average 5-minute ESX radar rainfall was adjusted using an
daily average rainfall ratio at the following tipping bucket point locations:
1) USGS
Diamond Creek rainfall gage.
2)
Frazier Well Wundergage MFZWA3.
3) Sierra Verde Wundergage KAZSELIG1.
The daily ratio was computed as the average of 3 gages divided by the average
of the 3 radar points.
USGS REMARKS.--Records poor.
The Burro Creek basin average 5-minute ESX radar rainfall was adjusted using an
daily average rainfall ratio at the following tipping bucket point locations:
1) USGS Santa Maria rainfall gage.
2) Camp Wood Wundergage MCPWA3.
3) Goodwin Mesa Wundergage MQGDA3.
The daily ratio was computed as the average of 3 gages divided by the average
of the 3 radar points.
USGS REMARKS.--Records fair except for low flows, which are poor.
Calibration parameters for Jul 3, 2012 to Sep 12, 2012:
The
Big Sandy basin average 5-minute ESX radar rainfall was adjusted using an
daily average rainfall ratio at the following tipping bucket point locations:
1) USGS
Big Sandy rainfall gage.
2) Sierra Verde Wundergage KAZSELIG1.
3) Goodwin Mesa Wundergage MQGDA3.
The daily ratio was computed as the average of 3 gages divided by the average
of the 3 radar points.
USGS REMARKS.--Records fair due to unstable channel conditions. Diversions above
station for irrigation of about 3,800 acres, mostly bypumping from ground water.
Calibration parameters for Jul 3, 2012 to Oct 1, 2012:
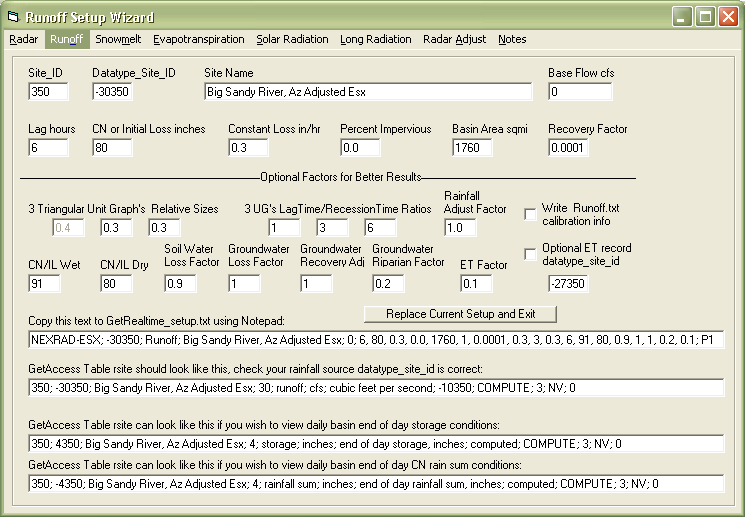

Routing File:
Route Burro Cr to Alamo and combine Big Sandy
GET 4 -30348 Burro Creek Adjusted ESX 4=unit values
ROUTE Modpul BurroCrXsec.Rat Route to Big Sandy Channel
ROUTE Modpul BigSandyXsec.Rat Route to Gage
ADD -10 burro base flow doesnt show up
GET 4 -30350 Big Sandy Adjusted ESX
COMBINE
END
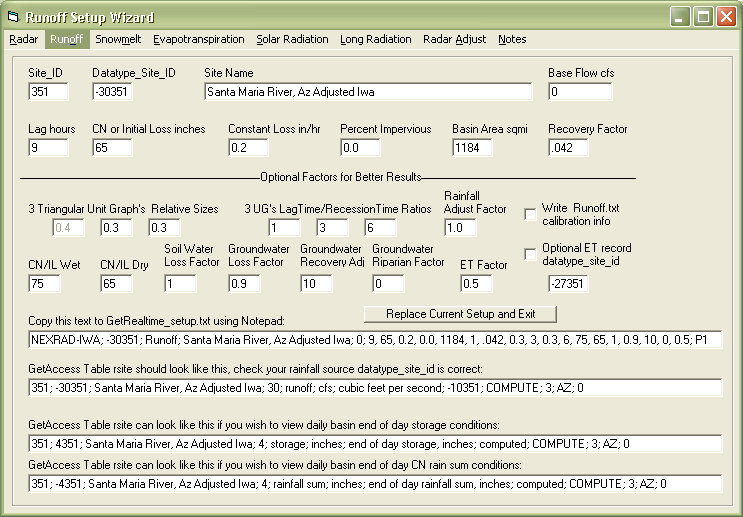
The Santa Maria basin average 5-minute IWA radar rainfall was adjusted using an
daily average rainfall ratio at the following tipping bucket point locations:
1) USGS Santa Maria rainfall gage.
2) Camp Wood Wundergage MCPWA3.
3) Goodwin Mesa Wundergage MQGDA3.
The daily ratio was computed as the average of 3 gages divided by the average
of the 3 radar points.
USGS REMARKS.--Records fair except for estimated days, which are poor.
Diversions above station for irrigation of about 5,300 acres, most of which is
by pumping from ground water.
Calibration parameters for Jul 3, 2012 to Oct 1, 2012:
Some additional page links about
ET and Nexrad Radar help and comparisons:
List of How To Videos on Youtube
Help Page for GetNexrad.exe
Nexrad Rainfall to Tipping Bucket Comparison
ET and Radar Rainfall along the Lower Colorado
River, AZ-CA
Nexrad Rainfall-Runoff Comparison Las Vegas
Valley, NV
Nexrad
Rainfall-Runoff Comparison San Jouqin Valley, CA
Nexrad
Rainfall-Runoff Comparisons in northwestern Arizona
Nexrad Snowfall Comparisons in western
central Sierras, CA
Weather Underground is a registered trademark of Weather
Underground, Inc www.wunderground.com

WEBSITE MAP


WU USGS USBR USCS CWRD NWS
More Free Downloads
Comments/Questions
Contact Me
Label
|
|