|
|
In addition to GetRealtime for downloading free hydrological and meterological
web data and simulations.
... here are some more free downloads for hydrologists and others.
1 Excel GetRegression.xls--regressions, interpolations, probability,
Pearson.
2 Excel ProbabilityGraphs.xls
3 Excel Example with GoalSeek/Tips--in stock pipe sizing example.
4 GetMapArea.exe--digitize screens of topos, Google Maps, etc; also
computes runoff with routings.
5 Excel GetFlowRecord.xls--complete system for maintaing a streamflow
record and database.
6 GetNexrad.exe--view Nexrad radar loops and compute point and area
rainfall.
7 VolumeTimer.exe--turns down PC volume during commercials.
8 CookingTimer.exe--simple timer with notepad for keeping notes on
times/recipes.
9 ChannelStorage.exe--creates normal depth trapazoidal channel elev, flow, volume
rating.
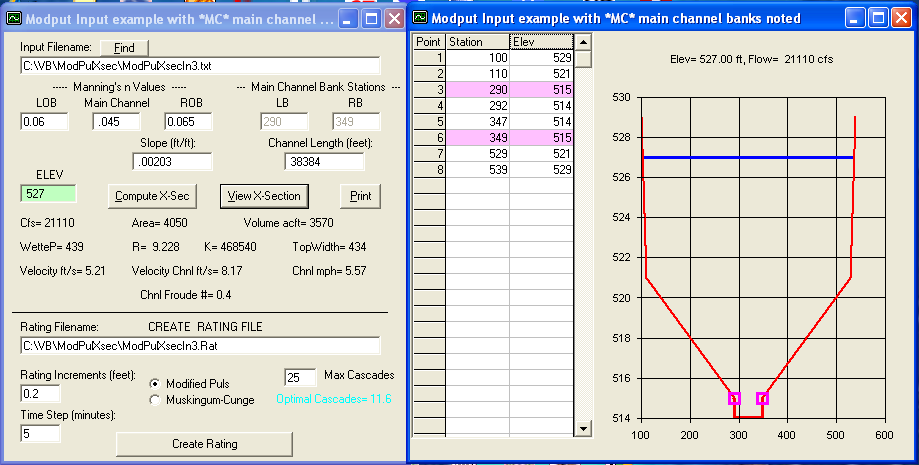
10 ModPulXsec.exe--creates normal depth channel
rating for Modified Puls and Muskingum-Cunge from typical x-section station, elevation pairs
w/Heatherman's optimal number of cascading reservoirs..
11 Excel ModPuls.xls--routes column of flows in Excel.
12 Excel RandomWalk.xls--stochastic rain generator with runoffs in Excel.
13 HurricaneAlex2010Gifs--Radar image files of Hurricane Alex as it came
ashore June 30, 2010.
14 Hurricane Isaac 2012 and more storm gif files....
15 Topo Maps on Google Earth--Best topo map tip since the invention of
the theodolite. Also HUC's.
16 ExampleXLrangeToGif.xls--Convert an Excel data range to a Gif file and FTP
to your web host.
17 May 20, 2013 Oklahoma Tornado Level 2 debri ball and hook echo
sequence.
18 Critical Flow Slope computations.
19 7-day weather forecast and Sun & Moon & current obs.
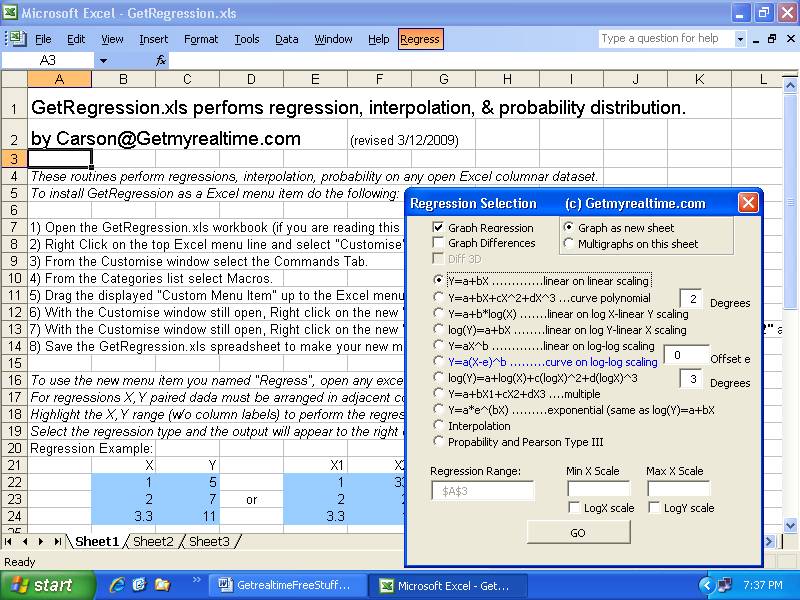
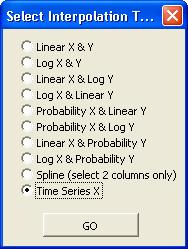
1) GetRegression.xls--(revised Sep 1, 2017) MS Excel menu macro for
quickly computing/graphing regressions, interpolations, and probability
distributions on any Excel sheet. Includes Y=a(X-e)^b used in sediment and
streamflow ratings where 'e' is the offset or point of zero flow.
|
|
|
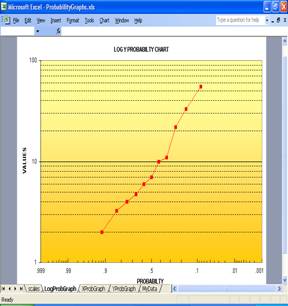
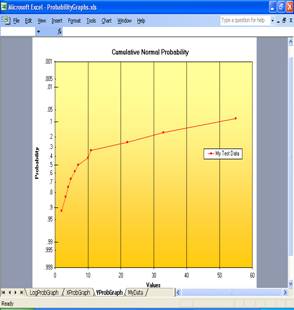
2) ProbabilityGraphs.xls--MS Excel workbook for creating
probability charts. You might not have use for this xls if you added the
the above GetRegression.xls to your Excel Menu bar.... but I could be wrong.
3) Great Looking Excel Tips--Examples and videos for creating
most excellant Excel spreadsheets by a pro at CSU. I attended one of his
workshops years ago and it opened my eyes to the world of Excel.
Darrell G. Fontane
Beginners to experts will find his stuff very useful and for adding that
finishing touch. Be sure to play the video links over on the right of his
web page. Dr Fontane will be adding more examples soon as his work load
allows so stay tuned. MS Office 2003 users can still open his downloads. Just
follow his tip at the top and Excel will prompt you do install a free update for
reading 2007 files.
http://www.engr.colostate.edu/~fontane/EXCEL_Tips/index.html
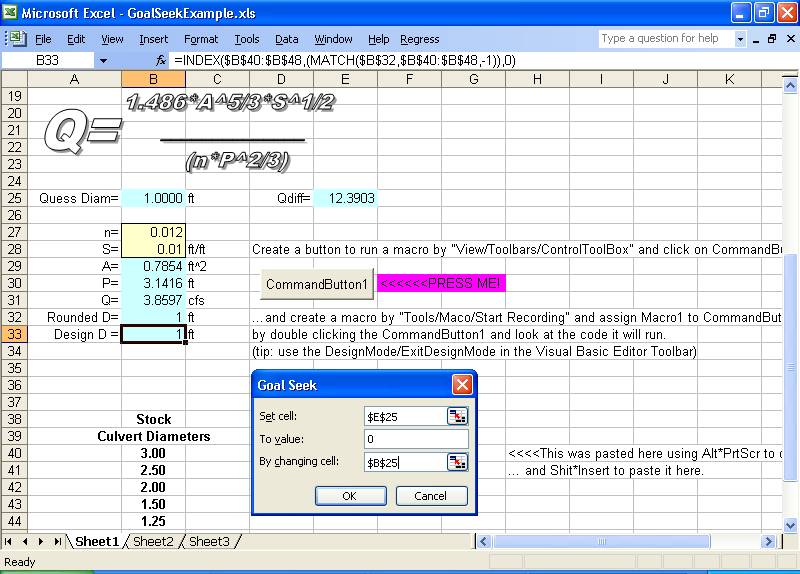
3) Excel Example with GoalSeek/Tips--Example worksheet using a
command buttton and Excel's built in GoalSeek to solve Mannings flow equation
area given flow from the Rational runoff method. Tips include function
Index() for looking up values for culvert sizes in stock.
Ok, so I'm no Dr. Fontane...
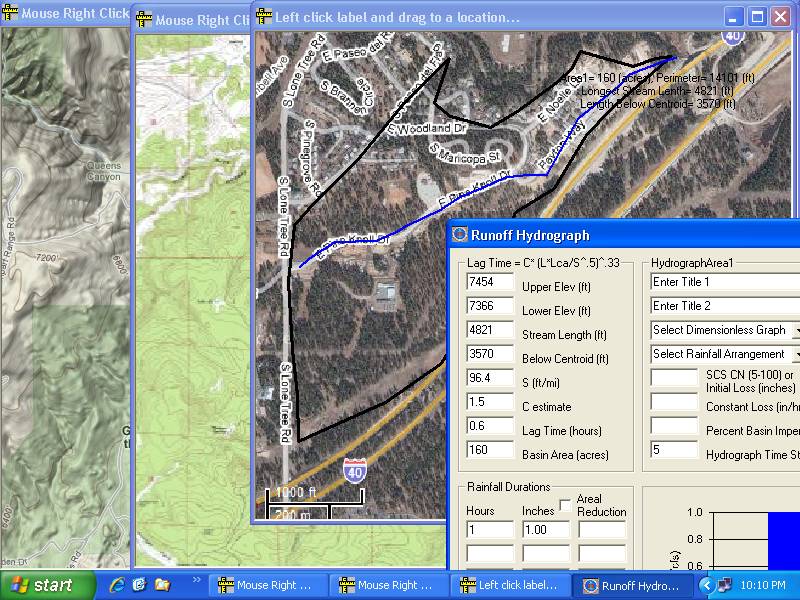
4) GetMapArea.exe 4.0.0--Defines drainage area boundaries and stream lengths
with centroids on free topo map screens. Reads topo maps from Google Maps in full screen mode as a menu selection for dislplay and
determination of Lat and Long.
Also try the full screen USGS map
viewer option in GetMapArea with Content, Base Data Layers = Hydrography
checked. It's very buggy. Do not set scale with the scale legend, add 'Scanned
topo' with 6 mile township or 1 mile section lines. Better yet, use
the map viewers 'Find Coordinates' on it's tool bar to get diagonal Lat/Long
scaling points, then digitize the boundary in GetMapArea using Lat/Long scaling,
the preferred method. Buggy as it is, this will soon become
your map source of choice for drainage areas.
It is just amazing in how far free GIS info has come.
Instead you might try
GoogleKML2Text.exe to read Google Earth Pro created polygon KML files and convert
to text boundary lat-longs for use by LatLongPixelsFromFile.exe
Boundaries and lines are set by mouse clicks.
Saves boundary and stream coodinates to text file and annotated map to jpg or bmp
graphic file. Rainfall durations and runoff methods included. Help is available on its menu
if you're Rational.
Get MapArea quickly compares effects of dimensionless graph selection,
lag, loss method, storm arrangement and routing method... and yes, I didnt
forget the Rational Method... why I have no idea. ;-) Tatum's travel time,
Muskingum, and Modified Puls routings included for routing and combining
hydrographs saved to file. A triple
triangular unit hydrograph method
and a linear
reservoir method have been added for calibrating rainfall
runoff coefficients for GetRealTime.exe. Reads rainfall data from
the GetAccess HDB database or text file. For an example of a case study
you can follow for setting up GetRealtime for automated Nexrad Radar-Runoff
computations go here. For a Youtube
Video using Google Maps with GetMapArea go here. And for
more
great sources for maps, check out topo's and huc's on Google Earth at the bottome
of this page.
Why just be Rational?... try some of this Dimensionalessness!
Video for Getting Started
with GetMapArea

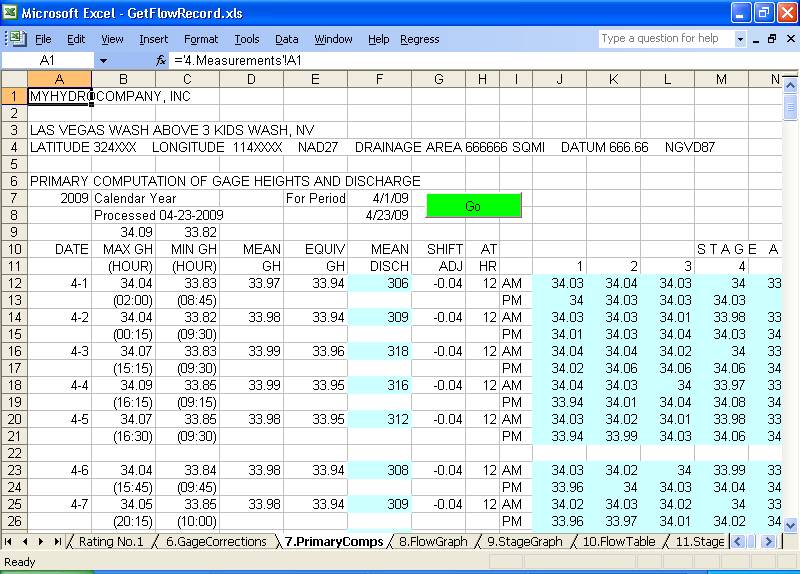
5) GetFlowRecord.xls--(updated 10/13/09) An Excel workbook with 15
worksheets for computing, documenting, and storing stream flow records using
methods of the the US Geological Survery as described in online water supply
paper:
http://pubs.usgs.gov/wsp/wsp2175/
Complete system with software to maintain the hydrologic database (HDB) once you have
brought your field gage height record back from the stream side data logger.
(I don't have a data logger so I used GetRealtime to download realtime USGS gage
heights... I said I was no Dr. Fontane. ;-) )
Overview of the GetFlowRecord process:
1) Create rating. Sheet4.Measurements.
2) Enter shifts to apply. Sheet4.Measurements.
3) Load field GH's to HDB. Sheet0.LoadHDB.
4) Enter GH corrections. Sheet6.GageCorrections.
5) Retrieve field GH's from HDB and apply corrections. Sheet6.GageCorrections.
6) Run primary computations on GH's. Sheet7.PrimaryComps.
7) Write final GH and Flow to HDB. Sheet6.GageCorrections.
8) Document, document, document...
|
|
|
|
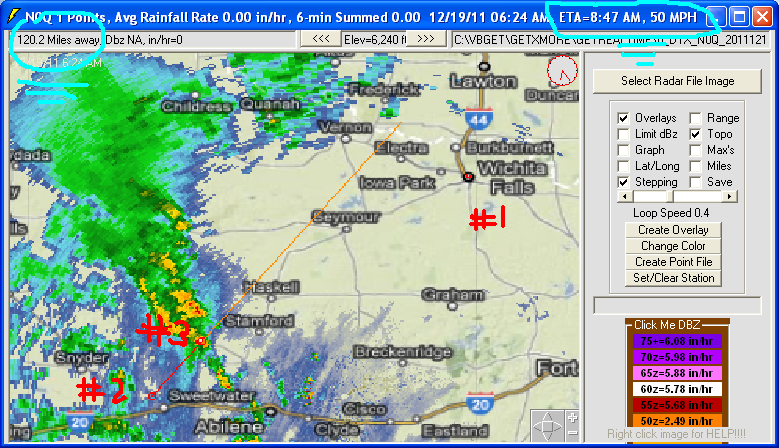
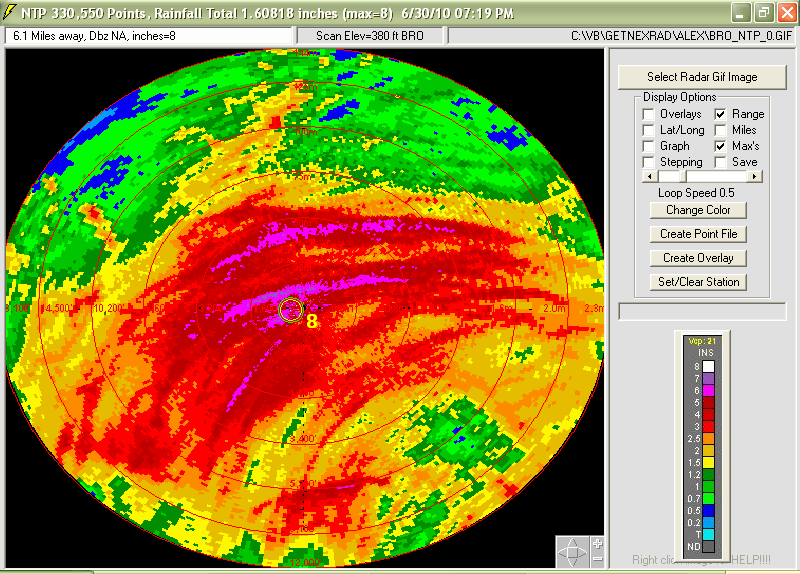
6) GetNexrad
4.1.3
GetNexrad.exe is a tool used to view NOAA WSR-88D Nexrad doppler radar images and compute point and
area average rainfall and to generate the basin point file used by
GetRealtime.exe for automating computaion of a basin average rainfall time
series in real time. Also NASCAR racing fans can try to out best crew chiefs
like Larry McReyonlds about how near the
rain is to the race track. GetNexrad will
compute the ETA of rain cells arriving (and leaving) at the race track.
Traditional area average rainfall is obtained by rainfall gages located in or
near the area of interest and averaging the rain gage amounts using many
methods. If you’re lucky you might
find a rain gage nearby or you would have to install and maintain a network of
rain gages yourself, The tools
presented here will allow you to create point rainfall rates ANYWHERE in the US and greatly improve area averaged amounts
and best of all IT’S FREE!!!
The National Oceanic and Atmospheric Administration (NOAA) is a fantastic
government agency responsible for the majority of the weather data and alerts in
the United States.
Using the publicly available and easily accessible reflectivity data from one of
the WSR-88D class radar systems (NEXRAD), the tools presented here will show you
how to choose a location and set up virtual rainfall collection for a precise
geographical area. Please note that this is not a substitute for severe weather
alerts issued by the NWS, but GetNexrad will even sound an alarm when alerts are
issued.
NOAA’s explanation of the WSR-88D radar
system. (http://www.roc.noaa.gov/)
Software Requirements—GetMapArea is a must for
creating the basin boundary except for point locations. Optionally
for automating real time collection, storage, and display of the
basin rainfall requires GetRealtime. These softwares are available
online for free at GetNexradHelp
.
Image acquisition:
The WSR-88D class radar systems have many acquisition modes for developing precipitation. The most commonly used form of radar energy return
mapping are the Base and Composite Reflectivity maps, and also the 1-Hour Total
Precipitation. The 1-Hour Total image has had additional processing to
better correlate with actual rainfall for different seasons and areas, but don't
believe it. We
can use any of these three images for the processing of localized precipitation
information.
To
begin finding radars, fire up your Windows Internet Explorer and go here to
http://radar.weather.gov/
Click on the Las Vegas NV ESX radar point on the USA map Enhanced Version tab.
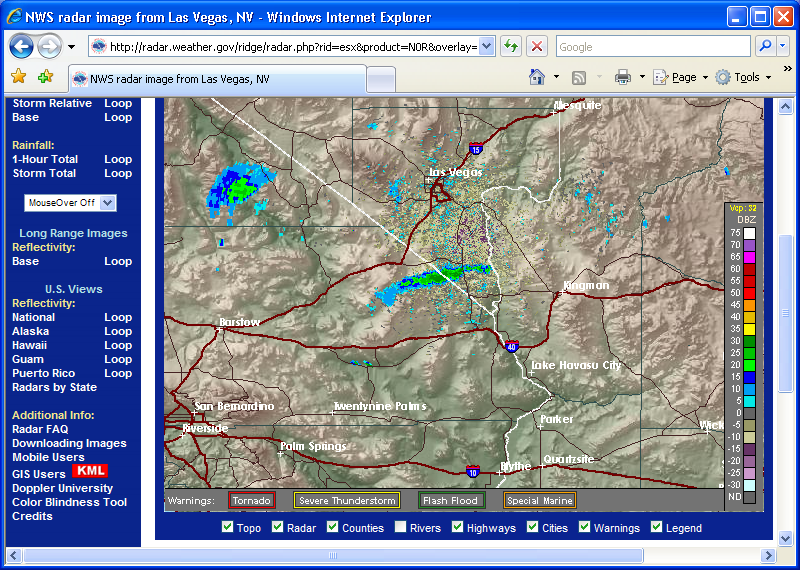
GetNexrad will take the information in the NOAA N0R or NCR radar image and
convert it to the one below where basin area average rainfall rate and point
rainfall rate can be displayed. (rate >> inches for
retrieval time step... knuckle head<<<me).
The N1P 1-Hour Total is treated also as a rate of inches/hour in 5-minutes.
After playing with GetNexrad, I hope you will take the next step in setting
up GetRealtime to automate retrieval, storage, and display of your basin of
interest’s rainfall amounts and learn how to compute runoff and route it. GetMapArea is an easy and fun way to get
started computing runoff.
For comparisons of Nexrad radar rainfall amounts to actual rainfall gage values go here.
For comparisons of Nexrad radar rainfall-runoff to actual USGS gage hydrographs go here.
|
|
|
|
|
|
|
|
7) VolumeTimer.exe--(updated 9/16/09)
Tired of those annoying commercials when listening to online radio on your PC???
Well, just set the times for turning down the commercial volume and then back up
automatically. For you talk show enthusiasts just think of it... No more moronic public service ads from the nanny state at tax payer expense or top of
the hour mainstream news propoganda. Nervana!!! |
|
|
|
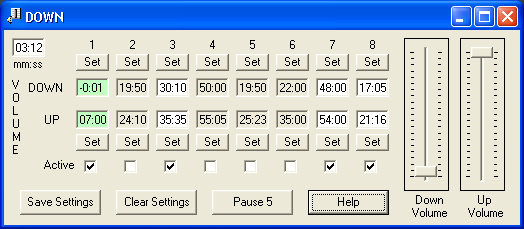
If this Volumetimer.exe does not work for you try VolumeTimer2.exe.
8) CookingTimer.exe--(updated 4/8/10)
Need a simple timer alarm for use while on your PC and trying to cook a turkey
too? Well, here you go:
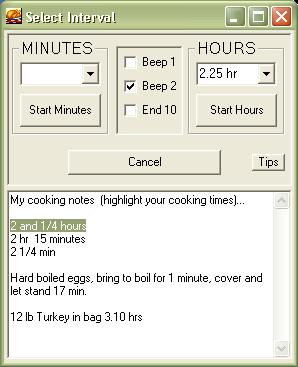

***** Well don't that beat all. Pull your hair out trying to get
hydrological data when all people want is an easier way to cook their
turkey!*****
9) ChannelStorage.exe--(updated 12/1/2013)
Creates a trapezoid channel's depth-flow-storage rating file used by
GetMapArea.exe, GetGraphs.exe, and now GetRealtime.exe for their Modified Puls routing method.
Includes optimized cascades.
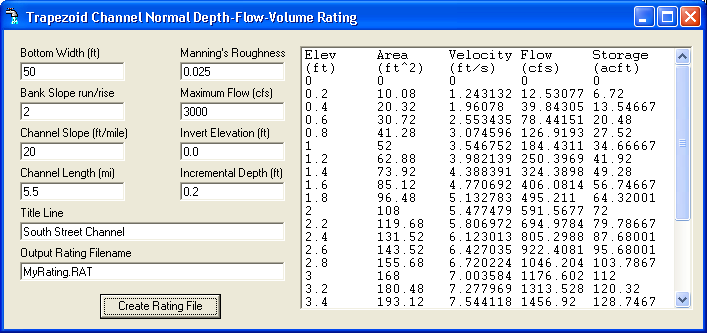
(Note: ChannelStorage and ModPulXsec use Manning's normal depth.
ModPulXsec.exe should give the same results as Hec-1 or Hec-Ras given a steady
flow value in cfs at 1 cross-section with a main channel and left and right bank
over flow channels all the same length (sum of the 3 conveyances).
ModPulXsec does not do multi-xsection energy accounting, just plain old normal
depth. I found it to give the same results for modified puls routings for a
single average x-sextion as a rating doing 20 x-sections in Hec-Ras. It depends
on if you just want to route a flow or if you actually want to look at
elevations at 20 x-sections up and down the reach..
ChannelStorage.exe is even simpler where a trapazoidle channel is given with
normal depth..
If you have culverts and ponding and loop ratings with channel slope less than
10 ft/mile, GetRealtime can shell Hec-Ras unsteady flow projects and read the
results back into GetRealtime.
Don't over engineer this if you just want to route a hydrograph from A to B. Put
your effort in getting good rainfall if you want to over engineer something.)
10) ModPulXsec.exee--(updated 7/20/2014)
Creates a
channel ModPuls rating depth-flow-storage rating file used by
GetMapArea.exe, GetGraphs.exe, GetRealtime.exe for their Modified Puls
routing method. . Includes optimal number of cascading reservoirs. Also
computes Mukingum-Cunge K & X and it's cascades.
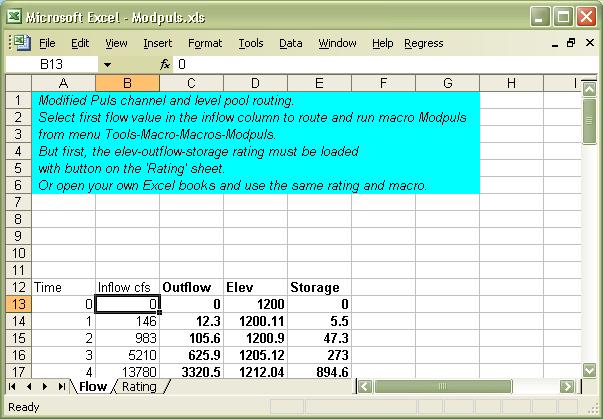
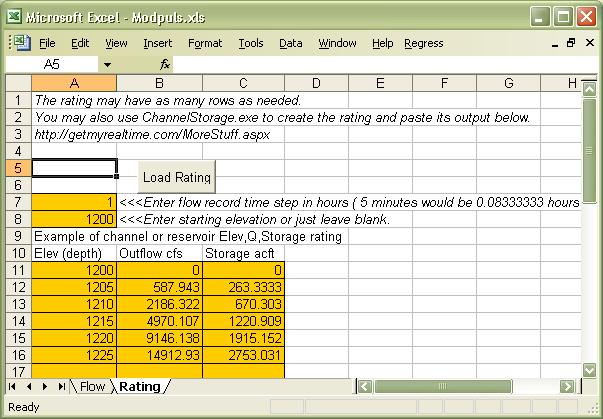
11) Modpuls.xls--(updated 5/24/10)
Route flood runoff hydrograph inflows in your Excel Workdbook using the Modified Puls channel and level
pool method. Modified Puls has always produced the best channel routings
for me. (probably because I never could get the hang of the guess work using the Muskingam
method correctly.)
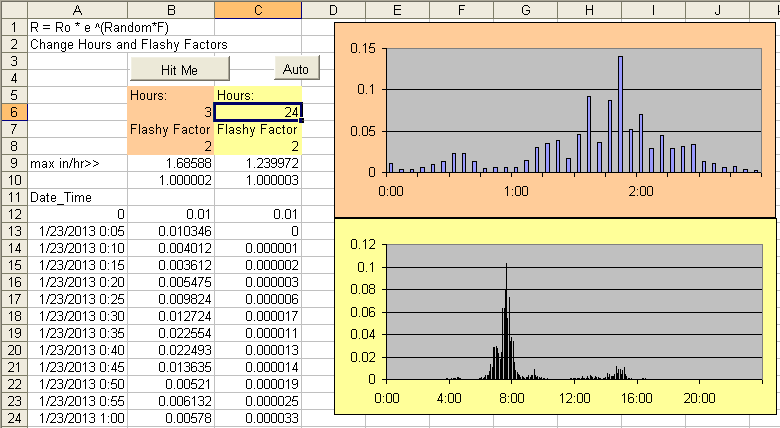
12) RandomWalk.xls--(Feb 26, 2013)
Monte Carlo simulation of rainfall sequences and a simple runoff setup in Excel.
Fun to play with.
More info here about stochastic rainfall:
http://getmyrealtime.com/help.aspx#MultipleRuns
Here are my comments in the VB code so you take it from here:
''Type in numbers only in colored areas or you might screw up things.
'This VB rainfall pattern code is what is used in GetRealtime.exe.
''The parameters HOURS, FLASHYFACTOR, and STORMS will produce what you see
''in this workbook... so do your homework here.
''Although loss methods recover for multi-day durations, the ground water
''return is not used nor ET as in GetRealtime so volume may differ but peaks
should be close.
''The patterns generated are intended to check a project performance with
''reasonable assumptions without doing an in depth storm pattern analysis.
''Use the NOAA Atlas:
http://dipper.nws.noaa.gov/hdsc/pfds/
''to see if you're in the ballpark for rainfall frequencies.
''Look at some Wunderground rainfall events nearby to get an idea for patterns.
''For basins, looking a radar basin average 5-minute rainfall may be better.
''For basins your flashy factor could be reduced with basin size???
''GetRealtime's Monte Carlo will select the total rainfall and apply to 1
"
''The rainfall computed in GetRealtime is limited to 0.8 or 9.6 in/hr
''which is about a 100yr-5min max but I have not here.
''I havent, but if higher peak rainfall is needed within a storm flashy
''factor you could randomize the range for the flashy factor or
''randomize the flashy factor within the storm somehow.
''Another simple thing to randomize would be the storm1 duration to
''increase peak rainfall. Knock yourself out.
13) HurricaneAlex2010Gifssss--
NEXRAD
Gif image files of Hurricane Alex as it came ashore June 30, 2010. Use
GetNexrad.exe to view images as loops. Includes Brownsville, Texas KBOR
radar gifs for N0R, N1P, NTP, NET, N0V, N0S... etc. every 5 minutes for viewing
as 1-hour loops. See HurricaneAlexReadMe.txt included for more info.
The NTP storm total rainfall even as it just started to come ashore is
amazing... to a desert rat.
14 More Storm Gif files...
15 Topo Maps on Google Earth--Here’s a slick little trick indeed!
This is
the best map tip since gas stations handed out free road maps. Experiment with
the transparency to get the best of both worlds or just the topo world. (For
those like me that can't find the 'Places' menu it is under 'View' > 'Sidebar'.)
Great for use with GetMapArea.exe above. And also don't forget to check
out HUC boundaries and streamlines on
Google Earth
here (try the rastor first). Or the amazing USGS map
viewer with Content, Hydrography and Contours. I remember when I had
to walk 5 miles to school up hill both ways and back home for lunch... these
kids today... and their music is just noise. ;-)
U P D A T E Sep 15, 2020:
Google Earth EPA WATERS KMZ streams and catchment boundaries as
of Sep 15, 2020:
https://www.epa.gov/waterdata/viewing-waters-data-using-google-earth
Google Earth USGS Topo Quads KMZ as of Sep 15, 2020:
http://www.earthsurvey.us/quads/quads.html
16 ExampleXLrangeToGif.xls--Excel VBA code example to convert your Excel
data table or range to a Gif picture file and automatically send it to your Web
Host directory. The GIF image greatly reduces the complexity of
maintaining data tables on your web pages.
17 Oklahoma Tornado Level 2 Images--May 20, 2013 Oklahoma Level 2
debri ball sequence I downloaded with the NWS Weather Toolkit for display by
GetNexrad. Always install GetNexrad in a separate directory for Toolkit
images as opossed to real-time images to keep overlays seperated.
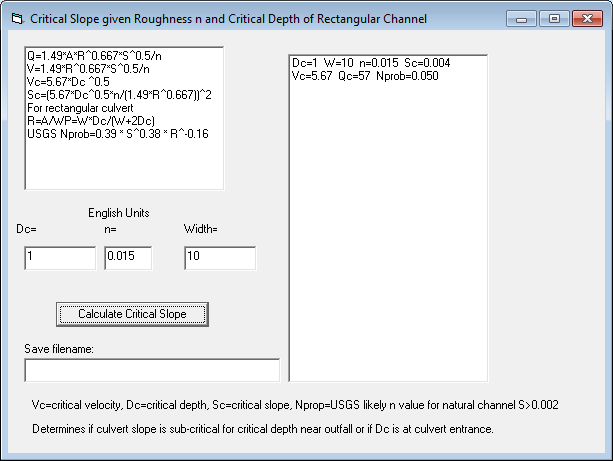
18 Critical Flow Slope--Calculate critical slope from roughness, width,
and depth for rectangular channels.
Link to
USGS critical depth discussion.
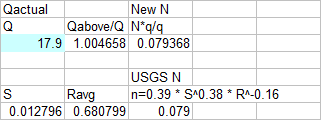
USGS probable roughness
n=0.39 * S^0.38 * R^-0.16
for slopes>10ft/mile or 0.002
Critical Depth Sections: Froude=1=V/(g*D)^0.5
gives: Q=A*(g*D)^0.5 where D=mean depth as Area/TopWidth
and is much preferred to Slope Area measurements.
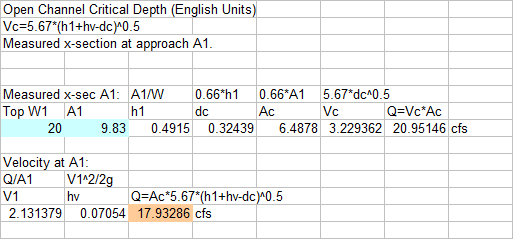
Vc=5.67*Dc^0.5
Culvert Inlet Critical Section:
Dc=0.66*H1 at width of box upstream.
Open Channel Critical Section:
Measure
approach x-section above critical area and Dc=0.66* mean depth of a x-section.
Critical
Flow Area =0.66* area of x-section.
Free Culvert Outfall Section:
at lip Depth=0.7 Critical Depth
so Critical Depth is measured upstream 4 * lip depth.
Critical Slope: Q=1.49*A*R^0.667*S^0.5/n
V=1.49*R^0.667*S^0.5/n Vc=5.67*Dc ^0.5
Sc=(5.67*Dc^0.5*n/(1.49*R^0.667))^2
For 10' rectangular culvert
R=A/WP=10*Dc/(10+2Dc)
General critical slopes to remember:
For n=.015 Sc=.004 or 0.2ft/50ft
For n=.030 Sc=.01 or 0.5ft/50ft
For n=.050 Sc=.04 or 2ft/50ft
For n=.080 Sc=.08 or 4ft/50ft
For Dc=2 ft in rectangular channel:
Sc=(5.67*Dc^0.5*n/(1.49*R^0.667))^2
W=5; Sc=24.0*n^2
W=10; Sc=18.6*n^2
W=20; Sc=15.8*n^2
W=50; Sc=12.4*n^2
W=100; Sc=10.8*n^2
Youtube Video of critical
depth application.
Two Cross-Section Slope-Area Peak Flow Measurement Info:
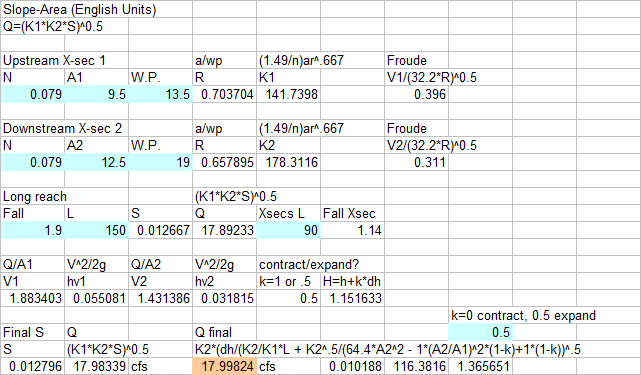
Youtube Video of
slope-area application.
USGS Channel Roughness of steep channels N value:
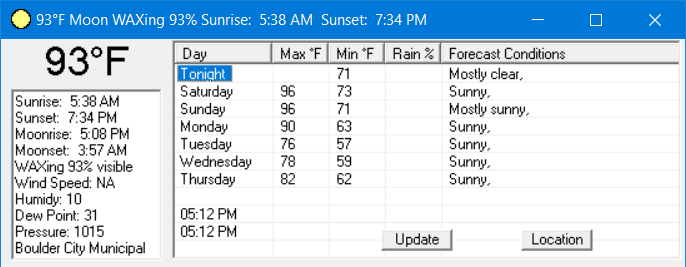
19 SunMoon.exe--7-day high & low temerature forecast and conditions,
current Temp, Wind, Humidity, Dew Point, Pressure, Surise, Sunset, Moon Phase,
Moon rise and set for your Lat/Long location. Auto updates every 30
minutes.
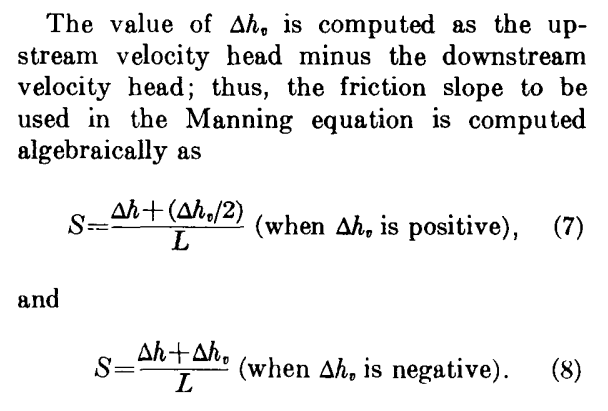
The fine print: The user assumes all risk for any damages
whatsoever resulting from loss of use, data, or profits arising in connection
with the access, use, quality, or performance of this website's softwares or
it's supplied data just so you know. |
|
|
|
|
|