|
This is a study to
see if the results shown in my
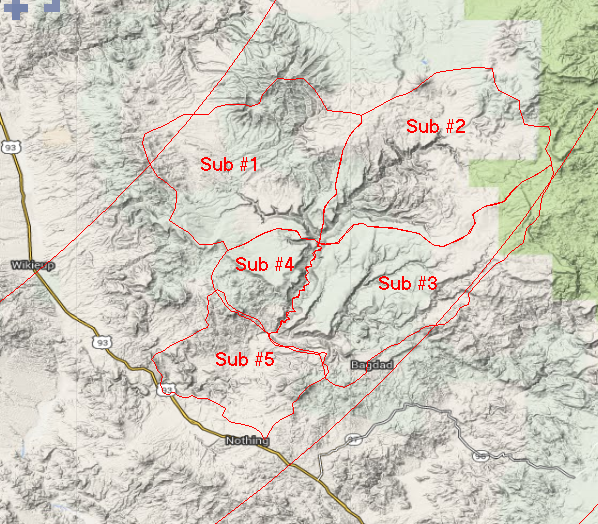
Arizona study for this basin can be improved by subdividing the 610 sqmi
basin into 5 sub-basins and also to show that my continuous Curve Number loss
method can produce successfull results (OR NOT) this far from
radars and with very sparse rain gages. Quite a challenge. A
composite of all nearby radars was compared to the nearest to see if that helps
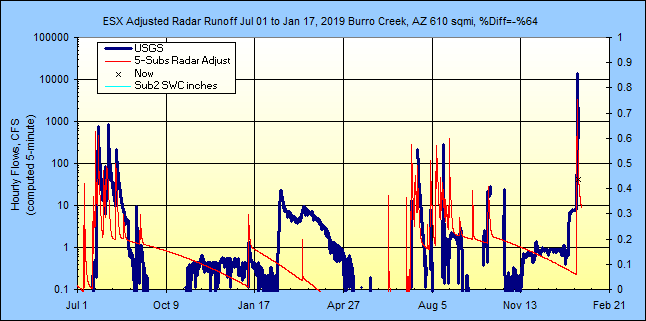
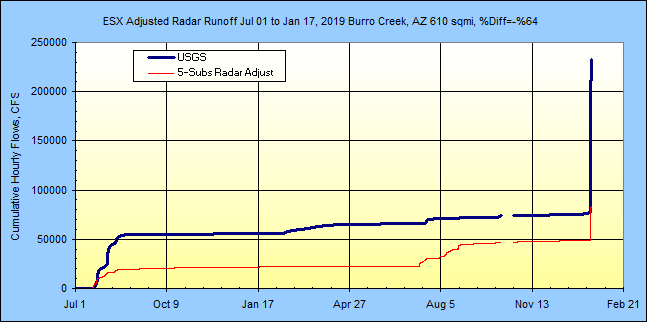
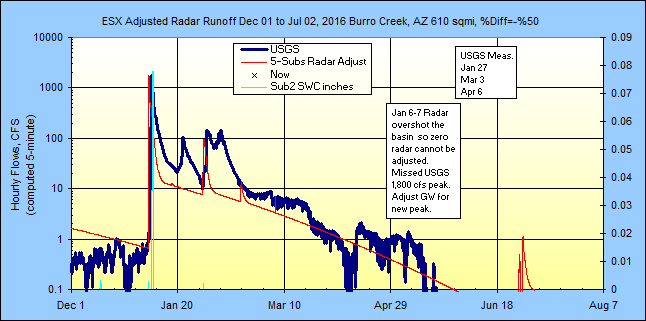
(OR NOT). The Burro Creek USGS flow gage is not the best either
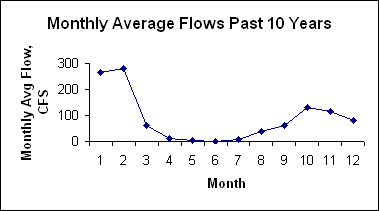
with A LOT of shifting control. Burro Creek at the USGS gage near Bagdad,
AZ goes to zero flow for a few months most years in late spring and resumes
flows with the summer monsoons beginning in July.

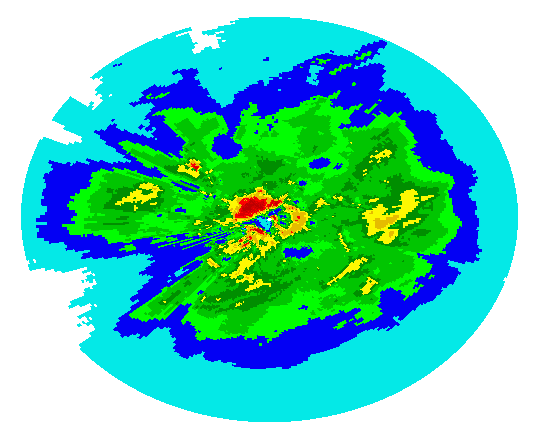
source: Intellicast/Wunderground
NOAA radar loop above.
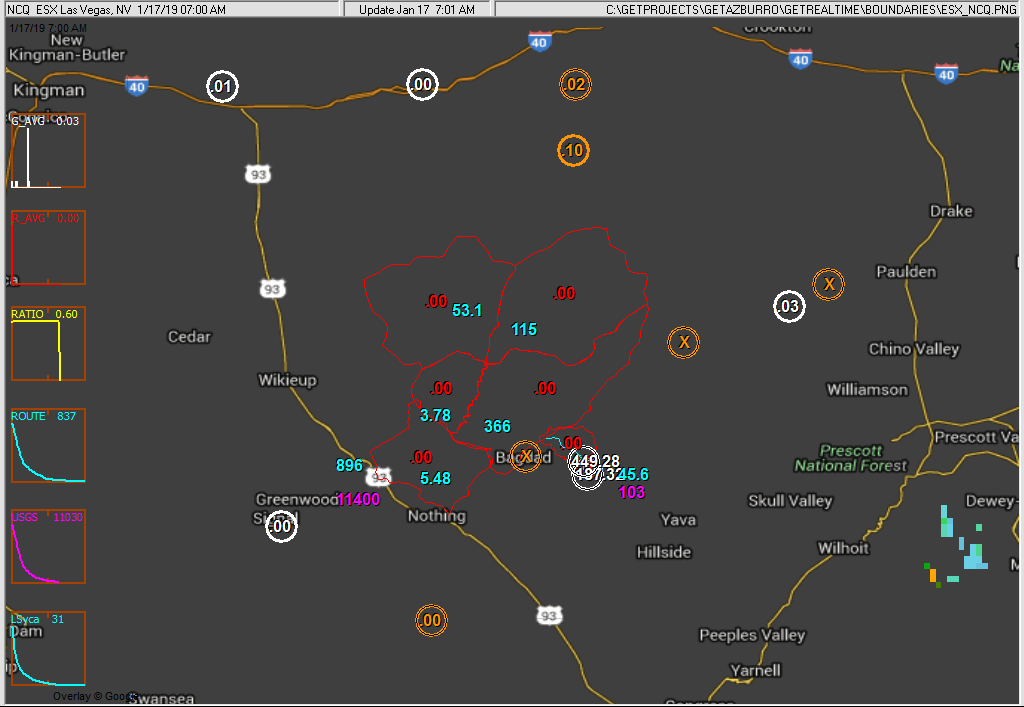
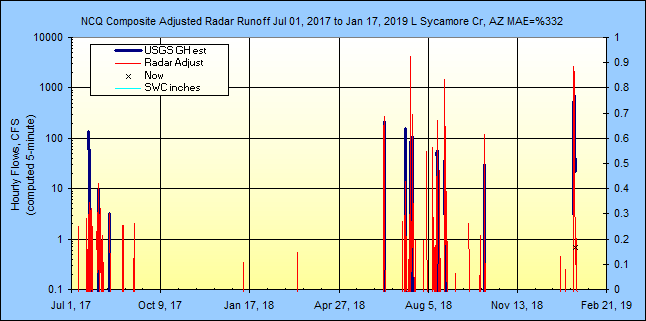
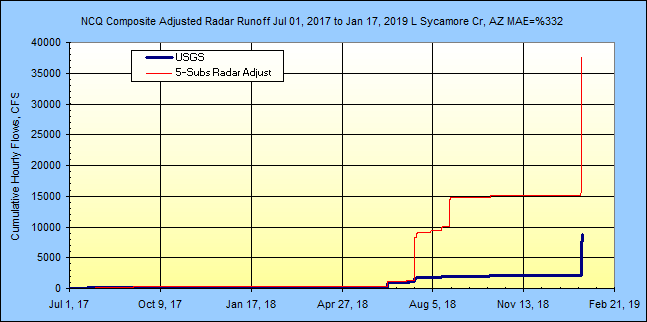
Below is my GetNexrad N0Q radar area 114 miles southeast of the ESX radar, Wundergages
(white), adjusted N0Q radar (red) at watersheds, computed runoff (blue, and USGS gage
flow (violet) over the
Burro Creek
5 sub-basins. Displayed values for rain gages and
adjusted radar (W/O forecast)
are yesterday and today's sum, other datatypes numbers display yesterday and today's
max value in the
rdaymax table. Missing data for
rainfall and radar is 40 minutes old and others are 240 minutes old (USGS lag)
and the displayed values will be colored orange but thumbnail plots remain the same color. I
won't be retrieving radar for
clear skies. 5-minute radar N0Q cells are 0.57 x 0.70 miles (1km x 0.5
dBZ). Note that because the large distances between rain gages, up to 56
miles, I decided to use a 1-hour DAILY
2-hour ratio of Gage/Radar
daily rainfall average at now 4 gages. The Mean
Absolute Error % is shown on thr hourly gage and radar graphs is a gage weighted
MAE= Sum G*|G-R| / Sum G*G when gage or radar > 0.05".
Update 9/11/2014: I have gone to a 2-hour G/R ratio instead of
Daily and restarted everything from July 1. On August 26 I
had to intervene and mannually set the G/R ratio to 1.5 because of missing
Bagdad raingage data to get the soil moisture back on track. The daily or
2-hour gage/radar ratios are used instead of a normal1-hour because of the long
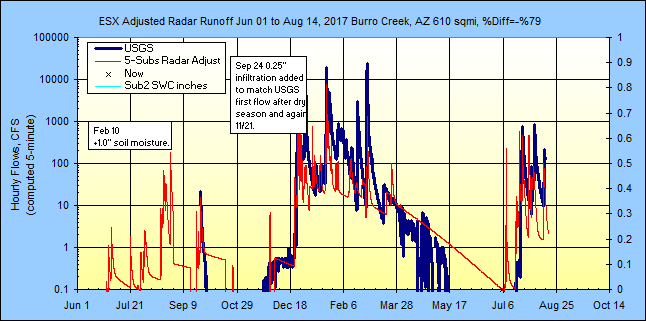
distances to the rain gages. Update 8/9/2016: Forget it, I've gone
back to 1-hour raios. Update Sep 7, 2016: The unadjusted new
PTA storm total dual pole QPE algo product is showing
remarkable results this far out and may be a keeper but time will tell. No more
frozen rain gages if it holds up.
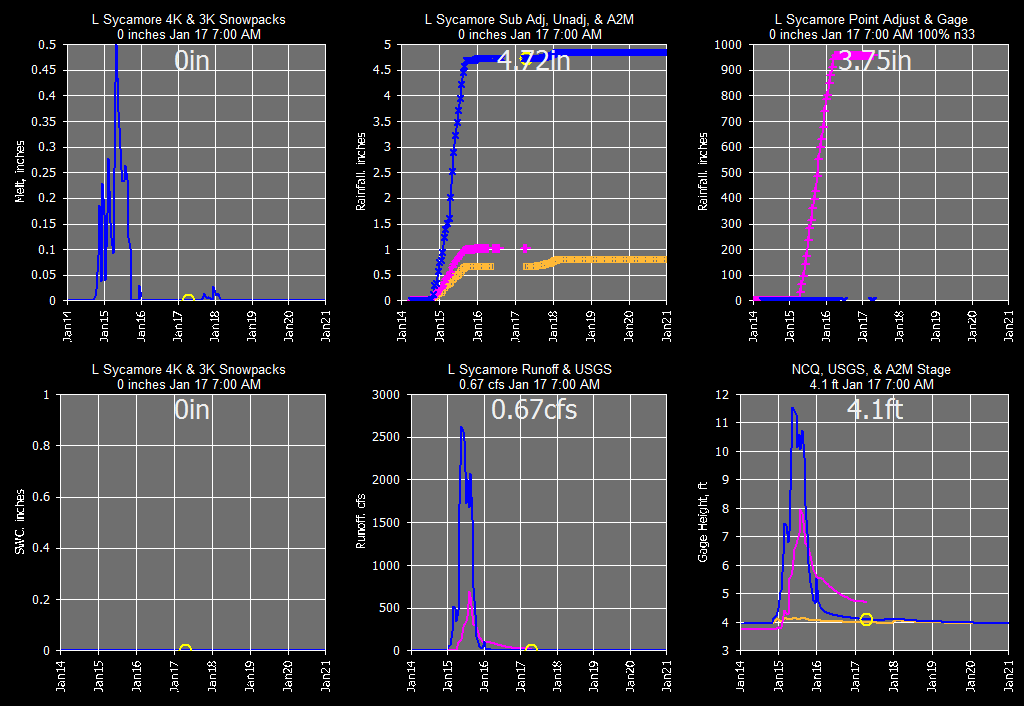
Update Aug 8, 2016: I have added snowmelt computation elevation
bands to each subbasin. Each elevation band is 1000 feet.
This means snowmelt is computed separately for each zone and then area fraction
summed for subbasin melt. Subs 2, and 3 have 3 zones, and subs 1, 4, 5 and
L Sycamore
have 2 zones. The same precip is assumed to fall on each elevation zone as
the subbasin radar average. I don't know if this was needed but seemed
like a good idea. Snowmelt is VERY temperature and longwave sensitive...
VERY!!! The temperature gage at elevation 5500 ft is lapse rated 3.5
F/1000ft to each band but not longwave nor other parameters so far.
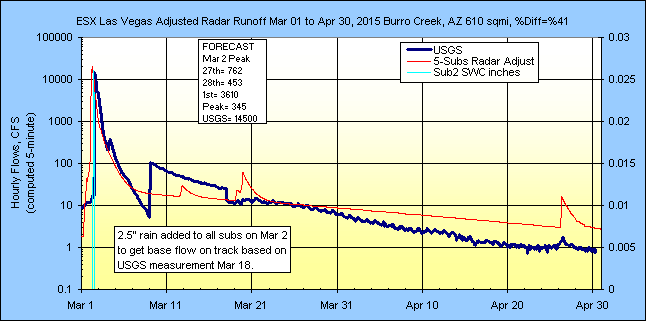
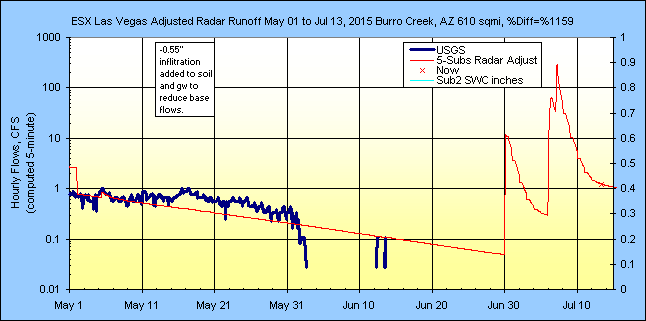
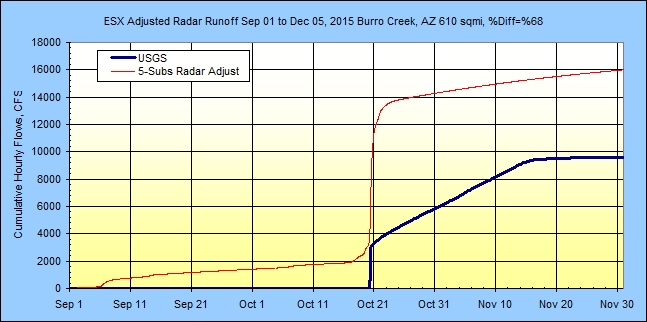
CONCLUSIONS Jan 1 2017:
The rain gages are just too far from the 610 sqmi basin for reliable radar
adjustments. Also the reliable temperature gage for snowmelt calcs is also
too far from the basin. This study will continue in case a Wunderground
rain gage comes online with in the basin to verify expected improvement.
But for now this study is a cautionary tale of a large basin with no
rain gages with in it and shows the limit of radar rainfall adjustements.
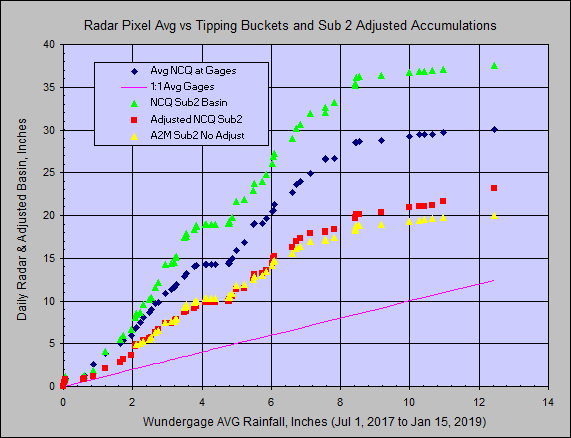
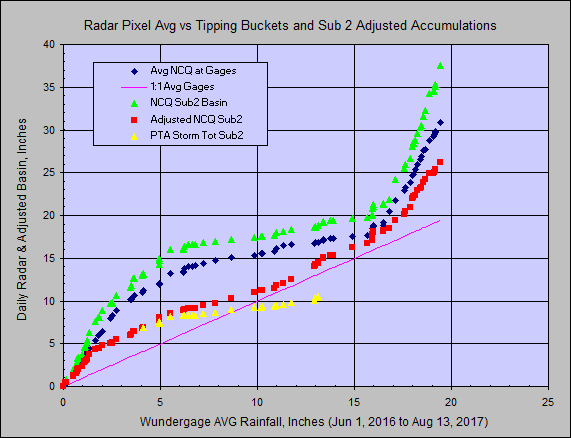
The adjacent 19 sqmi Little Sycamore basin has 2 USGS rain gages with in it and
shows that composite radar rainfall at these distances can be successfully
adjusted... maybe... sometimes.
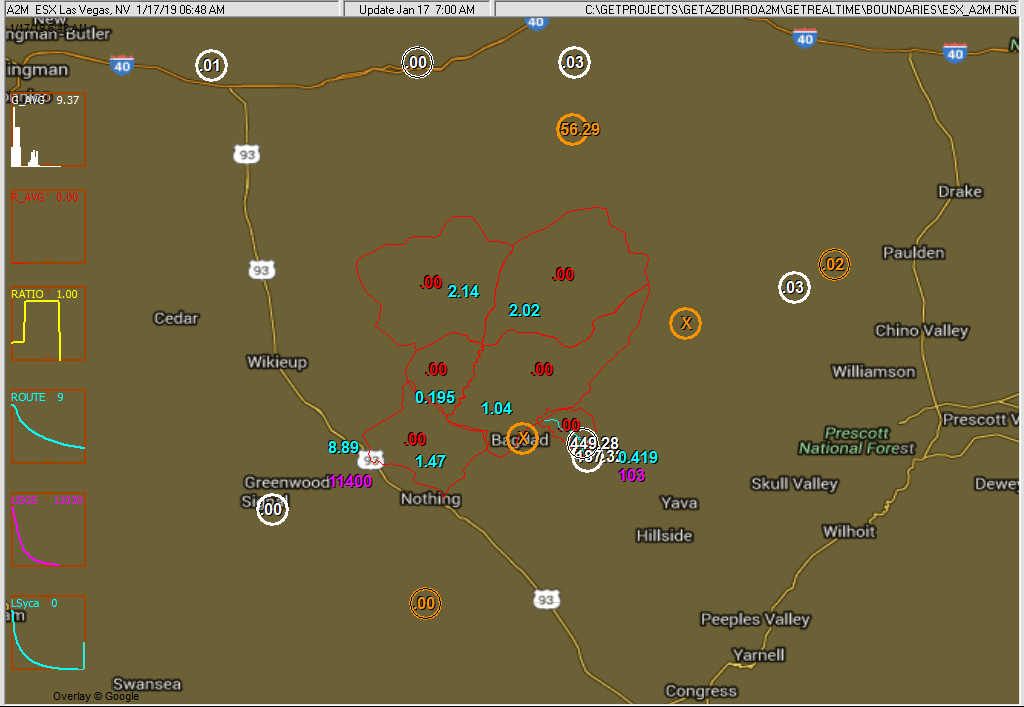
Next up is to try the MRMS Multi Radar Multi Sensor product
from NSSL A2M. A2M is a 1-km 2-minute rainfall rate with 255 values. The setup
site_name is A2M-ESX (for ESX radar) and uses the Iowa map cutting service for
the same area as NCQ. The A2M rainfall will NOT be gage adjusted.
Using A2M Multi-Radar Multi-Sensor Rain Rate for the 2018 summer shows very good
results... better even than adjusted NCQ ( NCQ composite of N0Q seems to have
problems over Little Sycamore to the south where the Phoenix radar takes over(?)
and is adjusted with Las Vegas radar at the rain gages(?) or something). Anyway,
the A2M is working GREAT!!! Now if it would only rain/snow in the winter here
for confirmation of A2M's greatness. But...
Update Jan 17, 2019: The unadjusted A2M Multi-Radar Multi-Sensor Rain Rate
is a complete bust for winter rainfall. The adjusted NCQ radar is WAY
better for winter even with it's VERY poor rain gage location distribution.
I think I've seen enough of A2M and don't recomend it. Study terminated.
My A2M was a complete dud in New York state here:
http://getmyrealtime.com/Runoff_OneidaCrNY.aspx
And PTA really is no help at these distances. Get back in the lab NWS...
you're peddeling roses (see A2M):
Automated graphs and radar updates:
Beginning Oct 7, 2015 radar product NCQ Iowa Composite of all nearby radars will
be
used. Once the temperatures start dropping the ESX radar cannot see the
lower statiform rainfall and you can't adjust zero radar. ESX is 100 to
125 miles from the basin. Why the other radars can see better I don't
know. Ah, the Las Vegas and Phoenix radars are both 124 miles from Bagdad
but Vegas mid-beam scan is at 19,400 ft vs Phoenix at 16,000 ft. Flagstaff
radar is actually a bit closer but scans at 20,000 ft Along the basin
centroid distance both Vegas and Phoenix radars are scanning at the same 18,000
ft. So it's probably a
hodge podge of radars being composited adding more guestions for adjusting with
rain gages so far apart. Time will tell.
One finding is tha the N0Q
ESX radar adjusted with only a rain gage at the farthest distance will (may)
overestimate the basins nearer to the radar and significantly exceed the ajusted
NCQ radar for those nearer basins so contrary to what I thought, that's a plus
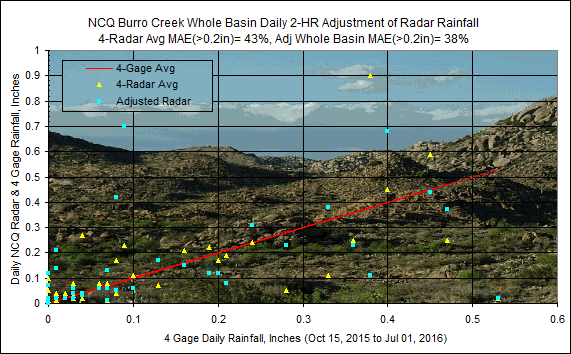
for NCQ. Also the 2-hour ratio is significantly worse than a 1-hour ratio
adjustment for the basin the gage was in. Win some lose some. I
tried the Day, 2-hour, and 1-hour ratio and conclude that the 1-hour is best so
this concludes the matter.
White rain gages ON,
black OFF, and red basin adjusted radar are for yesterday and today thru
now (no forecast). The two rain gages north of highway I-40 are not being
used.
Blue values are peak flows for yesterday and today. Violet value is USGS
flow gage peak.
Plot boxes are hourly values for yesterday and today.
Orange values are more than 30 minutes old.
Radar Iowa Composite
NCQ of nearby radars:
Unadjusted
MRMS product A2M is also being tried for these long distances:
Real-time rain gages in the Burro Creek area (not all used):
(dead)
MQGDA3; 10343; Rainfall; Goodwin Mesa nr Bagdad, AZ
KAZSELIG1; 10345; Rainfall; Sierra Verda #1
KAZSELIG4; 10346; Rainfall; Sierra Verda #2
(dead)
MCPWA3; 10338; Rainfall; Camp Wood
KAZBAGDA2; 10353; Rainfall; Bagdad
KAZSELIG5; 10355; Rainfall; Fort Rock
(too far)
KAZKINGM9; 10356; Rainfall; Peacock Mtn
KAZPRESC90; 10358; Rainfall; LV Ranch
(too far?)
09424900; 10336; Rainfall; Santa Maria River USGS
09424450; 10320; Rainfall; Big Sandy USGS
09502800; 10380; Rainfall; Williamson Wash USGS
343257113032800; 10357; Rainfall; Little Sycamore Wash USGS
343415113040300; 10359; Rainfall; Upper Little Sycamore Wash USGS
NWS Forecasts for Burro Creek
(beginning July 2016):
Both I and the NWS stage should compare well on forecasts because the same
forecast is used, but for current peaks, then who has the best adjusted radar
product will start to show. This huge basin is miles from nowhere with
sparsely located rain gages so NWS might have the better deal with their radar
methods geared for large areas.... we'll see... but when it's raining at a gage, then it aint
raining over the basin. Note "Foecast (issued...)" time on graph below. Also my 3-hour Nowcast is being compared to my
distributed NWS 6-hour forecast on my web page
here and
should easily out perform (usually) the NWS methods for the next hour or 2.
I'll try to keep track of some NWS current peaks a few hours out before lost to
observed. If the NWS has better luck with this basin than I've had, then
I'll try one of their precip products or use an hourly product to adjust the
5-min radar instead of rain gages but what I've seen of PTA vs these gages they
aint in the ballpark but sure make runoff look good... zero.
Update Jul 28, 2017: Now besides the 3-hour Nowcast on
NCQ and A2M made by moving the subs up wind for 3 hours and the
NWS distributed 6-hr blocks for 7 days, the new HRRR 15-minute block 18 hour
forecast is included for just 3 hours after the 3-hr Nowcast. I don't
think the NWS is using the HRRR forecast so I better watch out too.
Some Peak Stage Feet Comparisons
(current zero flow rated GH 4.75 ft):
Date USGSfinal Issued GetRealtime Issued
NWS
2016/8/21
xxAM
4.75' 4:10PM 10.43' 7:00AM
4.80' DIFF +5.28'
+0.0' Sub 1: 1.7" Nowcast
hour 1
2016/8/21 xxAM
4.75' 5:10PM 6.04' 7:00AM
4.80' DIFF +0.89'
+0.0' Sub 1: 0.5"
final hourly
2016/8/21 xxAM
4.75' 6:10PM 6.34' 7:00AM
4.80' DIFF
+1.19' +0.0' nowcast
hr1 G/R=1.1 final=0.3
(G & R minimums before ratio computed raised from 0.02" to 0.03" to help
terrible nowcast.)
2016/8/27
5PM 4.75' 2:10AM 7.86' 2:10AM
4.80' DIFF +2.71' +0.0' Nowcasts for 2am,3am,4am
2016/8/27
5PM 4.75' 7:10AM 7.12' 7:00AM
>9.80' DIFF +1.97' +5.0' Nowcast MAE Hr 1,2,3
2016/8/27
5PM 4.75' 10:10AM 6.89' 7:00AM
>9.80' DIFF +1.74' +5.0' 32% 73% 48% final 0.39"
I don't think NWS updates their daily morning
runoff forecast until something big so I
can clean their clock till then?.... well that was wishful thinking.
NWS Forecast, HRRR 6-Hour, and GetRealtime 3-Hour Nowcast
with Alert Triangle > 0.1"/hr:
Flood Stage at Burro Creek Gage NCQ=Blue, Gage=Pink, and A2M=Orange:
================================================
More Current Info........
================================================
GetGraphs
Current Gage Rainfall and Radar
(pink) used for adjustments (Yellow graphs are turned OFF):
GetGraphs Current Adjusted Radar and Unadjusted
(pink):
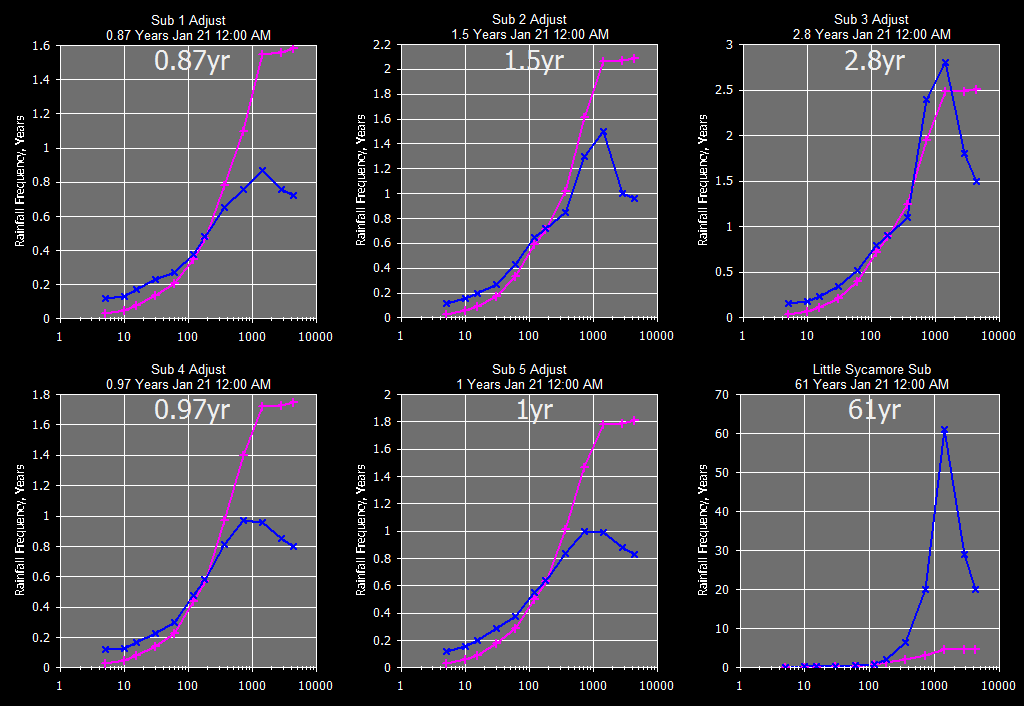
GetGraphs Subbasin Adjusted Radar Rainfall Frequencies
(blue) and Rain Depths (pink), Xscale in Minutes:
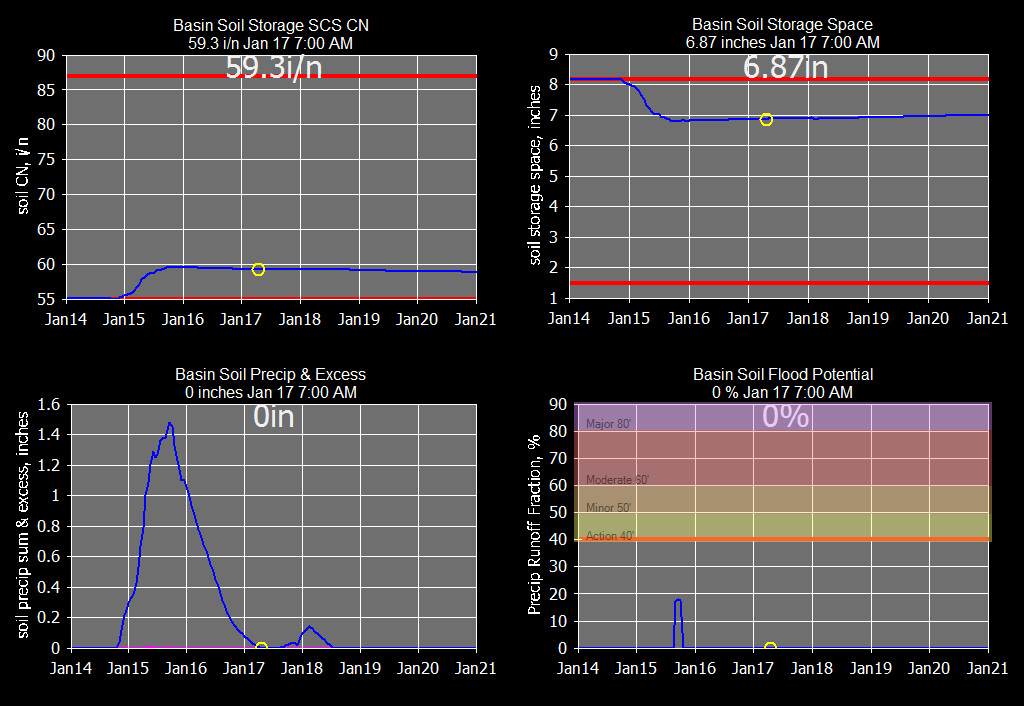
GetGraphs soil moisture:
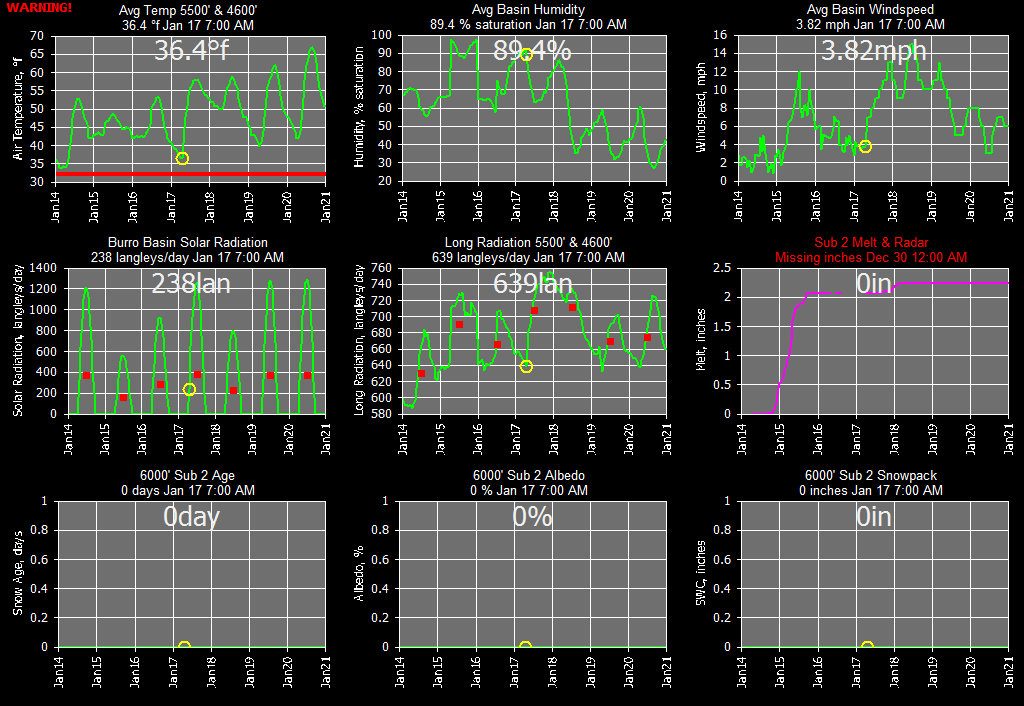
GetGraphs
snowmelt data:
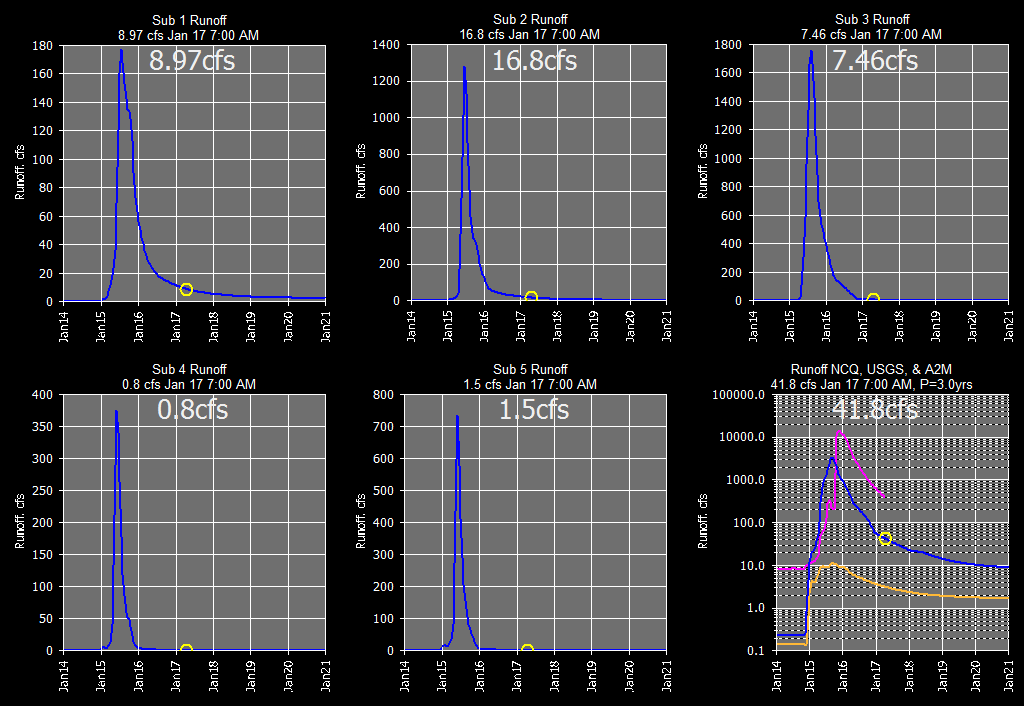
USGS Gaged and Subbasin Runofff:
Prescott Arizona current conditions:

Current history, more below:
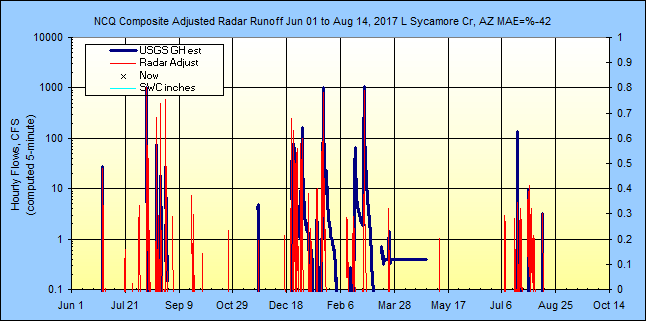
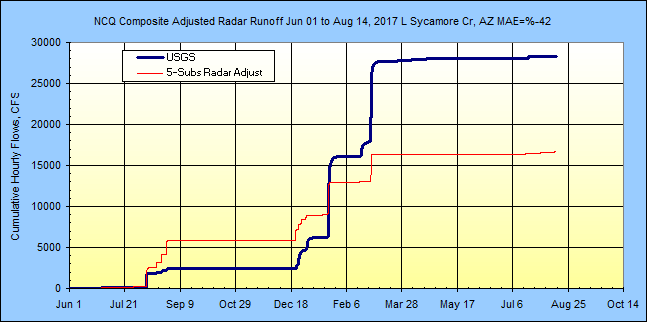
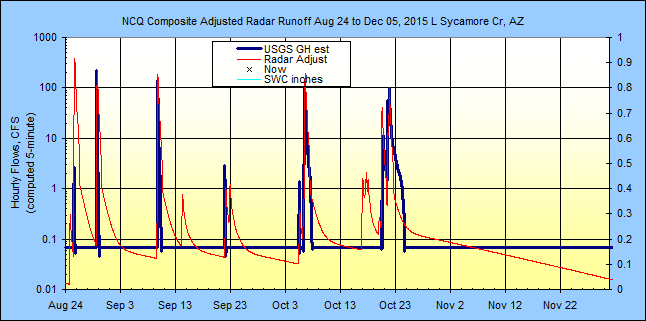
Adjacent 19.1 SqMi Little Sycamore Creek (USGS
09424600 flow gage in pink
someday):
Computation of Manning's N=0.39 * S^0.38 * R^-0.16 for steep channels (and it
looks it! 194 ft/mi)
S=0.03669, R=4.093 so N=0.088 at 4900 cfs, Lag=3.0
hrs.
I'll use Lag=4.0 hrs with Variable Lag as I
think I did above and see how that goes for now.
Now all we need is for the USGS to start providing flows at this new gage and we
shall see how we did here. Unitil then, I used Google Earth for a slope
conveyance rating just above the gage to estimate flows from bubbler G.H.
Update Feb 16, 2017: USGS is now providing flows and will be used hence
forth.
The USGS rain gage(s
now 2) on Little Sycamore will be used to adjust the NCQ basin
radar rainfall along with others, then the same ratio used for the 5 subs above
will be used to adjust this L Sycamore sub and point rainfall at the gage to see
how bad radar adjustments are at this distance. Seems the USGS L Sycamore rain gage has been down for a
month now and shows no signs of returning to service so we shall see.... ah,
they changed the station ID number to a lat/long form so we're back in business.
Current flows.
No USGS flow rating yet,
just a poor estimate from USGS GH.... USGS now reporting flows as of 2/16/2017.
I was OVER estimating flows by twice but I'll let them stand as history only.
More Little Sycamore history at bottom.
Long term rainfall, hourly runoff, and soil storage updated daily:
Current Daily
NCQ Composite Radar Rainfall Accumulations and A2M Jul 1, 2017 to...:
History Daily
NCQ Composite Radar Rainfall Accumulations and PTA Jun 1, 2016 to...:
New NCQ composite of all nearby radars
Oct 15, 2015 to Jul 2, 2016
New NCQ Composite of all nearby radars
Old N0Q radar
Old N0Q radar
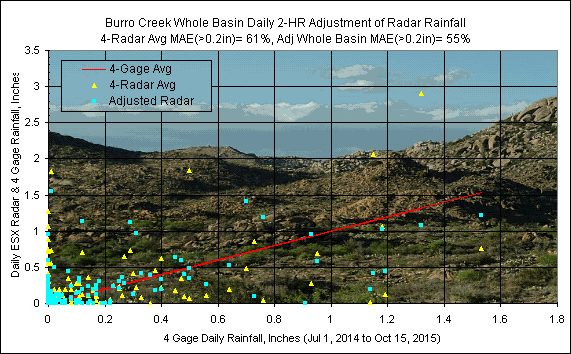
Months 1 & 2 using 2-HR RATIOS of gages WoodCamp+Bagdad+BigSandy+SantaMaria:
Months 3 & 4 using
2-HOUR RATIOS:
Months
5 & 6 using
2-HOUR RATIOS:
Months
7 & 8 using
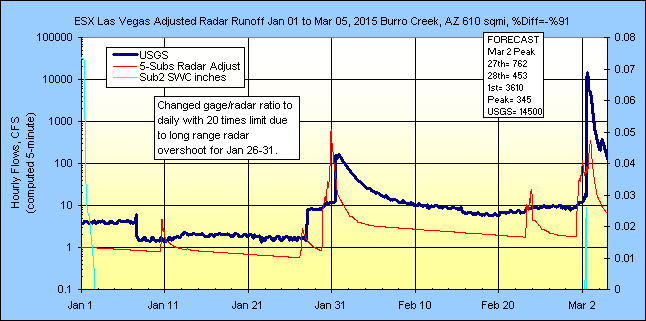
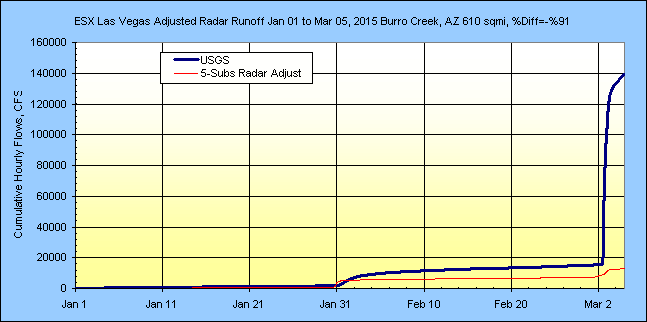
2-HOUR RATIOS: The basin is just too far from the ESX radar for low winter
storms and so suffers severe overshoot. Using Iowa NCQ highest
reflectivity from nearby radars is even worse.
Months 9 & 10 using 2-HOUR RATIOS: The basin is just too far from the ESX
radar for low winter storms and so suffers severe overshoot. Using Iowa
NCQ highest reflectivity from all nearby radars is even worse.
May & Jun 2015using 2-HOUR RATIOS:
Jul & Aug 2015using 2-HOUR RATIOS:
Sep
- Nov 2015 using 2-HOUR RATIOS:
Dec 2015 to using 2-HOUR RATIOS:
Jun 2016 to using 1-HOUR RATIOS:
History of Stage Error 2016:

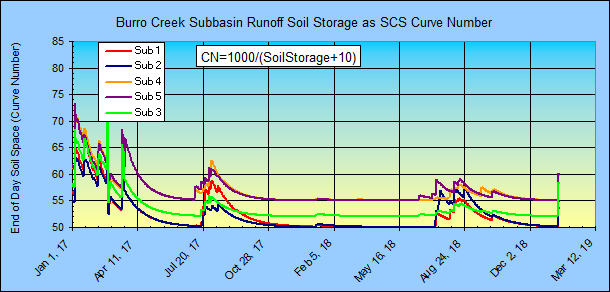
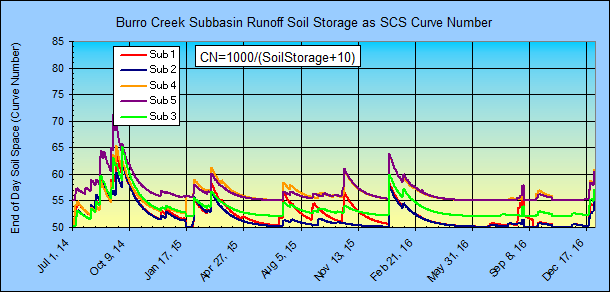
Soil storage curve numbers for the Subbasins:
(when the soil get's into the 80's you're sitting on a time bomb)
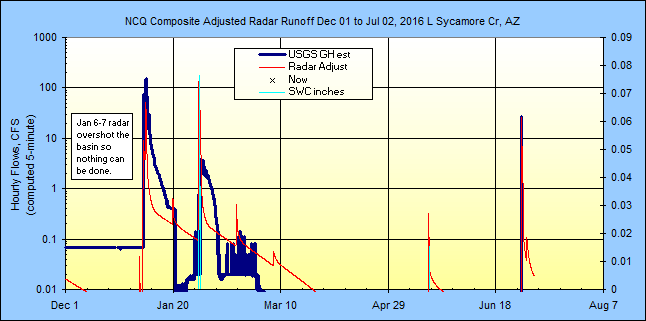
History of Little Sycamore Gage 2016:
***********
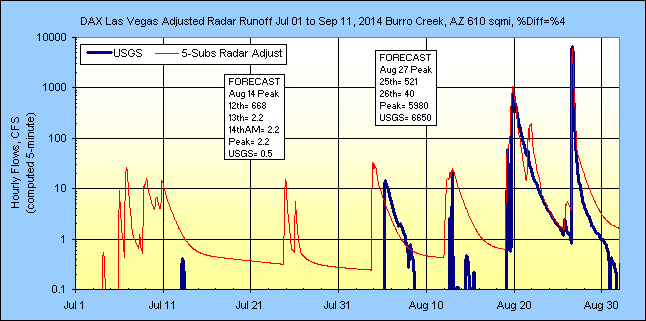
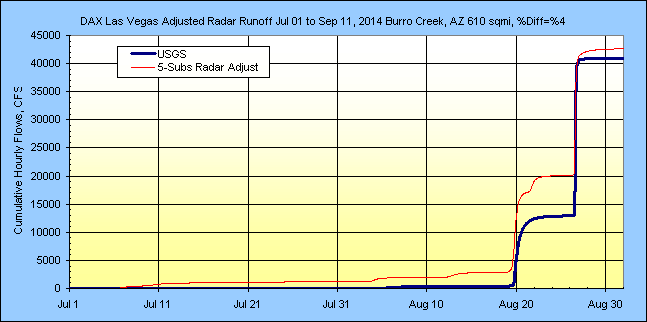
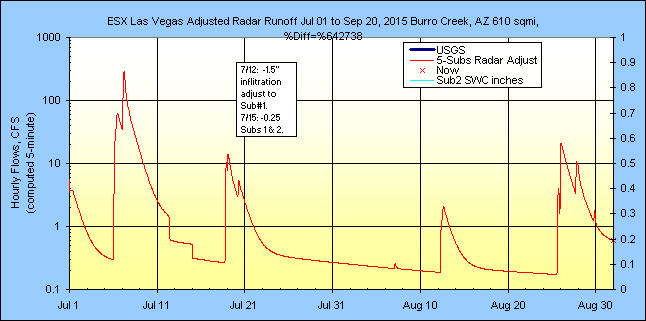
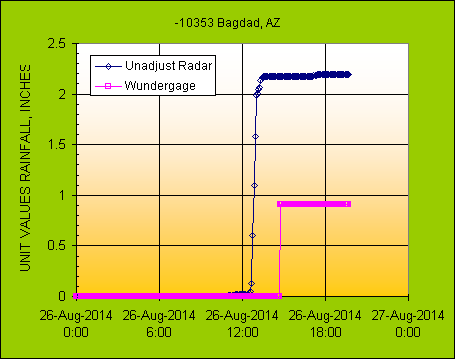
EARLY RESULTS 8/26/2014 ********************
Just when things were looking so good until Aug 26, 2014, then
the ESX radar shows dbz values as high as 75 dbz over the lower basin on Sub 5.
The radar had a hail cap at 55 dbz so no problem I thought. So how come the USGS
peak flow is 7,950 cfs and my adjusted radar says only
34 cfs. SNAFU and FUBAR to the max!!!... no matter what gage or gages are used in adjustments.
I tried raising the hail cap to 12.48 in/hr at 60 dbz (100-yr 5-min rain=1.04")
and got the same results because of a lower G/R ratio adjustment. I also
tried raising the hail cap to 62 dbz at 18 in/hr with the same results. I also
tried HOURLY G/R ratioing with same results. The daily G/R ratio would
need to be raised from my observed 0.38 to 1.5 in order to get the USGS reported
flow peak. Entirely possible but the Las Vegas ESX is so badly calibrated
that the typical ratio is 0.5 in the Burro Creek area and 0.25 in the the nearer
to radar site Las Vegas area. The rainfall that produced the peak flow was
mostly over Sub 5 and the radar's unadjusted rainfall for that hour was 1.70
inches and would therefor need to be 1.5*1.7 = 2.55 inches for the hour or about
a 25 year 1-hour storm. How I would ever get there is beyond me because
the nearby Bagdad Wundergage had a G/R ratio of 0.42 for the hour. I
will chalk it up to the crappy ill tempered Bagdad rain gage that probably
missed half the storm. The further away Big Sandy USGS rain gage ratio was
0.33 with only one radar dbz near hail at 53 dbz with 1/2 the rainfall as
reported at Bagdad. The USGS peak flow recession looks flawless so I
don't expect the USGS to change the flow much if at all. To update the
soil moisture back into the ballpark for Sub 5, I set the August 26 G/R ratio to
1.5.
Bagdad Wundergage Aug 26, 2014 (Army
COE operates this gage, really? why bother???...hey, it's free):
***********************************************
***********
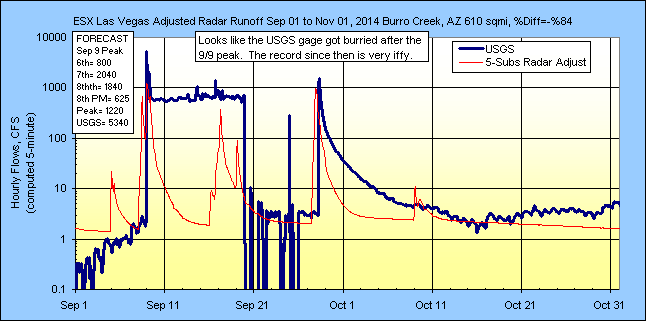
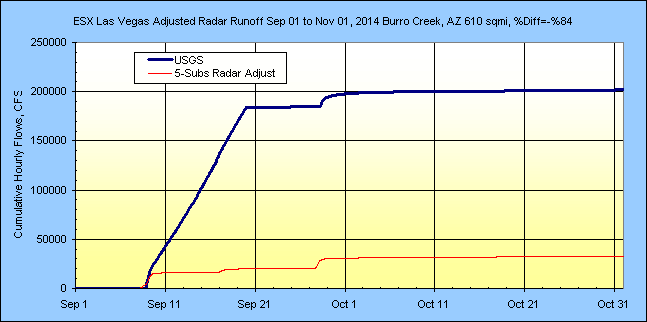
RESULTS 9/9/2014 ********************
I tried all the combonations of gages, defualt ratios, curve numbers, and
initial losses and could get good results only storm by storm. I also
tried hourly and 2-hourly ratios with good results some of the time. I
think the problem is the poor rain gages at Bagdad and Camp Wood and the quickly
shifting G/R ratio both temporilly and spatially. So I will just stick to
daily ratios with poor gages and hope the winter storms are easier to deal with.
You just can't make a silk purse out of this cow's rain gages. The
rain gages are just too far and just to wrong. I can't even find Wood Camp
and Bagdad gages in Google Earth visually so who knows their locations.
The hourly adjustments was a disastor, but the 2-hour G/R adjustment was a bit
better than Daily so I have started over with 2-hr G/R ratios.
Update May 1, 2015: Camp Wood, Goodwin Mesa, and Bagdad rainfall records
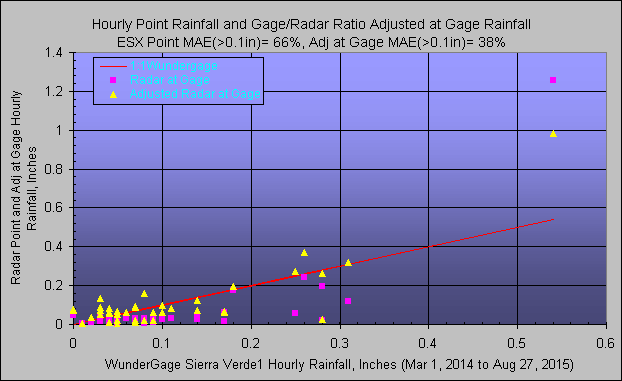
are no longer available on Wunderground. So now I'm relying on Sierra
Verde #1, #2, and USGS Sandy River for gage/radar ratio adjustment.
Hopefully these 3 discontinued rain gages within the basin will return to
service someday.
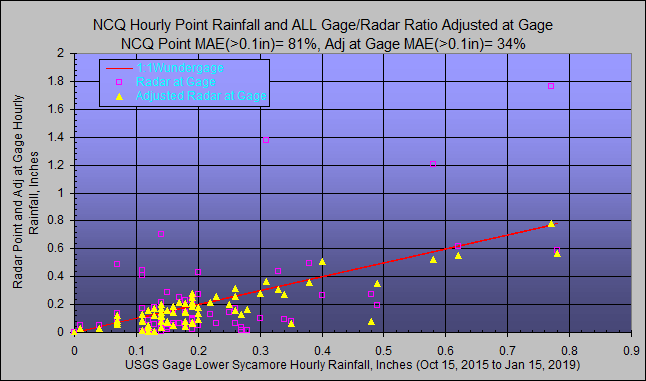
Update Jun 12, 2015: USGS Little Sycamore Ceek rain gage added so 4 gages
now availble for ratios.
Update Oct 1, 2015: Wunerground rain gage LV Ranch KAZPRESC90 added but is
pretty far east.
***********************************************
Background hydrology and runoff setups:
The radar range lines shown here are 100 and 125 miles from the ESX Las Vegas
radar.
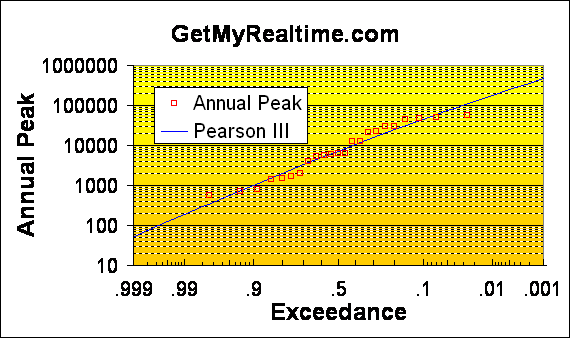
Annual peak flows at the USGS gage show where we are headed (yes I extended my
Google xsec from the 10,000 cfs routing ratings below out to 40,000 cfs and will redo if
needed. You may be wondering why these extreme large peaks. GetRealtime's
snowmelt computations will be needed for winter rain on snow:
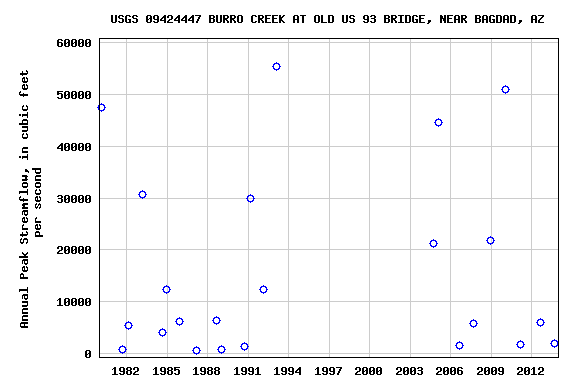
Burro Creek nr Bagdad annul flow Pearson III log stats: Mean=3.8436;
StdDev=0.64138; Skew=-0.1661 used in GetGraphs P=X yrs above:
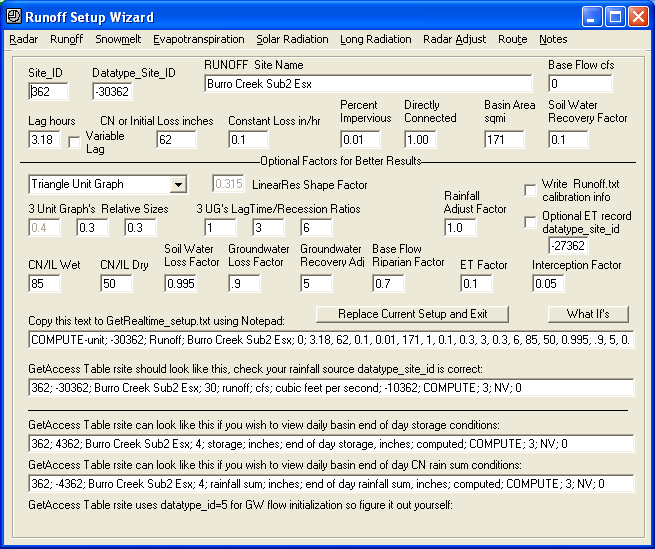
GetRealtime's setup wizard for Sub 2 and is similar to the other subs (note Base Flow, dry CN,
Groundwater Loss Factor, Riparian Factor, ET Factore, and Interception Factor
are all very unusual for dry desert basins):
ROUTINGS:
Subs 1 and 2 are combined and routed to Sub 3 and 4's outlets and combined.
Subs 1, 2, 3, & 4 are then routed to the USGS gage and combined with Sub
5.
Burro Creek Routing to USGS Gage at Highway
Get 4 -30361 Sub1
Get 4 -30362 Sub2
Combine
Route Muskingum-Cunge BurroCrXsecInSub4.Rat
Get 4 -30363 Sub3
Combine
Get 4 -30364 Sub4
Combine
Route Muskingum-Cunge BurroCrXsecInSub5.Rat
Get 4 -30365 Sub5
Combine
End
The first routing is for a channel slope of 55 feet per mile
for 11.90 miles and the second
routing channel slope is 32 ft/mi for 15.66 miles. These steep slopes would cause
hundreds of cascades to be needed with Modified Puls storage routings. My
free program ModPulXsec.exe
was used to take the channel section stations, elevatations and convert to a
Musking-Cunge rating with constant coefficients based on peak flow of period
simulated. The
stationing and elevations were taken from Google Earth. Here's a tip for
estimating Manning's N for steep channel slopes > 10 ft/mile:
n = 0.39 * S^0.38 * R^-0.16
Channel X-section station, elevations:
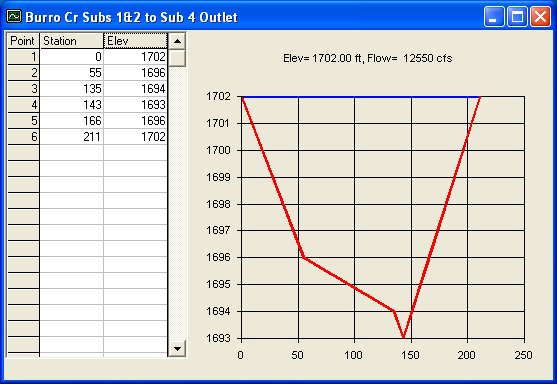
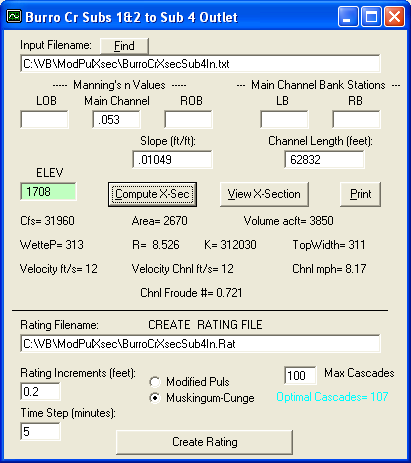
Muskingum-Cunge rating to Sub 4 as Elev, Flow, K, X, Cascades:
|
Burro Cr Subs 1&2 to Sub 4 Outlet MuskingumCunge timestep=5 minutes |
|
46 lines below |
|
|
|
|
1693 |
0 |
0 |
0 |
100 |
|
1693.2 |
0.193 |
4.26 |
0.477 |
100 |
|
1693.4 |
1.22 |
4.31 |
0.466 |
100 |
|
1693.6 |
3.61 |
4.34 |
0.46 |
100 |
|
1693.8 |
7.77 |
4.36 |
0.456 |
100 |
|
1694 |
14.1 |
4.37 |
0.453 |
100 |
|
1694.2 |
20.7 |
4.42 |
0.444 |
100 |
|
1694.4 |
33 |
4.43 |
0.44 |
100 |
|
1694.6 |
51.6 |
4.44 |
0.439 |
100 |
|
1694.8 |
77.5 |
4.44 |
0.439 |
100 |
|
1695 |
112 |
4.44 |
0.439 |
100 |
|
1695.2 |
155 |
4.45 |
0.437 |
100 |
|
1695.4 |
209 |
4.45 |
0.437 |
100 |
|
1695.6 |
273 |
4.45 |
0.436 |
100 |
|
1695.8 |
349 |
4.37 |
0.435 |
98 |
|
1696 |
438 |
4.15 |
0.433 |
93 |
|
1696.2 |
556 |
3.65 |
0.436 |
82 |
|
1696.4 |
686 |
3.29 |
0.438 |
74 |
|
1696.6 |
829 |
3.02 |
0.437 |
68 |
|
1696.8 |
983 |
2.85 |
0.436 |
64 |
|
1697 |
1150 |
2.67 |
0.436 |
60 |
|
1697.2 |
1330 |
2.54 |
0.435 |
57 |
|
1697.4 |
1520 |
2.41 |
0.435 |
54 |
|
1697.6 |
1720 |
2.32 |
0.434 |
52 |
|
1697.8 |
1940 |
2.23 |
0.433 |
50 |
|
1698 |
2170 |
2.15 |
0.432 |
48 |
|
1698.2 |
2410 |
2.06 |
0.431 |
46 |
|
1698.4 |
2660 |
2.02 |
0.43 |
45 |
|
1698.6 |
2920 |
1.97 |
0.429 |
44 |
|
1698.8 |
3200 |
1.89 |
0.428 |
42 |
|
1699 |
3490 |
1.84 |
0.426 |
41 |
|
1699.2 |
3800 |
1.8 |
0.426 |
40 |
|
1699.4 |
4110 |
1.76 |
0.425 |
39 |
|
1699.6 |
4440 |
1.71 |
0.424 |
38 |
|
1699.8 |
4790 |
1.72 |
0.422 |
38 |
|
1700 |
5140 |
1.67 |
0.422 |
37 |
|
1700.2 |
5510 |
1.63 |
0.421 |
36 |
|
1700.4 |
5900 |
1.59 |
0.42 |
35 |
|
1700.6 |
6290 |
1.59 |
0.419 |
35 |
|
1700.8 |
6700 |
1.54 |
0.418 |
34 |
|
1701 |
7130 |
1.5 |
0.417 |
33 |
|
1701.2 |
7570 |
1.5 |
0.417 |
33 |
|
1701.4 |
8020 |
1.46 |
0.415 |
32 |
|
1701.6 |
8490 |
1.46 |
0.414 |
32 |
|
1701.8 |
8980 |
1.41 |
0.414 |
31 |
|
1702 |
9470 |
1.41 |
0.413 |
31 |
|
1702.2 |
9990 |
1.37 |
0.413 |
30 |
|
1702.4 |
10520 |
1.37 |
0.411 |
30 |
|
1702.6 |
11060 |
1.37 |
0.411 |
30 |
|
1702.8 |
11620 |
1.33 |
0.411 |
29 |
|
1703 |
12190 |
1.33 |
0.41 |
29 |
|
1703.2 |
12780 |
1.28 |
0.409 |
28 |
|
1703.4 |
13390 |
1.28 |
0.409 |
28 |
|
1703.6 |
14010 |
1.28 |
0.408 |
28 |
|
1703.8 |
14640 |
1.24 |
0.407 |
27 |
|
1704 |
15300 |
1.24 |
0.406 |
27 |
|
1704.2 |
15970 |
1.24 |
0.405 |
27 |
|
1704.4 |
16650 |
1.19 |
0.407 |
26 |
|
1704.6 |
17350 |
1.2 |
0.405 |
26 |
|
1704.8 |
18070 |
1.2 |
0.404 |
26 |
|
1705 |
18810 |
1.15 |
0.404 |
25 |
|
1705.2 |
19560 |
1.15 |
0.403 |
25 |
|
1705.4 |
20330 |
1.15 |
0.403 |
25 |
|
1705.6 |
21120 |
1.16 |
0.401 |
25 |
|
1705.8 |
21920 |
1.11 |
0.401 |
24 |
|
1706 |
22750 |
1.11 |
0.4 |
24 |
|
1706.2 |
23590 |
1.11 |
0.401 |
24 |
|
1706.4 |
24440 |
1.11 |
0.4 |
24 |
|
1706.6 |
25320 |
1.07 |
0.399 |
23 |
|
1706.8 |
26210 |
1.07 |
0.399 |
23 |
|
1707 |
27120 |
1.07 |
0.399 |
23 |
|
1707.2 |
28050 |
1.07 |
0.398 |
23 |
|
1707.4 |
29000 |
1.07 |
0.398 |
23 |
|
1707.6 |
29970 |
1.02 |
0.397 |
22 |
|
1707.8 |
30950 |
1.02 |
0.397 |
22 |
|
1708 |
31960 |
1.02 |
0.395 |
22 |
Muskingum-Cunge rating to USGS Gage
with N=.040 as Elev, Flow, K, X, Cascades:
|
Burro Cr Subs 1, 2, 3, 4 to USGS gage |
|
|
MuskingumCunge timestep=5 minutes |
|
|
46 lines below |
|
|
|
|
1693 |
0 |
0 |
0 |
100 |
|
1693.2 |
0.194 |
4.33 |
0.462 |
100 |
|
1693.4 |
1.23 |
4.42 |
0.443 |
100 |
|
1693.6 |
3.63 |
4.46 |
0.434 |
100 |
|
1693.8 |
7.83 |
4.5 |
0.427 |
100 |
|
1694 |
14.2 |
4.52 |
0.422 |
100 |
|
1694.2 |
20.8 |
4.59 |
0.407 |
100 |
|
1694.4 |
33.2 |
4.63 |
0.401 |
100 |
|
1694.6 |
52 |
4.63 |
0.4 |
100 |
|
1694.8 |
78.1 |
4.63 |
0.399 |
100 |
|
1695 |
112 |
4.64 |
0.399 |
100 |
|
1695.2 |
156 |
4.64 |
0.397 |
100 |
|
1695.4 |
210 |
4.65 |
0.397 |
100 |
|
1695.6 |
275 |
4.65 |
0.395 |
100 |
|
1695.8 |
352 |
4.66 |
0.394 |
100 |
|
1696 |
441 |
4.68 |
0.391 |
100 |
|
1696.2 |
560 |
4.65 |
0.396 |
100 |
|
1696.4 |
691 |
4.32 |
0.398 |
93 |
|
1696.6 |
835 |
3.99 |
0.397 |
86 |
|
1696.8 |
990 |
3.72 |
0.396 |
80 |
|
1697 |
1160 |
3.49 |
0.396 |
75 |
|
1697.2 |
1340 |
3.31 |
0.394 |
71 |
|
1697.4 |
1530 |
3.17 |
0.393 |
68 |
|
1697.6 |
1730 |
3.04 |
0.391 |
65 |
|
1697.8 |
1950 |
2.9 |
0.39 |
62 |
|
1698 |
2180 |
2.82 |
0.388 |
60 |
|
1698.2 |
2420 |
2.73 |
0.387 |
58 |
|
1698.4 |
2680 |
2.64 |
0.385 |
56 |
|
1698.6 |
2940 |
2.55 |
0.383 |
54 |
|
1698.8 |
3220 |
2.51 |
0.382 |
53 |
|
1699 |
3520 |
2.41 |
0.38 |
51 |
|
1699.2 |
3820 |
2.37 |
0.379 |
50 |
|
1699.4 |
4140 |
2.33 |
0.378 |
49 |
|
1699.6 |
4470 |
2.28 |
0.376 |
48 |
|
1699.8 |
4820 |
2.24 |
0.374 |
47 |
|
1700 |
5180 |
2.2 |
0.373 |
46 |
|
1700.2 |
5550 |
2.15 |
0.371 |
45 |
|
1700.4 |
5940 |
2.11 |
0.37 |
44 |
|
1700.6 |
6340 |
2.06 |
0.369 |
43 |
|
1700.8 |
6750 |
2.02 |
0.367 |
42 |
|
1701 |
7180 |
1.97 |
0.366 |
41 |
|
1701.2 |
7620 |
1.98 |
0.365 |
41 |
|
1701.4 |
8080 |
1.93 |
0.363 |
40 |
|
1701.6 |
8550 |
1.89 |
0.361 |
39 |
|
1701.8 |
9040 |
1.89 |
0.361 |
39 |
|
1702 |
9540 |
1.84 |
0.36 |
38 |
Little Sycamore Creek (No USGS flows yet)
Little Sycamore Creek:
No USGS flow rating yet,
just a poor estimate from USGS GH.
Elevation Snowmelt Banding Seup begun Aug 8, 2016:
********; *********; *********; ****SUB 1 SNOWMELT*************************
SNOWMELT-unit; 11491,-23491; Melt, Swc; 4000FT Burro Cr Sub 1 Snow Melt & Pack,
AZ; 0; 3.5, 1, 0.75, 1, 1, 1, 1, 34
SNOWMELT-unit; 11591,-23591; Melt, Swc; 5000FT Burro Cr Sub 1 Snow Melt & Pack,
AZ; 0; 0, 1, 0.75, 1, 1, 1, 1, 34
********; *********; *********; ****SUB 2 SNOWMELT*************************
SNOWMELT-unit; 11492,-23492; Melt, Swc; 4000FT Burro Cr Sub 2 Snow Melt & Pack,
AZ; 0; 3.5, 1, 0.75, 1, 1, 1, 1, 34
SNOWMELT-unit; 11592,-23592; Melt, Swc; 5000FT Burro Cr Sub 2 Snow Melt & Pack,
AZ; 0; 0, 1, 0.75, 1, 1, 1, 1, 34
SNOWMELT-unit; 11692,-23692; Melt, Swc; 6000FT Burro Cr Sub 2 Snow Melt & Pack,
AZ; 0; -3.5, 1, 0.75, 1, 1, 1, 1, 34
********; *********; *********; ****SUB 3 SNOWMELT*************************
SNOWMELT-unit; 11393,-23393; Melt, Swc; 3000FT Burro Cr Sub 3 Snow Melt & Pack,
AZ; 0; 7, 1, 0.75, 1, 1, 1, 1, 34
SNOWMELT-unit; 11493,-23493; Melt, Swc; 4000FT Burro Cr Sub 3 Snow Melt & Pack,
AZ; 0; 3.5, 1, 0.75, 1, 1, 1, 1, 34
SNOWMELT-unit; 11593,-23593; Melt, Swc; 5000FT Burro Cr Sub 3 Snow Melt & Pack,
AZ; 0; 0, 1, 0.75, 1, 1, 1, 1, 34
********; *********; *********; ****SUB 4 SNOWMELT*************************
SNOWMELT-unit; 11394,-23394; Melt, Swc; 3000FT Burro Cr Sub 3 Snow Melt & Pack,
AZ; 0; 7, 1, 0.75, 1, 1, 1, 1, 34
SNOWMELT-unit; 11494,-23494; Melt, Swc; 4000FT Burro Cr Sub 3 Snow Melt & Pack,
AZ; 0; 3.5, 1, 0.75, 1, 1, 1, 1, 34
********; *********; *********; ****SUB 5 SNOWMELT*************************
SNOWMELT-unit; 11295,-23295; Melt, Swc; 2000FT Burro Cr Sub 3 Snow Melt & Pack,
AZ; 0; 10.5, 1, 0.75, 1, 1, 1, 1, 34
SNOWMELT-unit; 11395,-23395; Melt, Swc; 3000FT Burro Cr Sub 3 Snow Melt & Pack,
AZ; 0; 7, 1, 0.75, 1, 1, 1, 1, 34
********; *********; *********; ****L Sycamore SNOWMELT*************************
SNOWMELT-unit; 11396,-23396; Melt, Swc; 3000FT L Sycamore Basin Snow Melt &
Pack, AZ; 0; 7, 1, 0.75, 1, 1, 1, 1, 34
SNOWMELT-unit; 11496,-23496; Melt, Swc; 4000FT L Sycamore Basin Snow Melt &
Pack, AZ; 0; 3.5, 1, 0.75, 1, 1, 1, 1, 34
******; *******; *******; **********ARIZONA RUNOFF***********
COMPUTE-unit; -30491; Runoff; 4000FT Burro Creek Sub1 Esx; 0; 3.41, 50, 0.1,
0.01, 105, 1, 0.1, 0.3, 3, 0.3, 6, 85, 50, 0.99, 0.7, 5, 0.7, 0.1, 0.05, 1.00,
0, 0.1, 1, 0.7, 0, LagV; P1; 0; Triangle Unit Graph
COMPUTE-unit; -30591; Runoff; 5000FT Burro Creek Sub1 Esx; 0; 3.41, 50, 0.1,
0.01, 51, 1, 0.1, 0.3, 3, 0.3, 6, 85, 50, 0.99, 0.7, 5, 0.7, 0.1, 0.05, 1.00, 0,
0.1, 1, 0.7, 0, LagV; P1; 0; Triangle Unit Graph
COMPUTE-unit; -30361; Runoff; Burro Creek Sub1 Esx; 0; 0; P1+P2
******; *******; *******; *********************
COMPUTE-unit; -30492; Runoff; 4000FT Burro Creek Sub2 Esx; 0; 3.18, 50, 0.1,
0.01, 39.672, 1, 0.1, 0.3, 3, 0.3, 6, 85, 50, 0.99, 0.7, 5, 0.7, 0.1, 0.05,
1.00, 0, 0.1, 1, 0.7, 0, LagV; P1; 0; Triangle Unit Graph
COMPUTE-unit; -30592; Runoff; 5000FT Burro Creek Sub2 Esx; 0; 3.18, 50, 0.1,
0.01, 98.154, 1, 0.1, 0.3, 3, 0.3, 6, 85, 50, 0.99, 0.7, 5, 0.7, 0.1, 0.05,
1.00, 0, 0.1, 1, 0.7, 0, LagV; P1; 0; Triangle Unit Graph
COMPUTE-unit; -30692; Runoff; 6000FT Burro Creek Sub2 Esx; 0; 3.18, 50, 0.1,
0.01, 33.174, 1, 0.1, 0.3, 3, 0.3, 6, 85, 50, 0.99, 0.7, 5, 0.7, 0.1, 0.05,
1.00, 0, 0.1, 1, 0.7, 0, LagV; P1; 0; Triangle Unit Graph
COMPUTE-unit; -30362; Runoff; Burro Creek Sub2 Esx; 0; 0; P1+P2+P3
******; *******; *******; *********************
COMPUTE-unit; -30393; Runoff; 3000FT Burro Creek Sub3 Esx; 0; 6.41, 52, 0.1,
0.01, 46.035, 1, 0.1, 0.3, 3, 0.3, 6, 86, 52, 0.997, 0.85, 5, 0.85, 0.1, 0.05,
1.00, 0, 0.1, 1, 0.7, 0, LagV; P1; 0; Triangle Unit Graph
COMPUTE-unit; -30493; Runoff; 4000FT Burro Creek Sub3 Esx; 0; 6.41, 52, 0.1,
0.01, 62.465, 1, 0.1, 0.3, 3, 0.3, 6, 86, 52, 0.997, 0.85, 5, 0.85, 0.1, 0.05,
1.00, 0, 0.1, 1, 0.7, 0, LagV; P1; 0; Triangle Unit Graph
COMPUTE-unit; -30593; Runoff; 5000FT Burro Creek Sub3 Esx; 0; 6.41, 52, 0.1,
0.01, 46.5, 1, 0.1, 0.3, 3, 0.3, 6, 86, 52, 0.997, 0.85, 5, 0.85, 0.1, 0.05,
1.00, 0, 0.1, 1, 0.7, 0, LagV; P1; 0; Triangle Unit Graph
COMPUTE-unit; -30363; Runoff; Burro Creek Sub3 Esx; 0; 0; P1+P2+P3
******; *******; *******; *********************
COMPUTE-unit; -30394; Runoff; 3000FT Burro Creek Sub4 Esx; 0; 2.32, 57, 0.1,
0.3, 16.1, 1, 0.1, 0.3, 3, 0.3, 6, 87, 55, 0.997, 0.9, 5, 0.85, 0.1, 0.05, 1.00,
0, 0.1, 1, 0.85, 0, LagV; P1; 0; Triangle Unit Graph
COMPUTE-unit; -30494; Runoff; 4000FT Burro Creek Sub4 Esx; 0; 2.32, 57, 0.1,
0.3, 30.0, 1, 0.1, 0.3, 3, 0.3, 6, 87, 55, 0.997, 0.9, 5, 0.85, 0.1, 0.05, 1.00,
0, 0.1, 1, 0.85, 0, LagV; P1; 0; Triangle Unit Graph
COMPUTE-unit; -30364; Runoff; Burro Creek Sub4 Esx; 0; 0; P1+P2
******; *******; *******; *********************
COMPUTE-unit; -30295; Runoff; 2000FT Burro Creek Sub5 Esx; 0; 2.60, 57, 0.1,
0.5, 44.0, 1, 0.1, 0.3, 3, 0.3, 6, 87, 55, 0.997, 0.9, 5, 0.85, 0.1, 0.04, 1.00,
0, 0.1, 1, 0.85, 0, LagV; P1; 0; Triangle Unit Graph
COMPUTE-unit; -30395; Runoff; 3000FT Burro Creek Sub5 Esx; 0; 2.60, 57, 0.1,
0.5, 38, 1, 0.1, 0.3, 3, 0.3, 6, 87, 55, 0.997, 0.9, 5, 0.85, 0.1, 0.04, 1.00,
0, 0.1, 1, 0.85, 0, LagV; P1; 0; Triangle Unit Graph
COMPUTE-unit; -30365; Runoff; Burro Creek Sub5 Esx; 0; 0; P1+P2
******; *******; *******; *********************LITTLE SYCAMORE******************
COMPUTE-unit; -30396; Runoff; 3000FT Little Sycamore Creek; 0; 1.5, 32.5, 0.1,
0.5, 19.1, 1, 0.1, 0.3, 3, 0.3, 6, 92, 65, 1, 0.9, 10, 0.7, 0.1, 0.03, 0.5, 0,
0.1, 1, 0.85, 0, LagV; P1; 0; VillageCreek.DGF
COMPUTE-unit; -30496; Runoff; 4000FT Little Sycamore Creek; 0; 1.5, 32.5, 0.1,
0.5, 19.1, 1, 0.1, 0.3, 3, 0.3, 6, 92, 65, 1, 0.9, 10, 0.7, 0.1, 0.03, 0.5, 0,
0.1, 1, 0.85, 0, LagV; P1; 0; VillageCreek.DGF
COMPUTE-unit; -30371; Runoff; Little Sycamore Creek; 0; 0; P1+P2
More runoff to come....
Important Note: Nothing on this page is intended as
interpretation of any legal authority such as water rights and supply. This page
is intended solely as a demonstration of techniques in flood potential
monitoring. The reader assumes all risk for any damages whatsoever in connection
with the access, use, quality, or performance of the supplied data just so you
know.
|
|