This example study has been completed. What I think I learned for even sub
tropical Florida:
1) Daily values need a summer season correction.
2) Daily values can vary day to day, but seasonal totals are quite good.
(mystery)
3) Hourly values, as usual, are poor andl need some manner of hourly
correction.... so on to the next studies with hourly corrections:
Big Creek, Ca., Beech Mtn, NC,
and Las Vegas, NV.
======================================================
One week into this study and we are hitting par for the course. Beginning
Oct 29, 2011 the AMX radar is down and is
waiting for parts. The MLB radar is filling in. The gage to radar
distance is now 130 miles compared to the AMX at 50 miles. Also 3 of the 4
Wunder gages are now under reporting rainfall. Things are working out just about as expected.
FUBAR! Might as well be using radar and Wunder gages for measuing
rainbows.
;-) AMX radar is back up Nov 1 and will be used. If you can't take
this heat, get out of the kitchen. We got gages to fry.
Summary Table
Ft Lauderdale Area Daily Rainfall
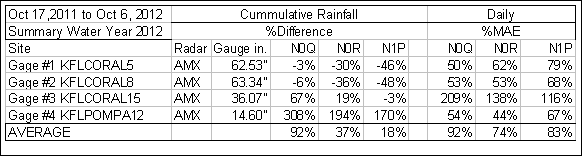
% Difference is the error in total rainfall, a
measure of bias.
MAE % is the mean of the individual daily unsigned differences,
a measure of error variablility.
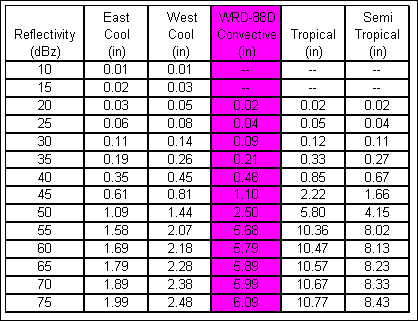
This new comparison of NEXRAD radar rainfall is with the new Ridge 2
Testbed N0Q Level 3 product with high dBz resolution of 0.5 dbz versus the old 5
dbz. Rainfall is
computed from the 5-minute radar images using the standard WRD-88D convective Z-R
relationship using GetRealtime.exe in real-time.
For additional information on NEXRAD radar rainfall using GetRealtime.exe go
here. For
info on the great new N0Q radar reflectivity product go
here.
GetRealtime dBz to Rainfall Conversion
****WARNING!!!***
Note that
Wunderground's rainfall accumulation parameter dailyrainin is now
preferred over HourlyPrecipIn because some gages are/were true hourly rates but
most now are moving 60 minute totals reported each 5 minutes, and some
are really odd, so be safer
than sorry and use dailyrainin.
Getrealtime.exe was updated 7/2/2012 to convert the accumulating dailyrainin
values to unit increments. All the unit values below were recomputed by
GetRealtime from the dailyrainin parameter with much better results.
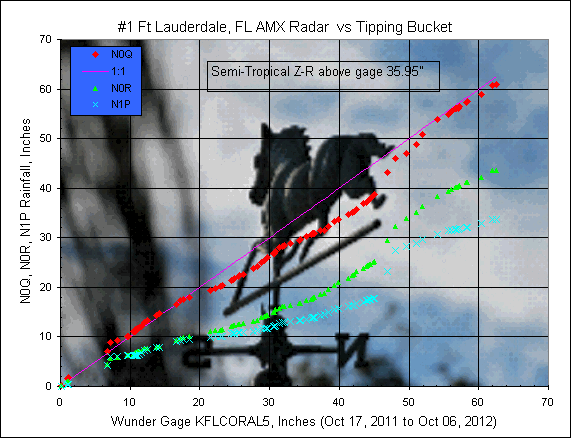
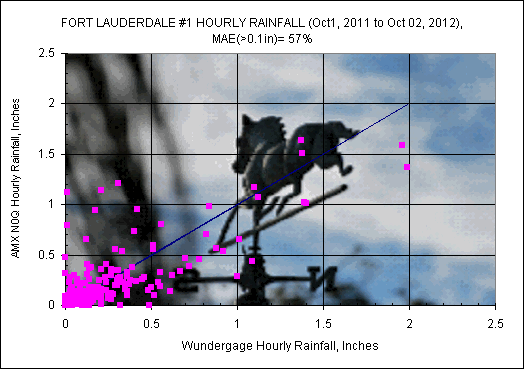
#1 Ft Lauderdale, Fl Wunder Gage KFLCORAL5:
Wunderground Gage:
KFLCORAL5, Lat 26.297, Lon -80.220, radar distance=48.6 miles, scan elev=3780 ft.
GetRealtime_setup.txt: KFLCORAL5; 10916; Rainfall; Ft Lauderdale Wunderground
GetRealtime_setup.txt: NEXRAD-AMX; 10915; Rainfall; Ft Lauderdale N0Q; 0 (0 is
for convective)
GetRealtime_setup.txt: NEXRAD-AMX; 10914; Rainfall; Ft Lauderdale N0R
GetAccess rsite table: 915; 10915; Ft Lauderdale, FL; 10; rainfall; inches;
inches; N0Q-Ridge2; NEXRAD-AMX; 9; FL
GetAccess rsite table: 914 10914 Ft Lauderdale, FL 10 rainfall inches inches N0R
NEXRAD-AMX 9 FL
GetRealtime Pointfile N0Q: 521,426,521,426 with 2nd line: 1
GetRealtime Pointfile N0R & N1P: 324,189,324,189 with 2nd line: 1
(note: Gage daily values computed from unit value rates based on a Pacific time
-3 hr shift to match radar.)
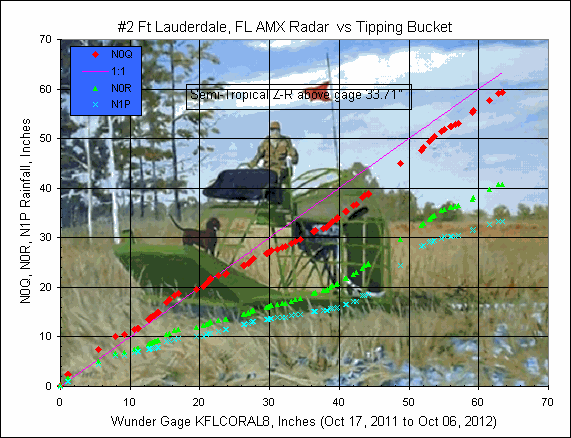
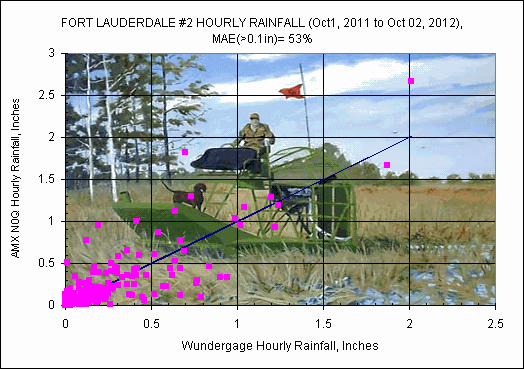
#2 Ft Lauderdale, Fl Wunder Gage KFLCORAL8:
Wunderground Gage:
KFLCORAL8, Lat 26.237 , Lon -80.257 , radar distance=44.4 miles, scan
elev=3350 ft.
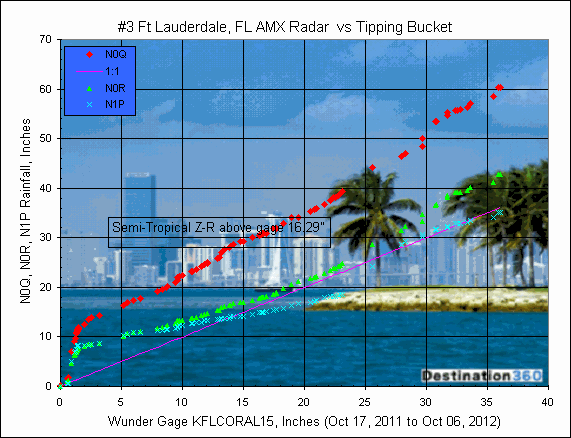
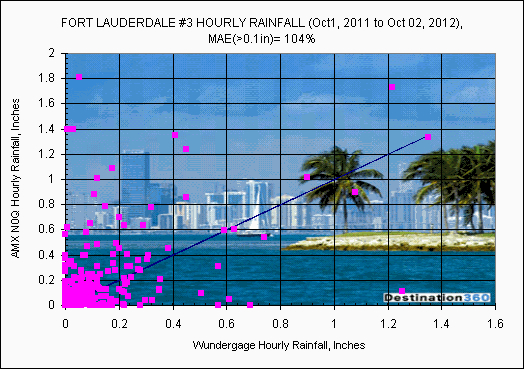
#3 Ft Lauderdale, Fl Wunder Gage KFLCORAL15:
Wunderground Gage:
KFLCORAL15, Lat 26.281, Lon -80.220 , radar distance=47.9 miles, scan elev=3710 ft.
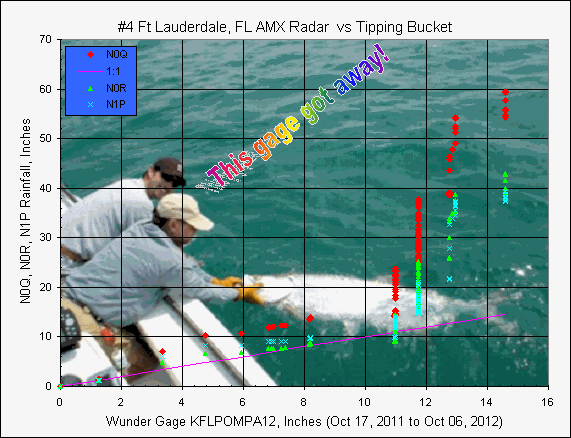
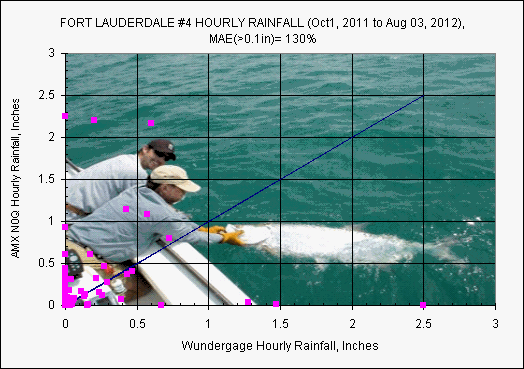
#4 Ft Lauderdale, Fl Wunder Gage KFLPOMPA12:
Wunderground Gage:
KFLPOMPA12, Lat 26.261, Lon -80.229 , radar distance=46.6 miles, scan elev=3570 ft.
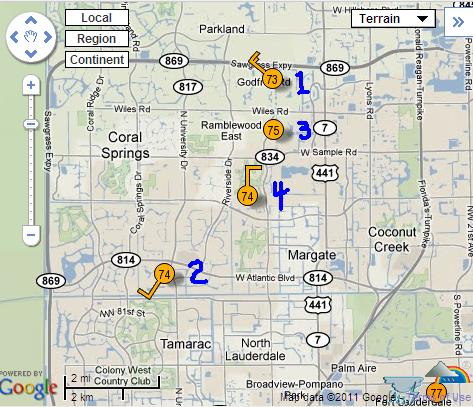
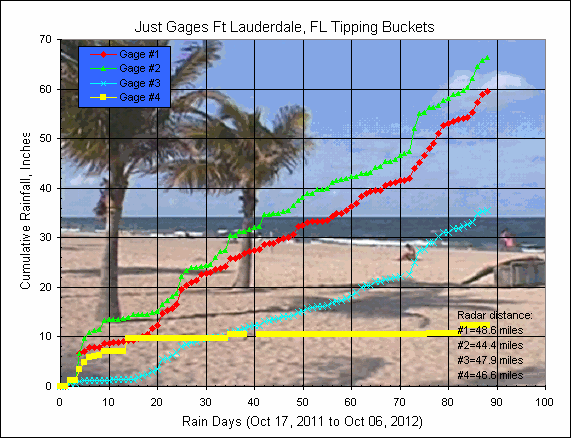
Just Wunder Gage Accumulations:
To see how variable reported rainfall can be at Wundergages located close
together. Gages 1 and 3 are just one radar image pixel apart. Gages
1 and 2 are 4 pixel west and 5 pixels south apart. Gages 1 and
4 are 1 pixel west and 3 pixels south apart. Pixels are
about 0.009 lat high and long wide or about 0.6 miles x 0.6 miles at these lower
latitudes.
All 4 gages have a complete daily record
and that says alot of effort and as a rough estimate of
reliability of the gages here are their year to date totals as of 10/20/20011:
Gage 1 KFLCORAL5 = 42.33" good and will be my rock.
Gage 2 KFLCORAL8 = 44.89" good and the farthest from
Gage 1
Gage 3 KFLCORAL15 = 27.50" oh dear and the closest to Gage 1
Gage 4 KFLPOMPA12 =36.82" ???
An inspection of the gage reported rainfall values for each time step for
October 18, 2011 below shows that two of the gages need greasing. Gage
#2 is so plugged it has been replaced as of 10/20/2011.
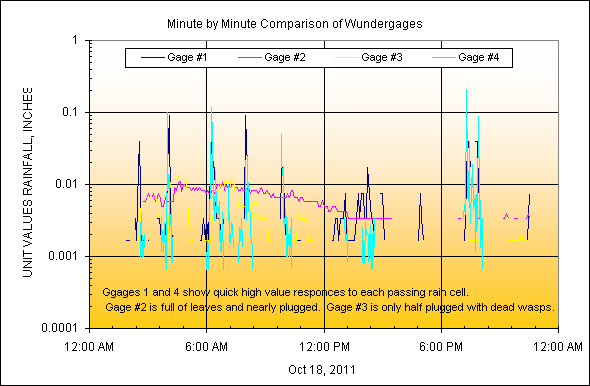
I imagine that this sample is par for Wunderground rainfall records where about
half of them are suspect. Luckily I am only using the daily values but you
can see how a slow draining gage can run over into the next day's values and
also may cause splashing out of heavy rain drops?
The above graph's rainfall values in inches are the amount for each time-step
and is computed from the reported rainfall RATE in in/hr so the minimum/maximum
amounts are not all comparible. Suprisingly Gages 1, 2, 3 had a pretty
consistant 5-minute time step. Gage 4 had random time steps of 1, 2, 3, 4,
and 5 minutes independant of rainfall rate. Not having an automated
weather station myself to deal with, I do not know why so often it is so hard for
Wunderground gages to have such a hard time with such a simple concept.
For more radar rainfall comparisons and trials and tribulations, go to
my original
comparisons here or current comparisons at Beech Mtn, NC
here.
|