|
NOTE ALL TIMES ARE FOR MY PACIFIC TIME ZONE
source: Wunderground/Intellicast
Current
composite radar loop above.
Beginning Oct 1, 2017 the N0Q and PTA Nexrad producuts have been dicontinued and
replaced with the A2M multi-radar multi-sensor rainfall rate product by the
NSSL(?). Because only the 2 distant airports have heated precip gages and
N0Q over shoots the winter precip, I will compare the UNADJUSTED A2M to the Wundergages until
snow starts. So if
it says N0Q I mean A2M.
UPDATE Dec 1, 2020: I reactivated the A2M again and found my A2M color to
precip table was missing precip values below 0.08 inches whis is a BIG deal in
winter so I've fixed that and here we go again. You might want to check
your values in your file RGB table with this:
Level3RGB2RainRateA2m.txt
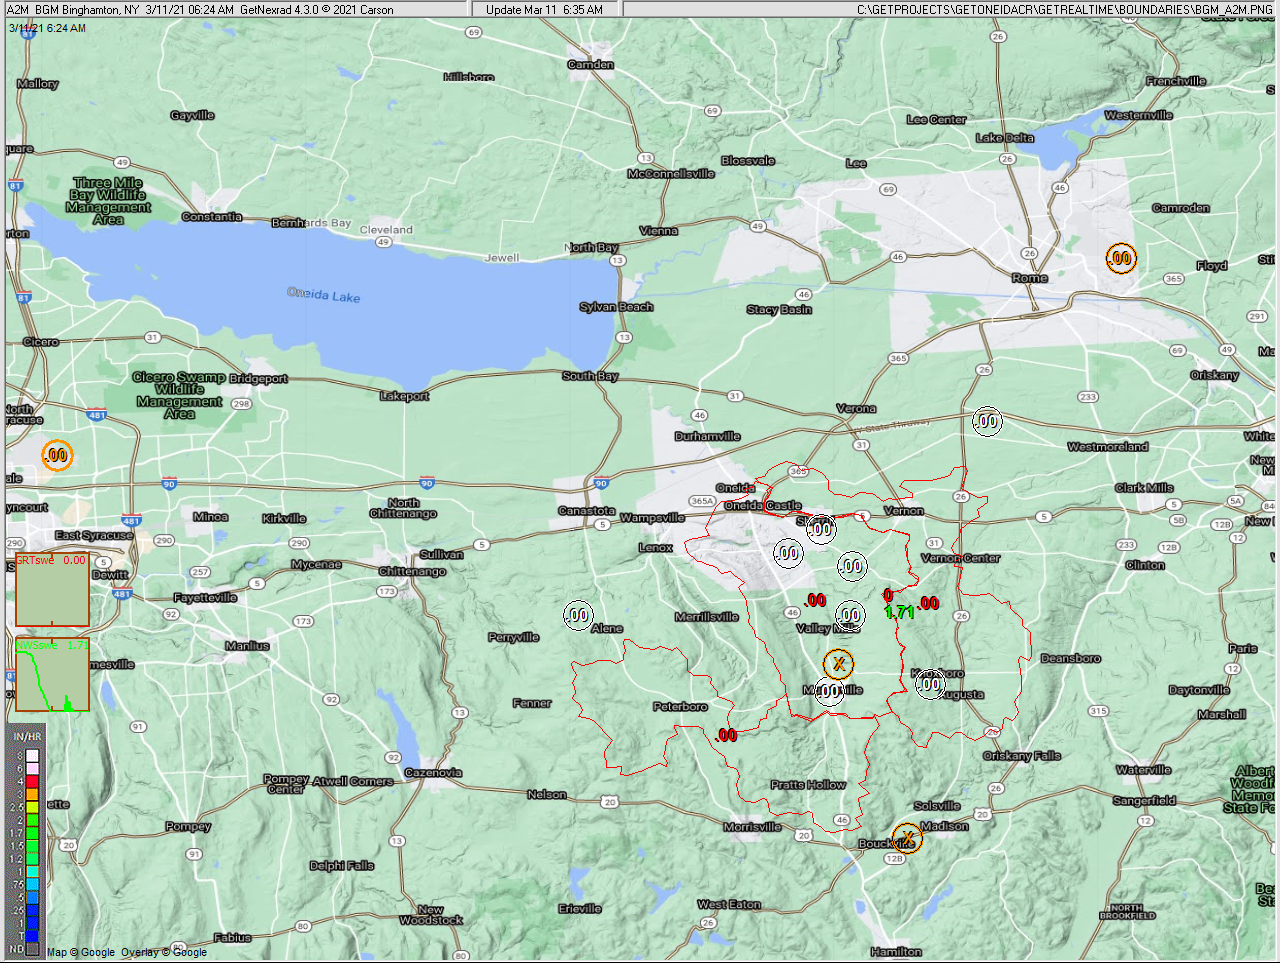
Below is my GetNexrad
zoomed N0Q radar area 56 miles
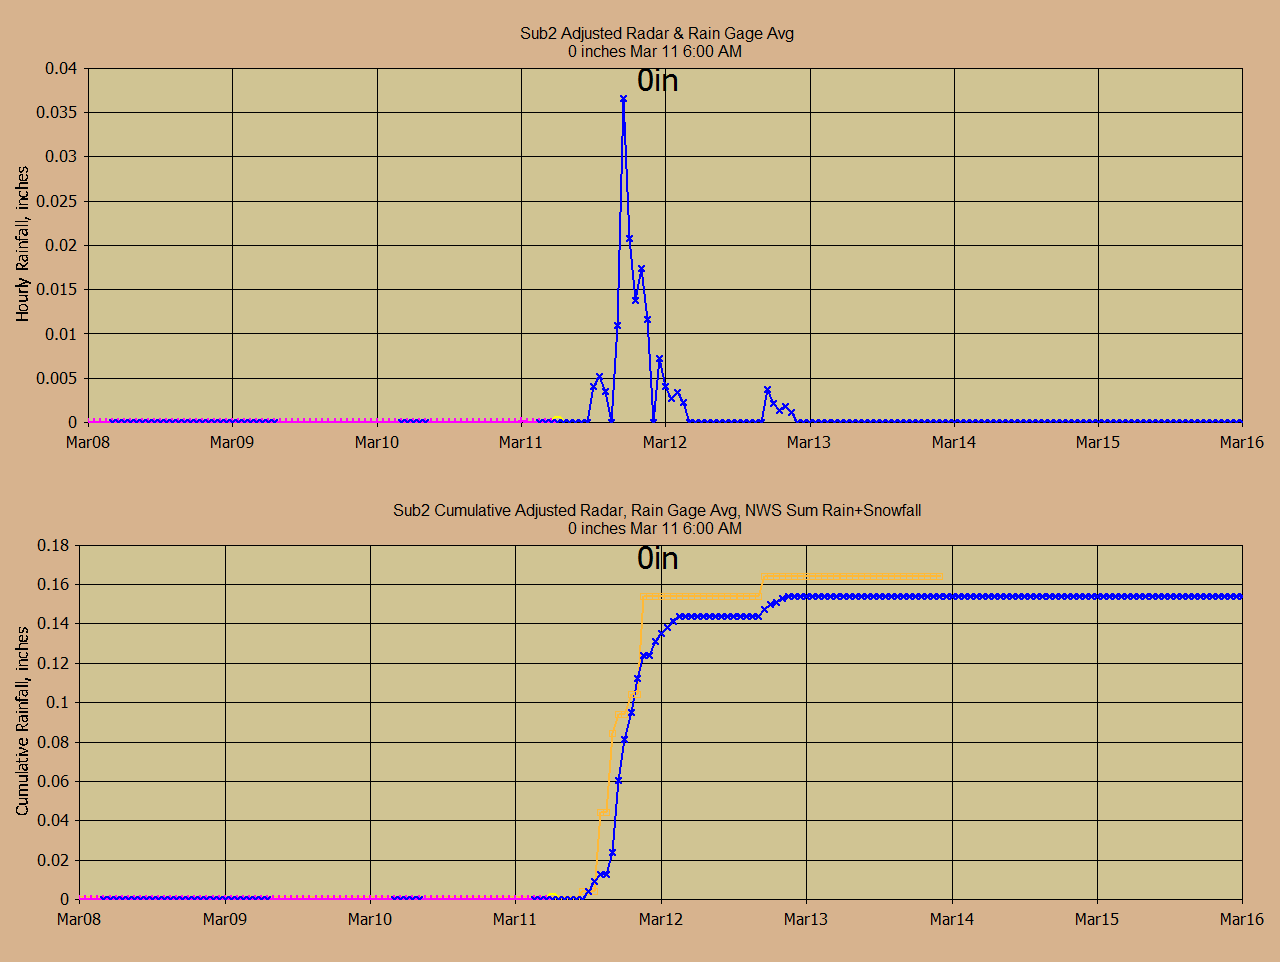
north of the BGM radar, Wundergages (white), adjusted N0Q radar rain (red) at watersheds over the
Oneida Creek
3 sub-basins. Displayed values are for rain gages and adjusted radar for
yesterday through
time shown (no forecast nor snowmelt). 5-minute radar
N0Q cells are 0.57 x 0.70 miles (1km x 0.5 dBZ). The 5-min radar is
adjusted hourly with the Gage/Radar ratio. The heated rain gages at the Syacuse
and Rome Airports are used when the closer Wundergages are frozen. When
snowing and not raining, a daily or 2-hour G/R ratio instead of hourly
may be
used. Latest changes to setups are posted in
the Rouge's Gallery of Snowmelts section below.
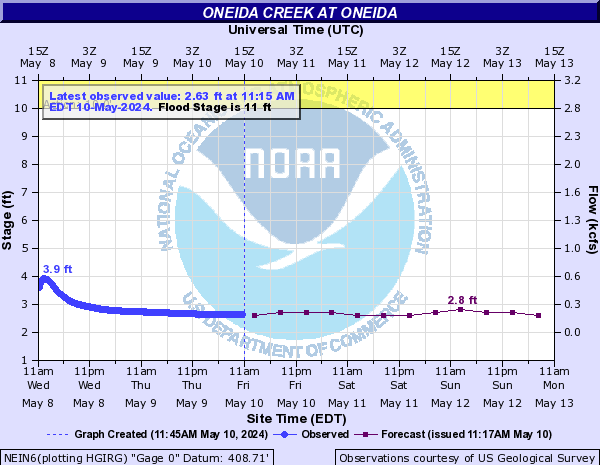
Thew NWS operates a
flood forecast for this gage here:
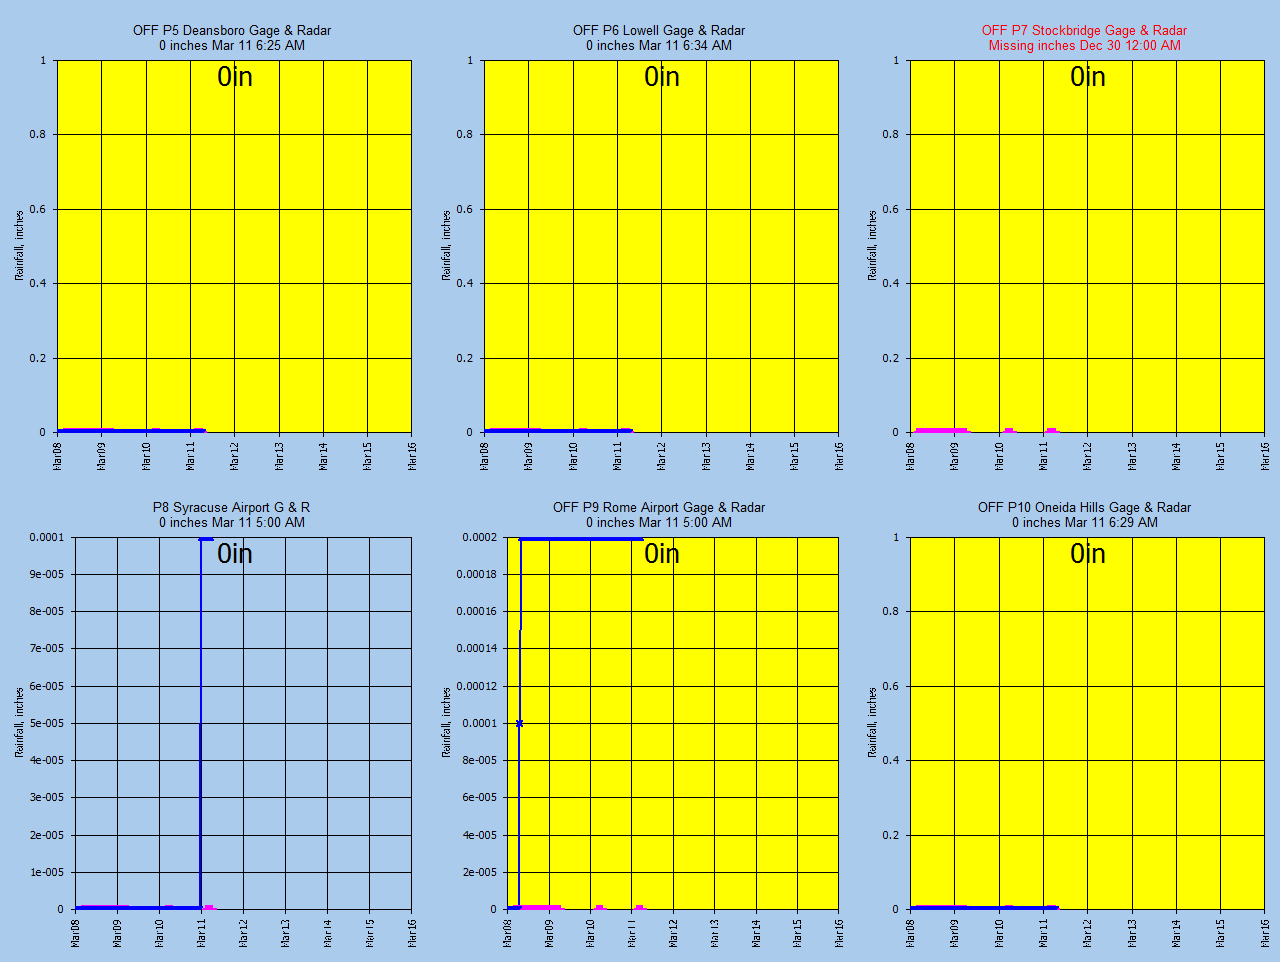
Yesterday and Today's Rainfall with
Unadjusted A2M Radar.
White circles ON gages, Black cirles OFF, Red values subbasin
unadjusted
A2M precip.

NWS Model Point 7091B_MADIS Compared to GRT Using NWS Rain+Snow Precip:
(Out of date)
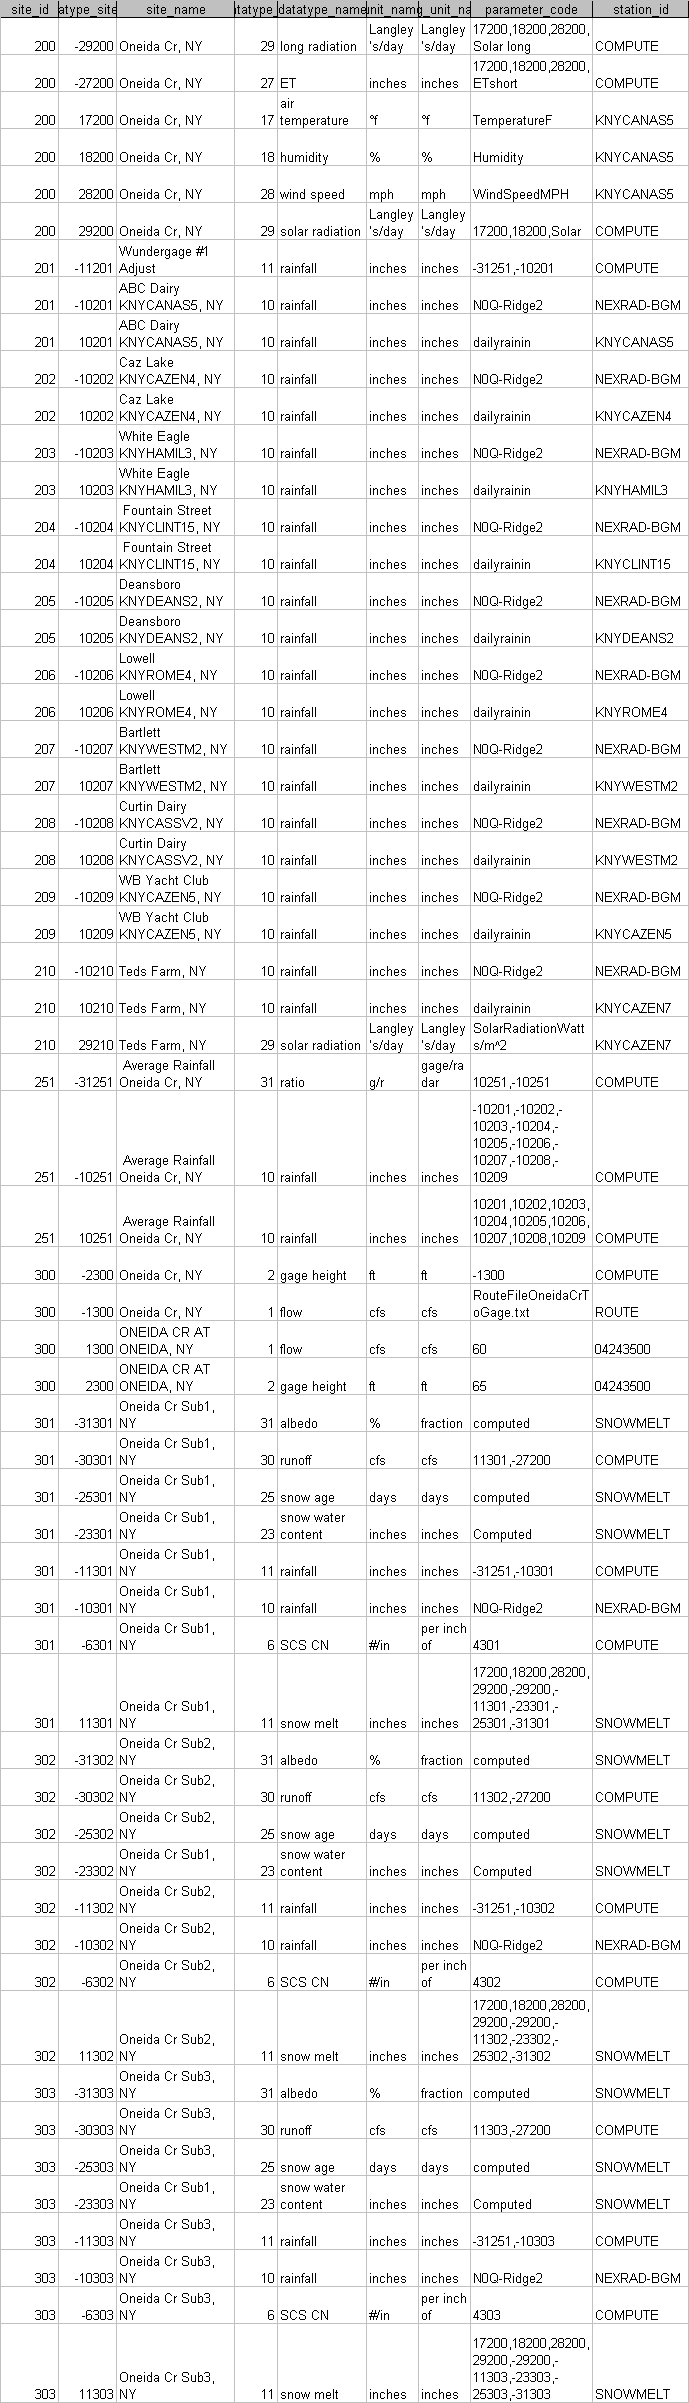
Gages in the Oneida Creek area:
KNYCANAS5; 17200; Temperature; Oneida Cr, NY
KNYCANAS5; 18200; Humidity; Oneida Cr, NY
KNYCANAS5; 28200; Wind Speed; Oneida Cr, NY
KNYCANAS5; 10201; Rainfall; ABC Dairy, NY
KNYCAZEN4; 10202; Rainfall; Caz Lake, NY
KNYHAMIL3; 10203; Rainfall; White Eagle, NY
KNYCLINT15; 10204; Rainfall; Fountain Street, NY
KNYDEANS2; 10205; Rainfall; Deansboro, NY
KNYROME4; 10206; Rainfall; Lowell, NY
KNYWESTM2; 10207; Rainfall; Bartlett, NY
KSYR; 10208; Rainfall; Syracuse Airport, NY
<<HEATED
KRME; 10209; Rainfall; Rome Airport, NY <<HEATED
KNYCAZEN7; 10210; Rainfall; Teds Farm, NY
KNYCAZEN7; 29210; Solar Radiation; Teds Farm, NY; 0; 0; 2.065*P1
KNYCANAS10; 10211; Rainfall; Smithfield, NY
KNYERIEV2; 10212; Rainfall; Erieville, NY
Automated graphs and radar:
Three hour Nowcasts are being
evaluated on
my web page here.
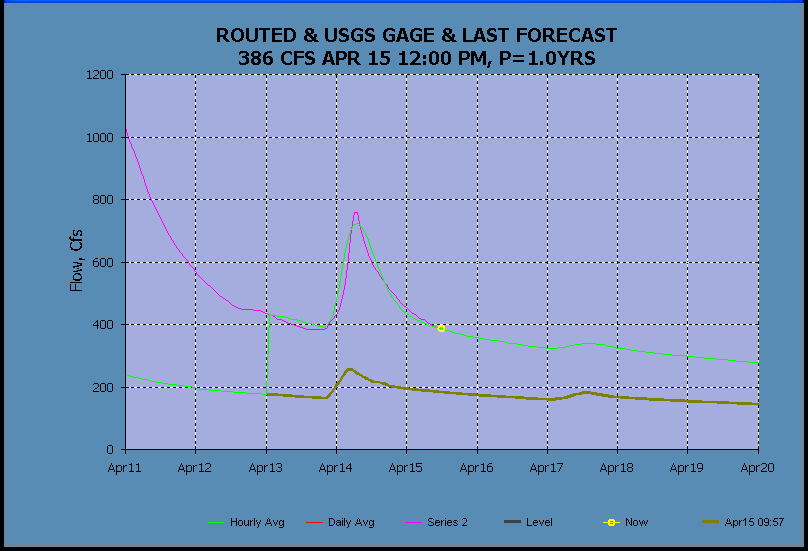
Last Forecast
(thick olive green) is the last forecast ran for the previous day.
Values shown as % are mean absolute error when either value > 0.05 inches as
Sum G*|G-R| / Sum G*G.
3-hour
Nowcast and NWS Forecast w/Vegas Type 3 distribution and Unadjusted Radar (pink)
and triangle forecast alert > 0.1 in/hr:
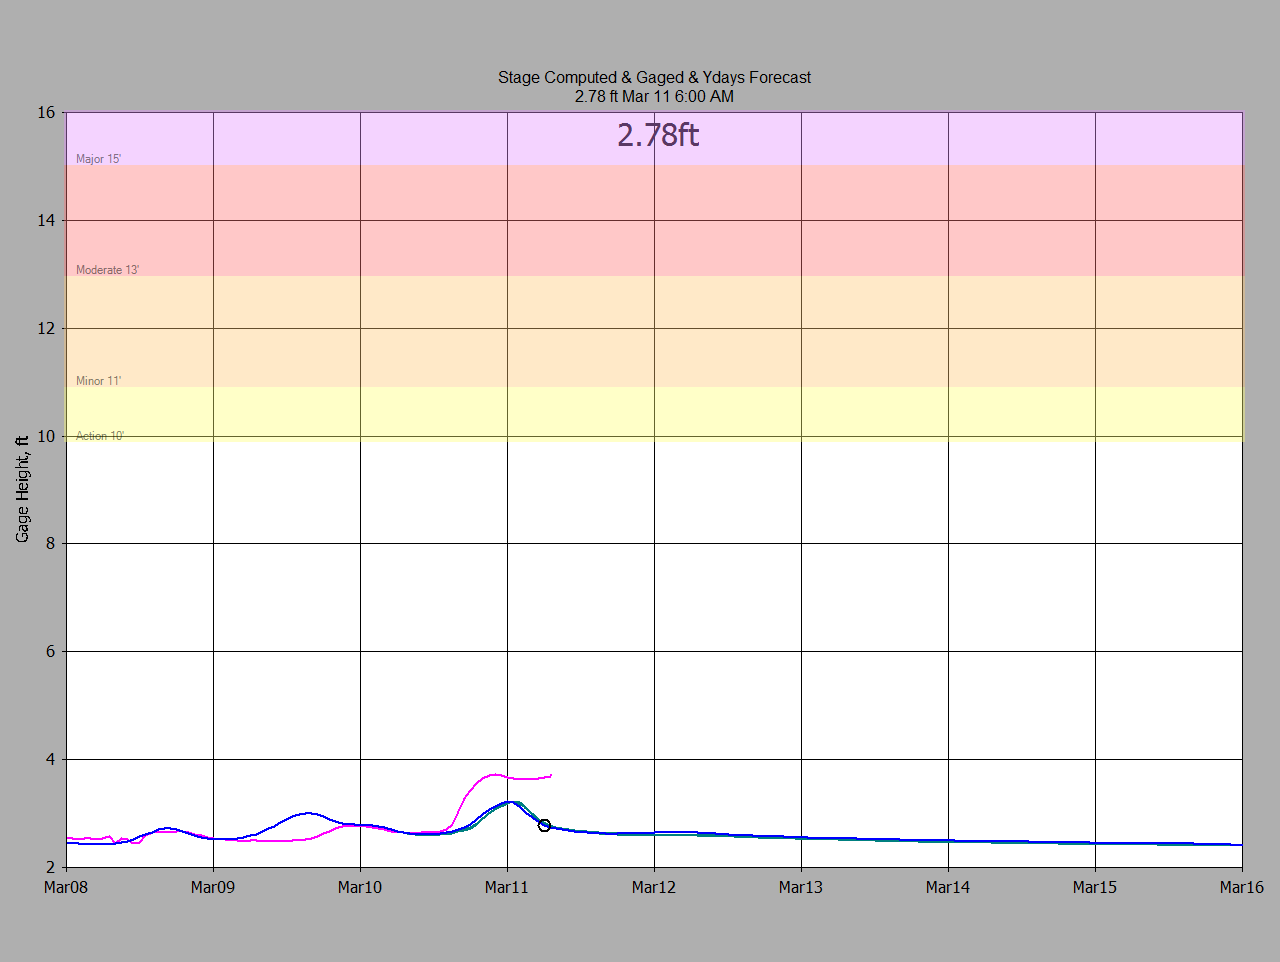
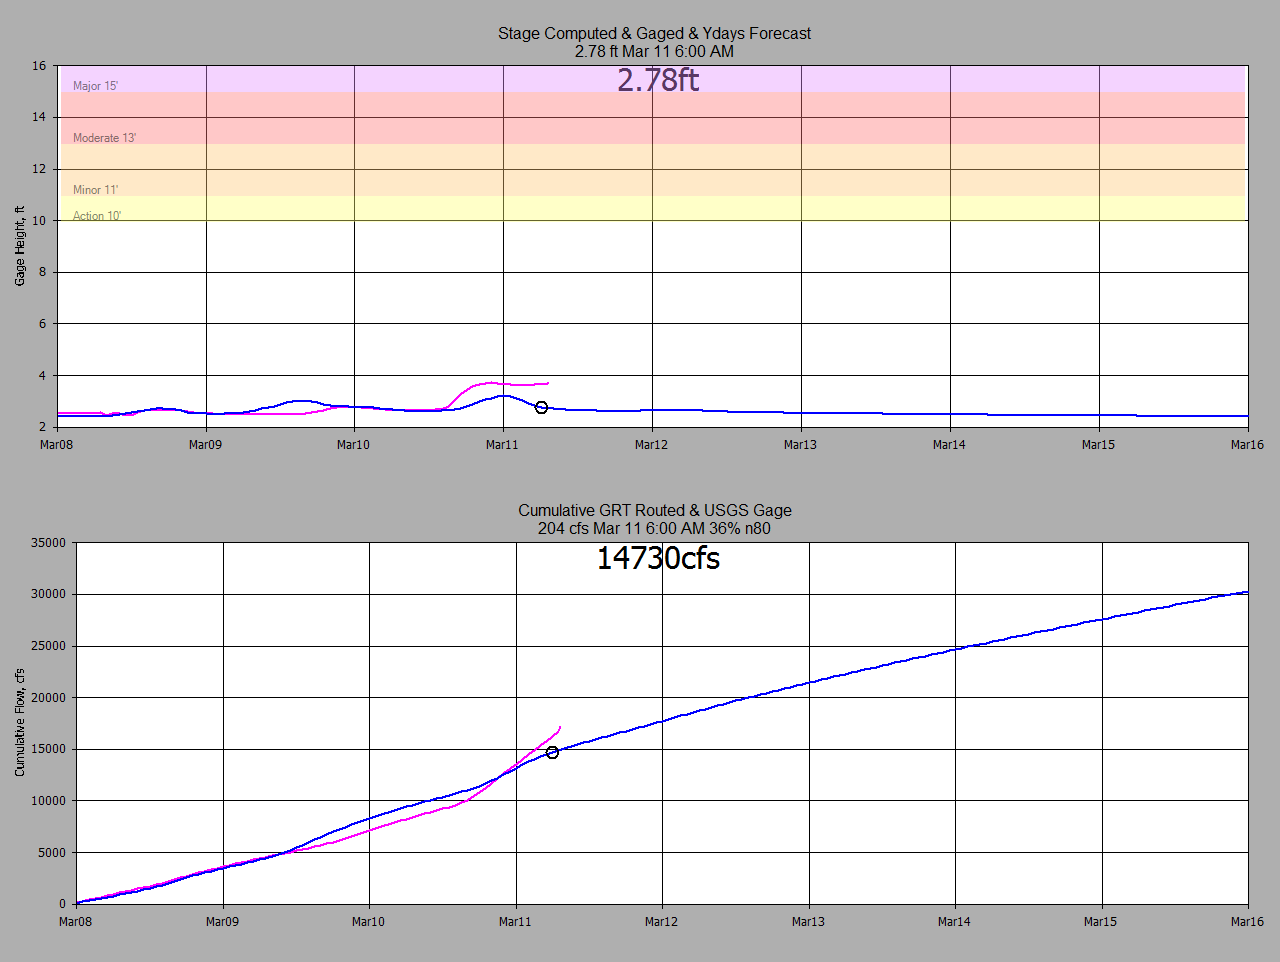
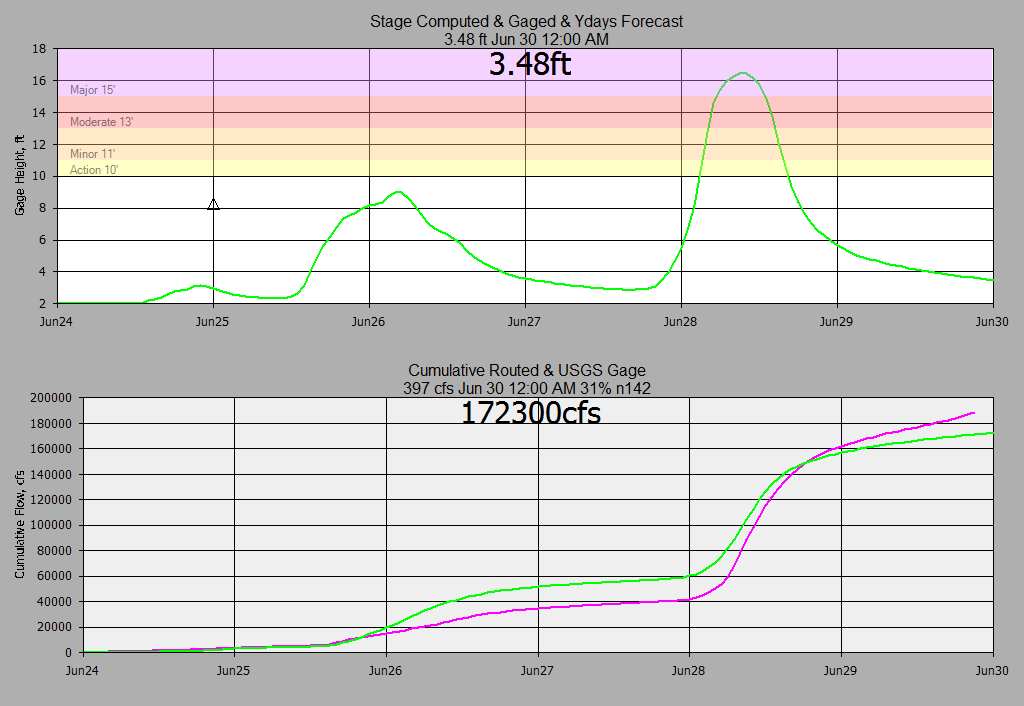
Flood Stage at Oneida Gage (model, USGS, and yesterdays forecast):
======================================================
More Current Info when Snowing or Nowcasting..............
======================================================
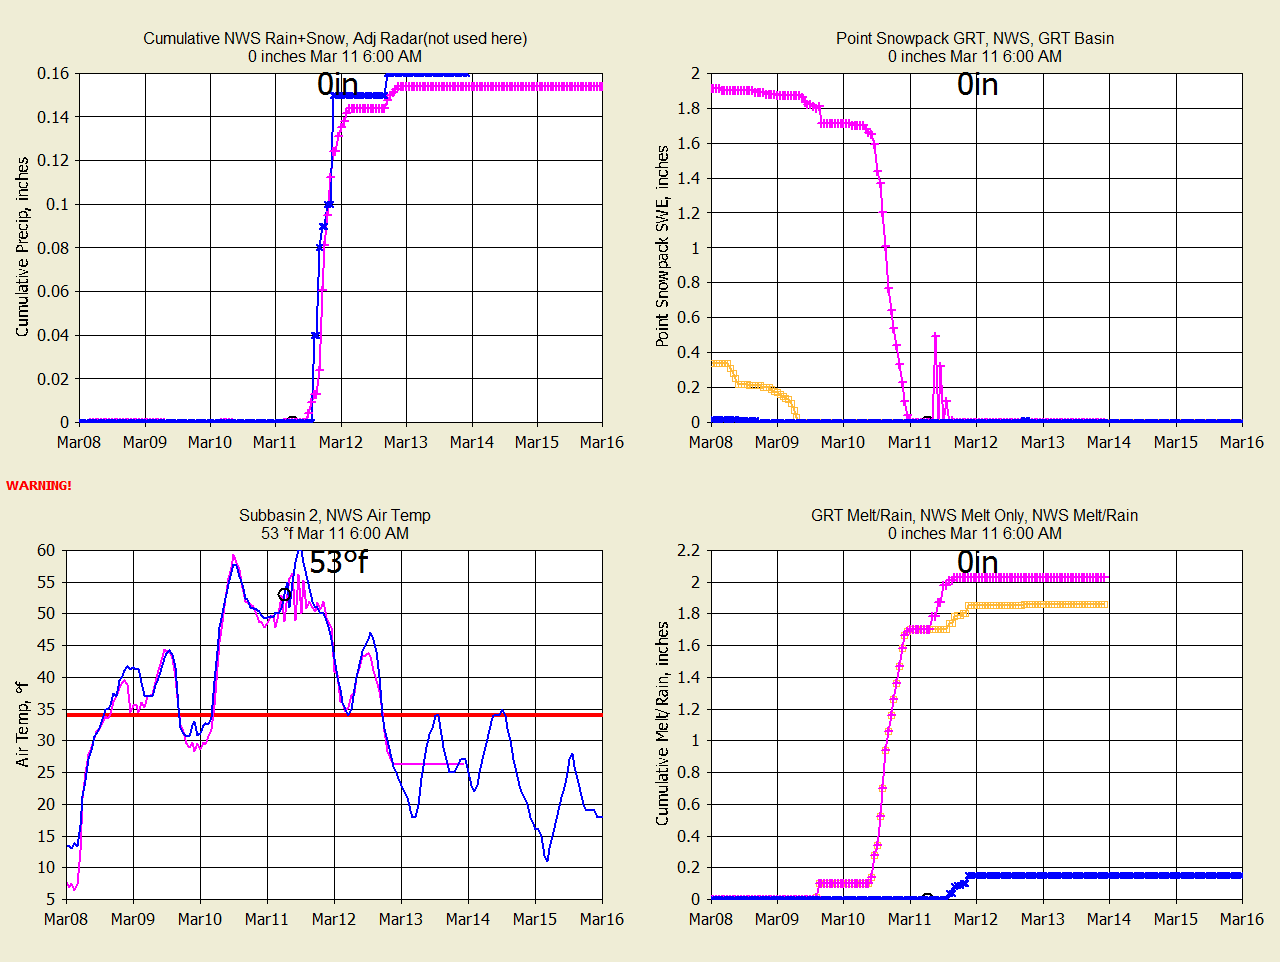
Summary of Snowmelt (Series 1=Blue, Series 2=Pink, Series 3=Orange):
GetGraphs
Current Gage Rainfall and Radar
(pink) used for adjustments (Yellow graphs are turned OFF):
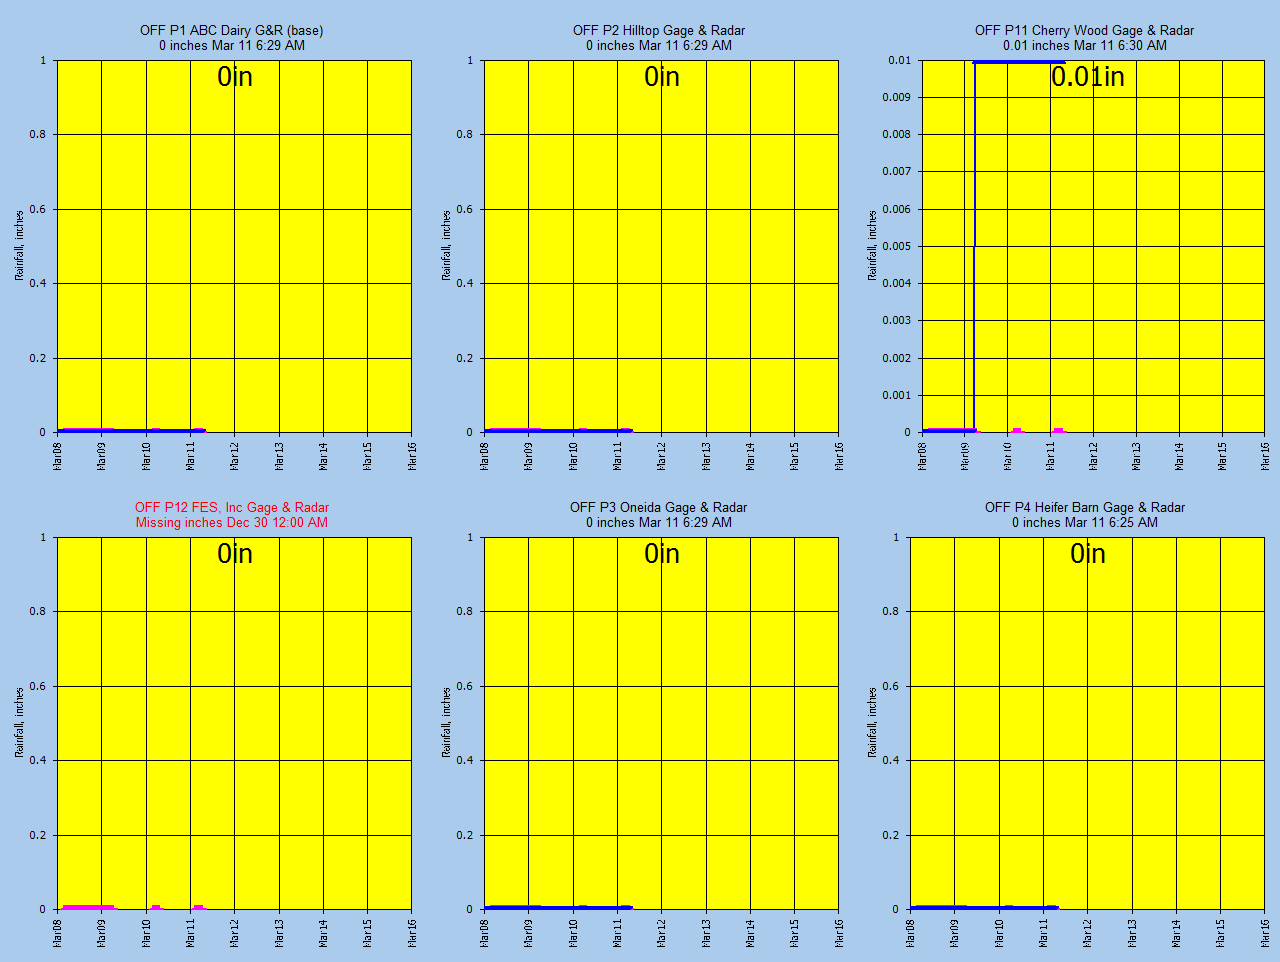
GetGraphs
Current Gage Rainfall and Radar
(pink) used for adjustments (Yellow graphs are turned OFF):
GetGraphs
Current Ratio Adjustment and UnAdjusted Rainfall and Raw Radar (pink):
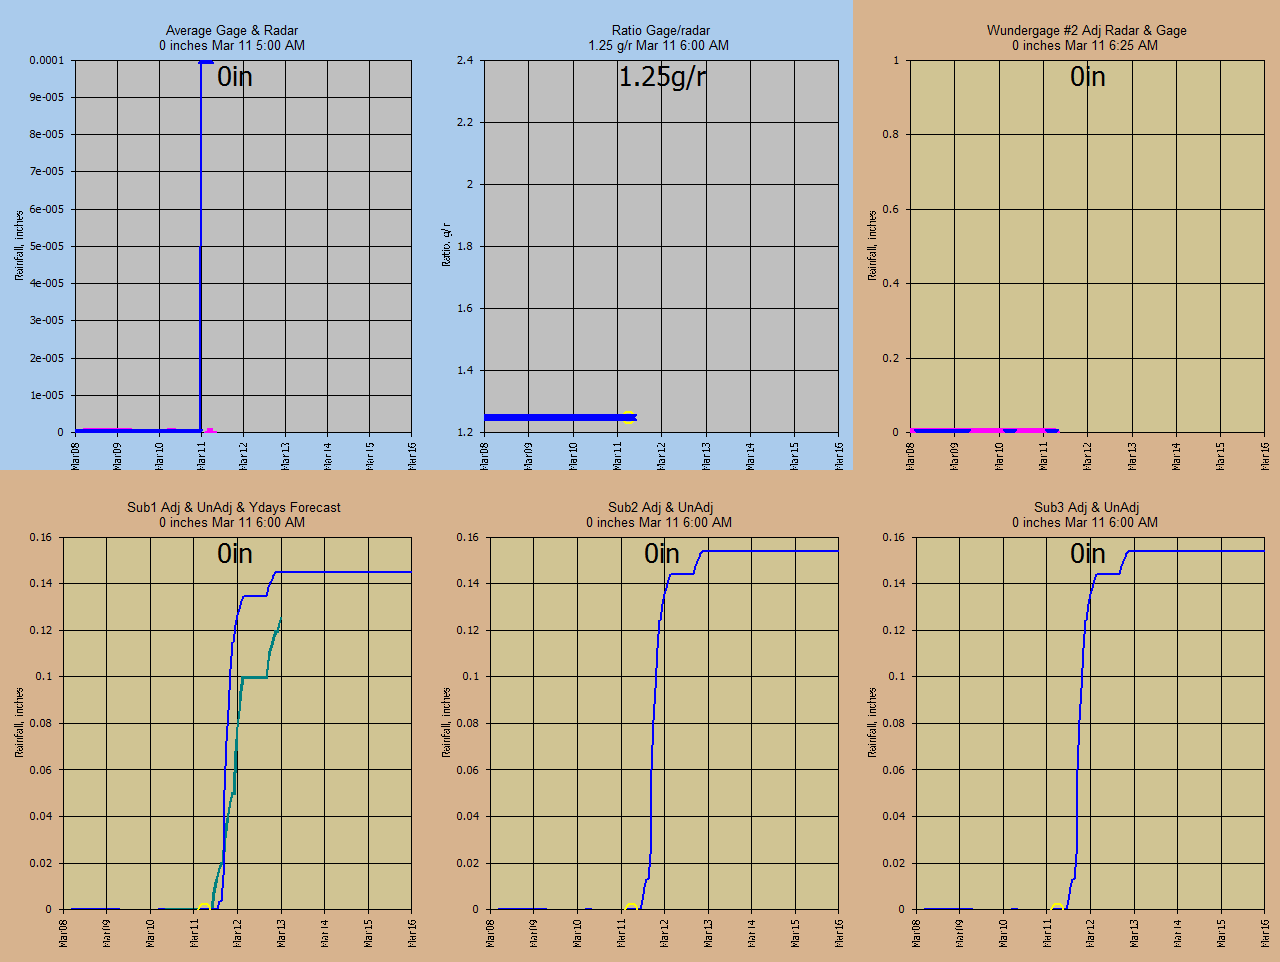
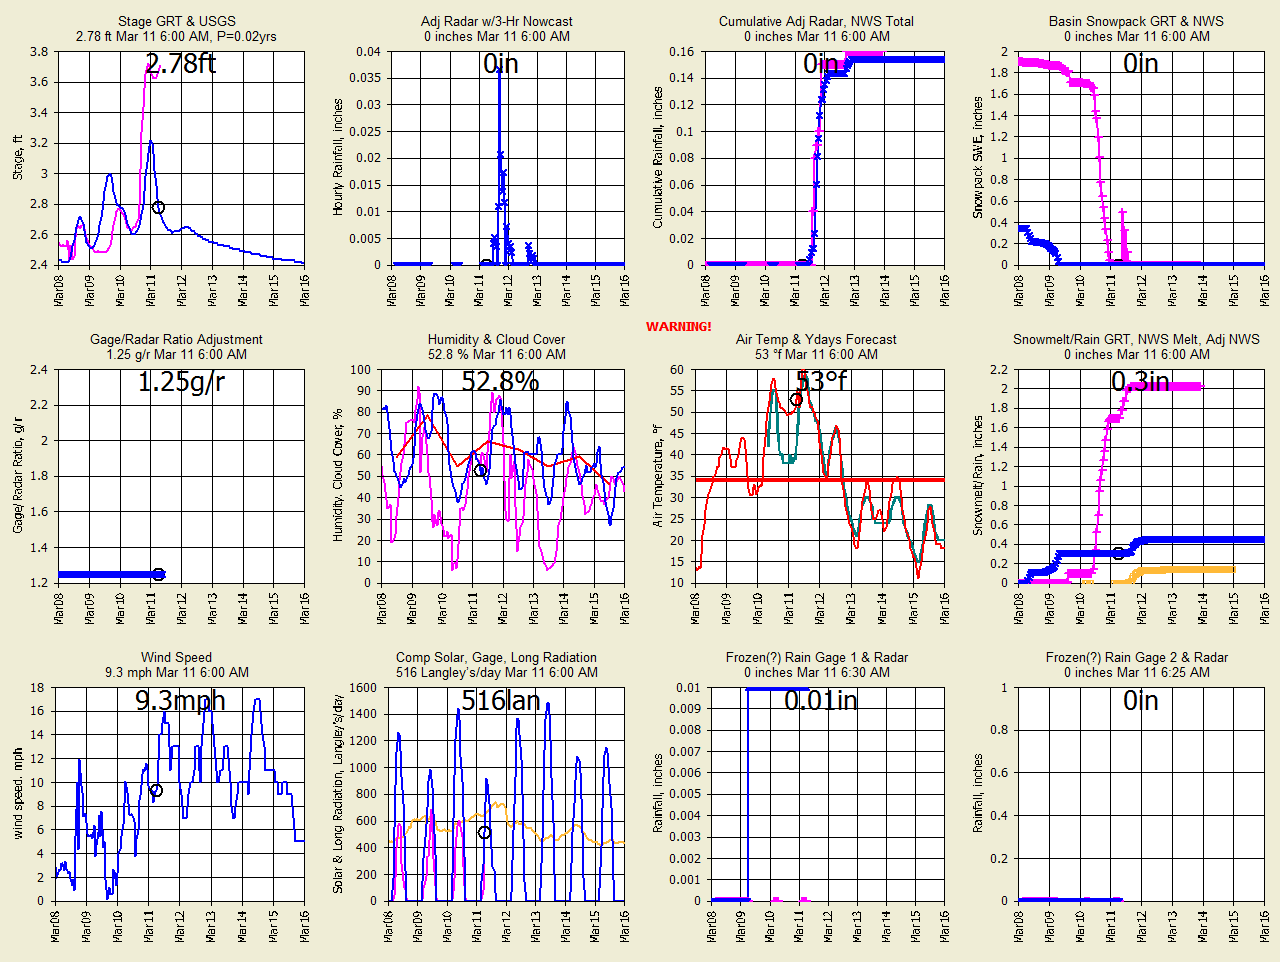
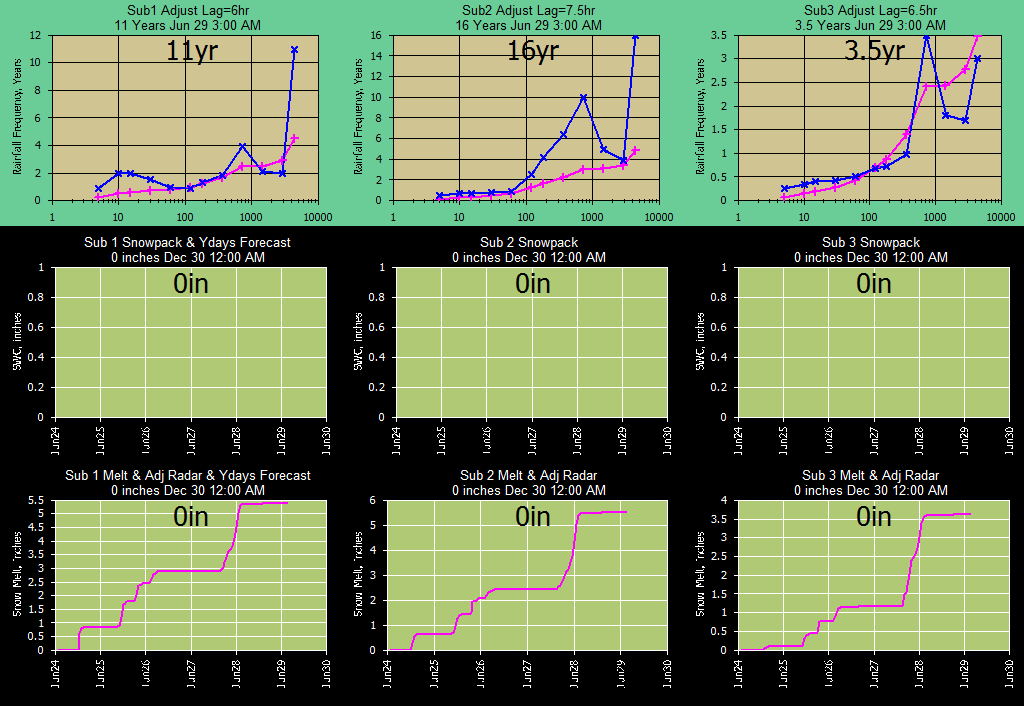
GetGraphs Snowmelt Data and Forecast:
GetGraphs Subbasin Adjusted Radar Rainfall Frequencies
(blue) and Rain Depths (pink), Xscale in Minutes
and Subs 1,2,3 Snowpack and Melt/Rainfall:
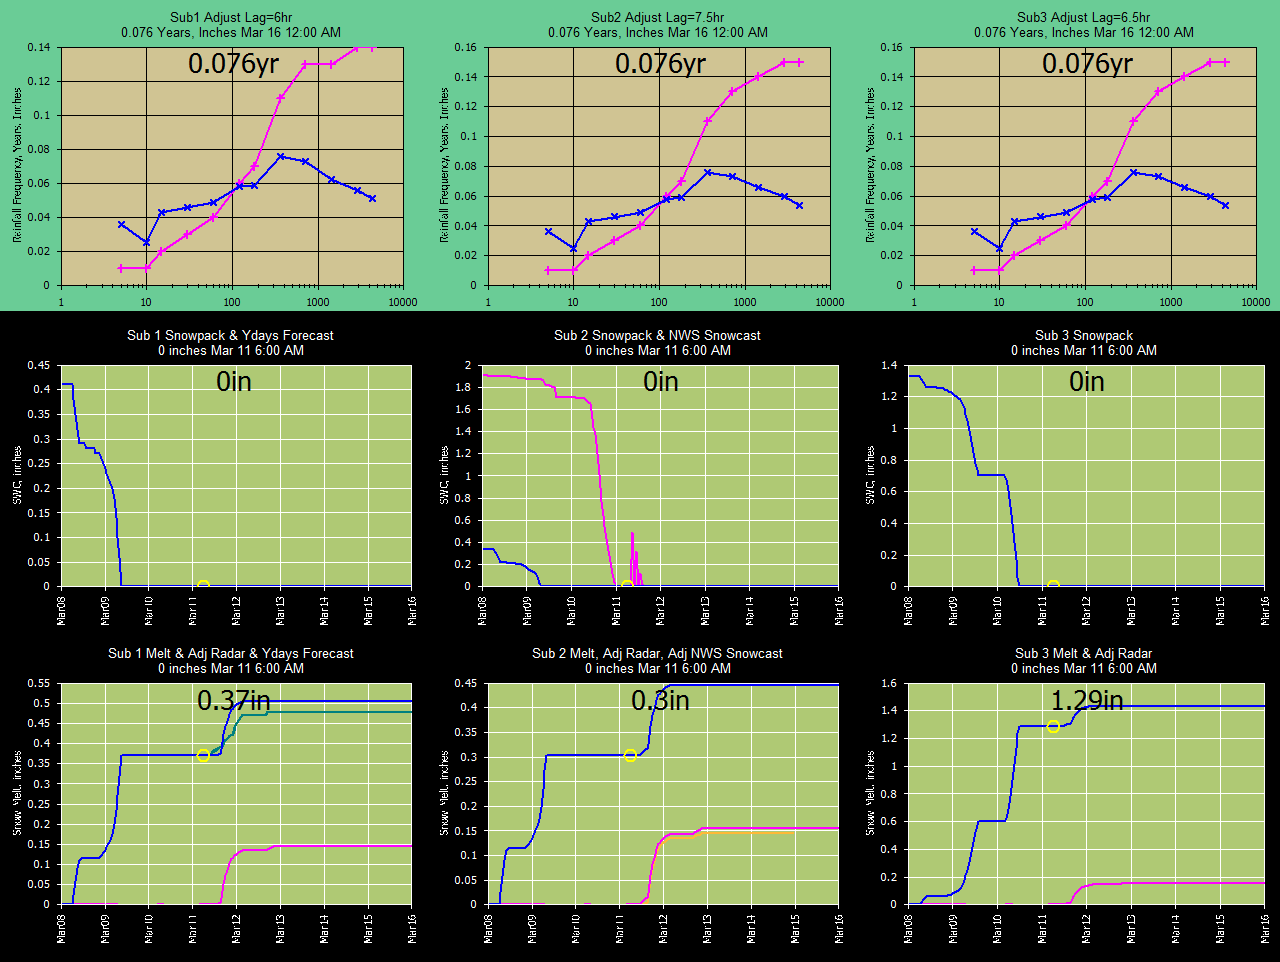
GetGraphs
Current Runoff and Forecast (USGS gage in pink) and graph max runoff recurrence P=X yrs:
GetGraphs
Computed Stage (USGS gage in pink) and Volume Check:
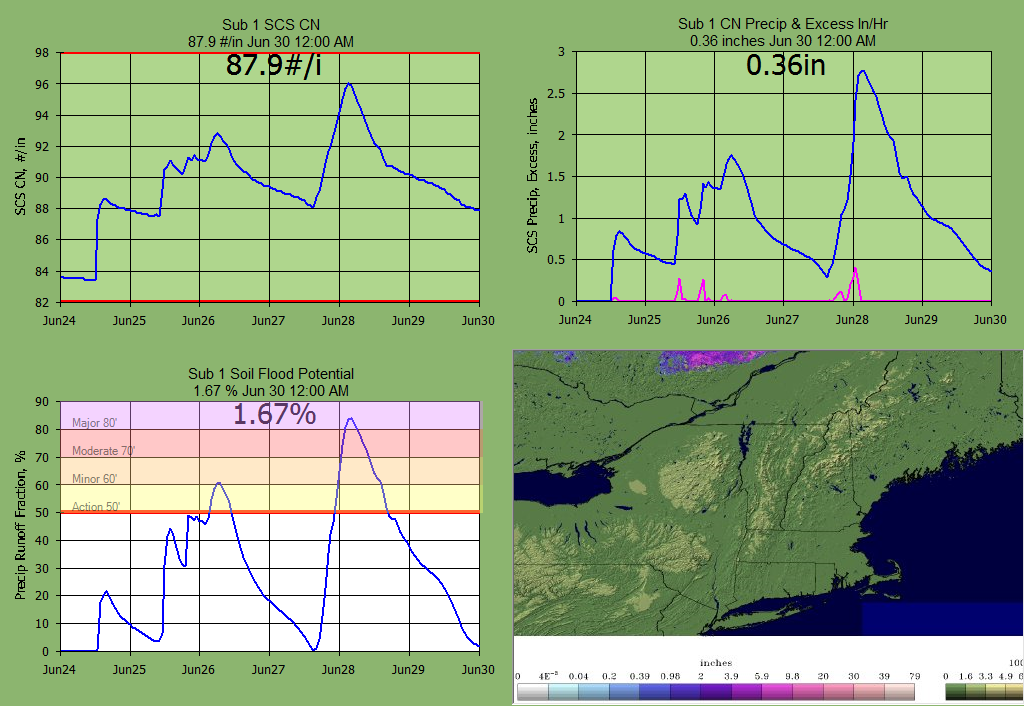
GetGraphs Soil Moisture Space Converted to SCS Curve Number Equivelant
CN=1000/(Soil+10)
(when the soil get's into the 90's you're sitting on a time bomb)
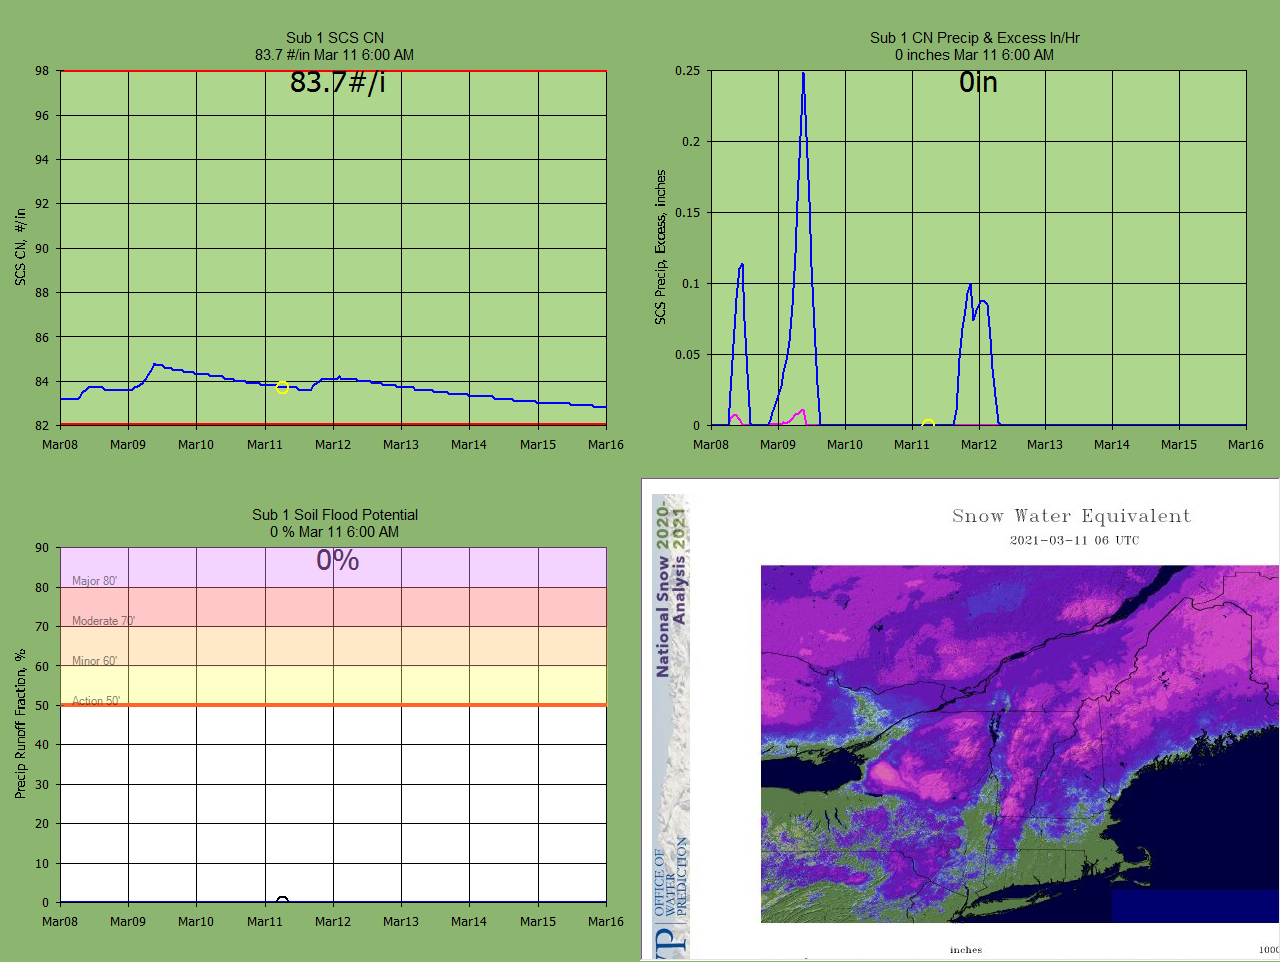
GetGraphs Current Eye on the Snow:
Top Left: 42.971 -75.940 > 846 ft
Top Right: 43.158 -75.462 > 559 ft
Bot Left: 42.972 -76.101 > 981 ft
Bot Right: 42.969 -75.807 > 1,389 ft
 
 
Long term hourly
rainfall, runoff, and soil storage updated daily:
Unadjusted A2M Radar:
Daily A2M
Radar Accumulations:
Daily Peak Flow Errors:
Older
N0Q Adjusted Radar:
Months 1 & 2 summer Radar Avg VS Gage Avg Accumulations:
Winter Radar Avg VS Gage Avg Accumulations
(note N0Q at Gages ratio is pretty close to 1.0):
Hourly Adjusted Radar at the ABC Dairy Wundergage. Note 20% MAE for
adjusted hourlys is par for the course. The reason adjusted hourly MAE is
important is for runoff. Runoff don't care about the NWS slick willy's
bias for dailys above. But for winter snowpack accumulations, slick willy's bias will do just
fine. Ooops, maybe not here where the snowpack melts every other day.
Back to Summer Radar 2015:
2015-2017:
Months 1 & 2 using
1-HR RATIOS of gageAvg/radarAvg:
(Note how the initial SCS CN was too low and now soil and groundwater base flow
rose with events.)
Months 3 & 4 using
HARD SET RADAR RATIO ADJUST= 1.0 after Nov 12 freeze when snowing. No heated
Wundergage yet: Melt runoff calc losses will be reduced 15% by GetRealtime
when snow present to account for frozen soil.
Months Dec and Jan
and Feb: Heated rain gages are being used at the Syracuse and
Rome Airports. Different unit graphs are under investigation for snowmelt
but the Curve Number losses seem fine.
Months
Mar and Apr: Heated rain gages are being used at the Syracuse and Rome
Airports
Months Mar and Apr: Back to summer unit graph, convective radar z-r.
Months Jul, Aug and Sep:
Months Oct
2015 to Apr 2016:
Months Apr 2016 to Oct 2016:
Months Oct 2016 to ...:
Soil moisture space as
SCS curve numbers for the Subbasins: mbers for the Subbasins:
Getting base flow started:
For this basin
(swamp storage) I decided to use the GW return for long duration base flows
instead of quick reponce interflows that I have a bad habit abusing. The
SCS CN soil return flow is easy to usually get with silt loam B 0.17 return
factor for the entire basin and matched the semilog recession slopes of the USGS
gage. To make things easy start with the lowest flow of last year for a
base flow. Then set the Soil Loss Factor for a first fit and jiggle the GW
loss and speed factors to hit the dry period around Oct
1-20. I used a dimensionless unit graph for a like sized basin in Alabama where I had removed the return flows and adjusted the dimensionless
graph fit so interflow was in my construction. Most off the shelf
dimensionless graphs like the SCS do not seem to want to include interflow
recessions so you end up using lower CN to get the peak but an evan lower
recession (but always start with SCS to get your bearings). And there is
always the 3-triangular unit graphs when nothing will fit except making another
dgf. I never
actually look at this type graph but it is instructive to see what GetRealtime
calcs are doing (see Runoff Wizard Write Runoff text).
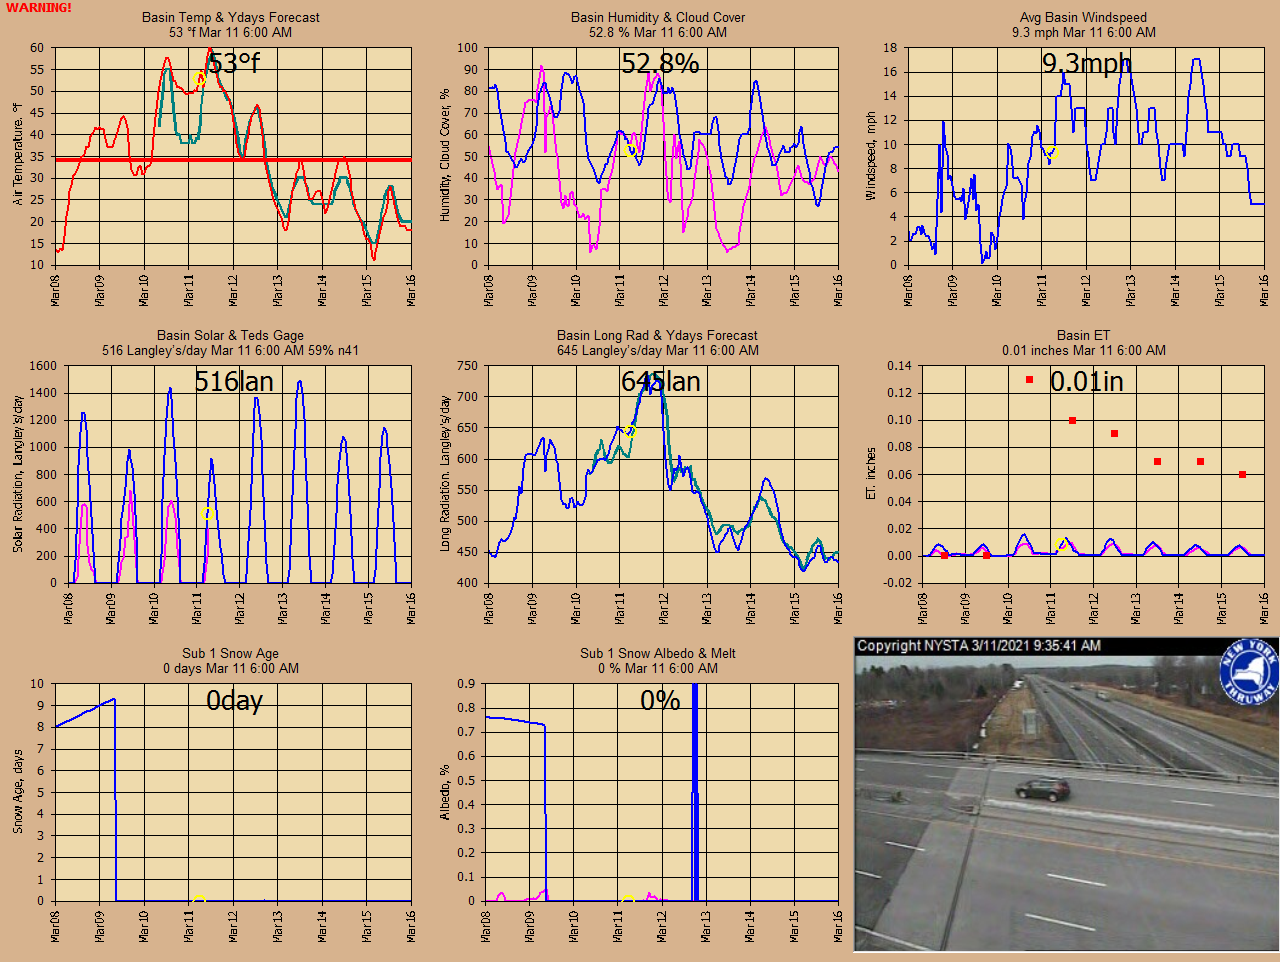
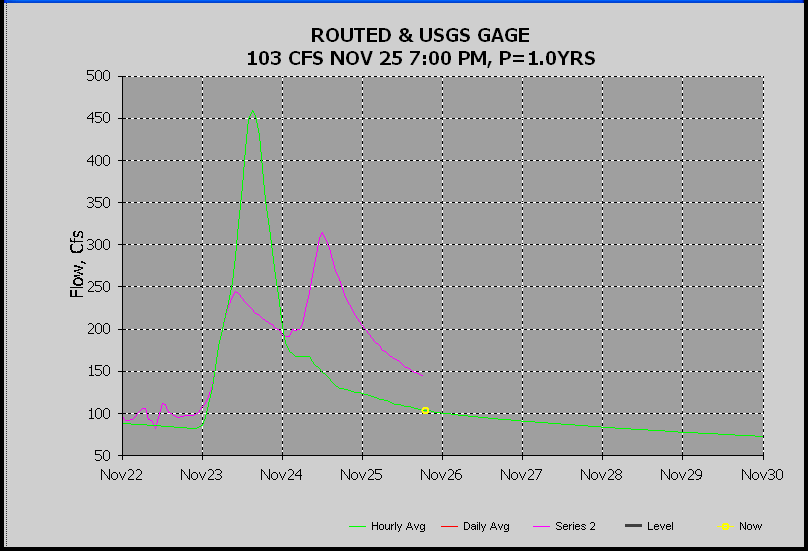
Rogue's Gallery of Snowmelts (temperature
sensitive):
Nov 23, 2014: The long wave radiation could be adjusted to set the timing of the
melt and peak for this date. I finally decided to use the long wave adust=1
which matched the timing perfectly but the peak was way high. The snowmelt
factors used are: 0, 1, 0.75, 1, 1, 1, 1, 34 where 0.75 is wind. If
my computed long wave radiation had just dropped soon enough then this peak
might have been avoided. Solar radiation adjustment had little affect on
the timing or peak.
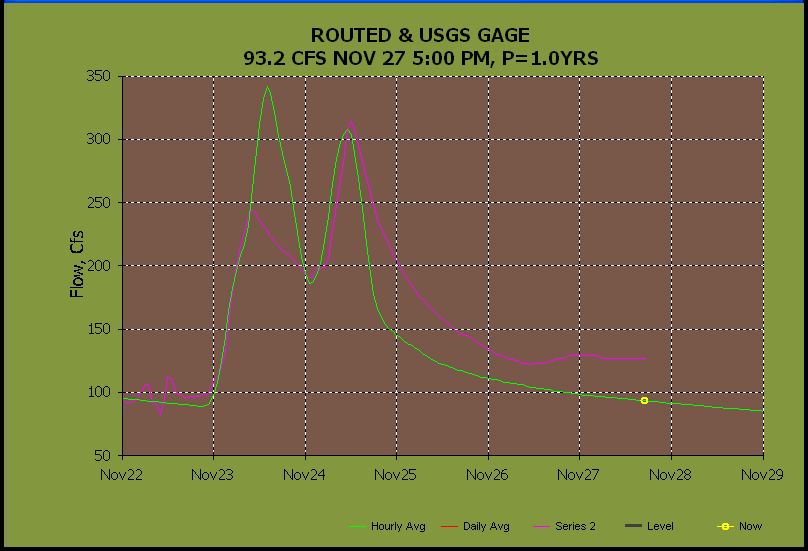
Nov 23, 2014 Update: After further review of the above
snowmelt I changed the Temp adjust and a Long Wave factor for Sub 3 as below.
Snowmelt in Green, USGS in pink. The blues show Sub3 melt moved.
Oneida Cr Sub1, NY; 0; +1, 1, 0.75, 1, 1, 1, 1, 34
Oneida Cr Sub2, NY; 0; -1, 1, 0.75, 1, 1, 1, 1, 34
Oneida Cr Sub3, NY; 0; -2, 1, 0.75, 1, 0.9, 1, 1, 34
And when you match the peak but the gage recession has shifted, either the USGS
gage rating shifted or now winter soil losses changed.
And I don't think the USGS field man gets paid enough this time of year so I
assume the latter. But I've seen better gage ratings than this one so the
poor field man better get out there. ;-)
 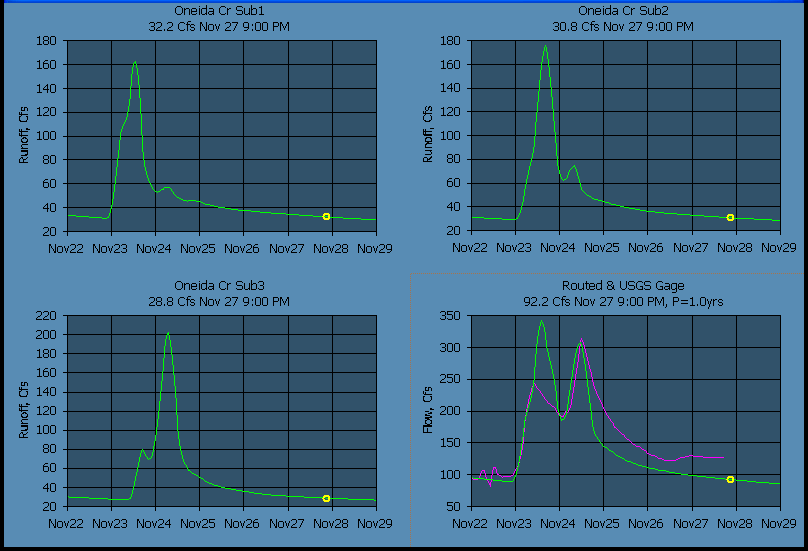
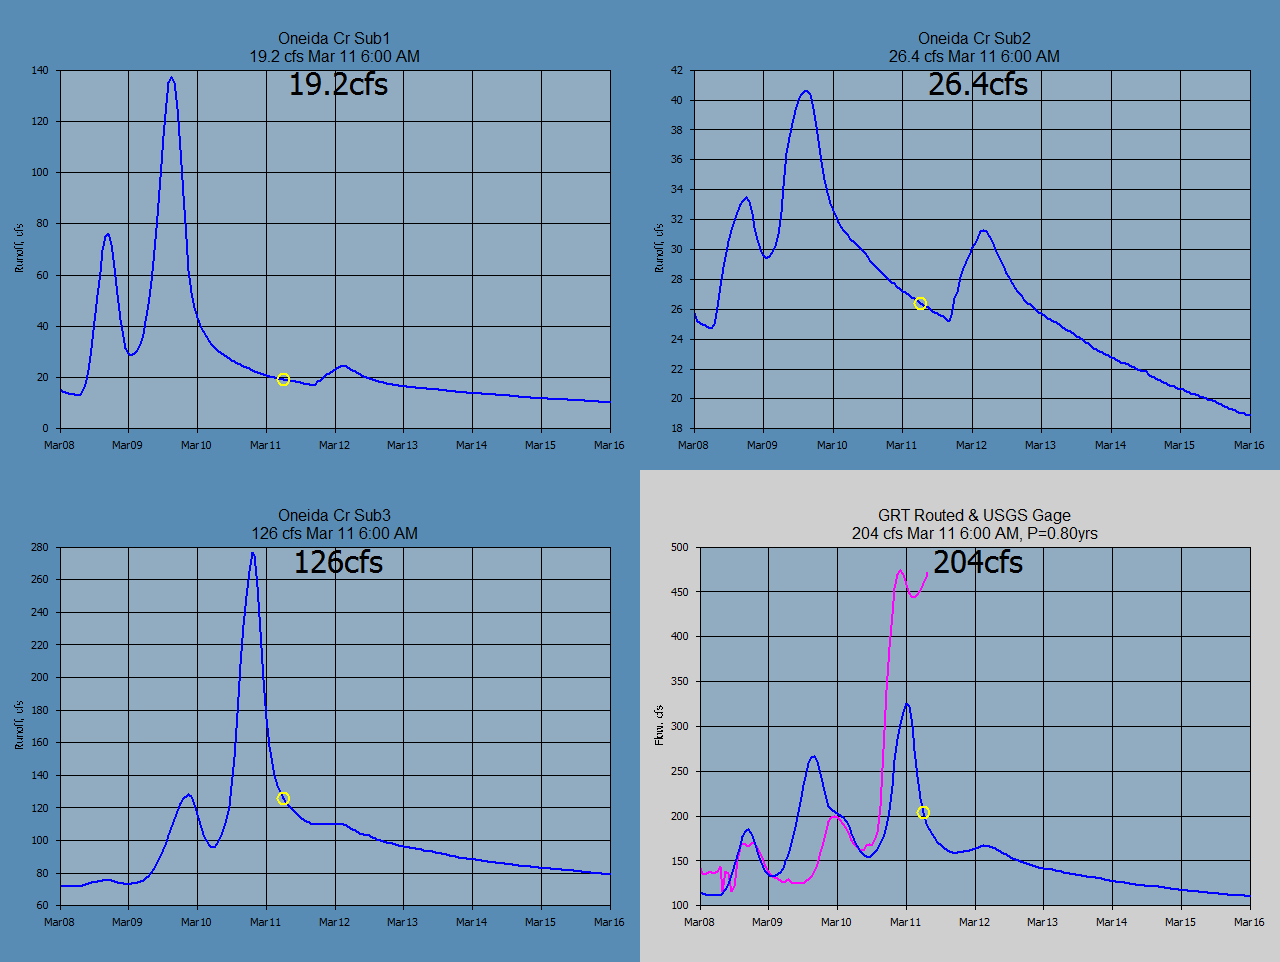
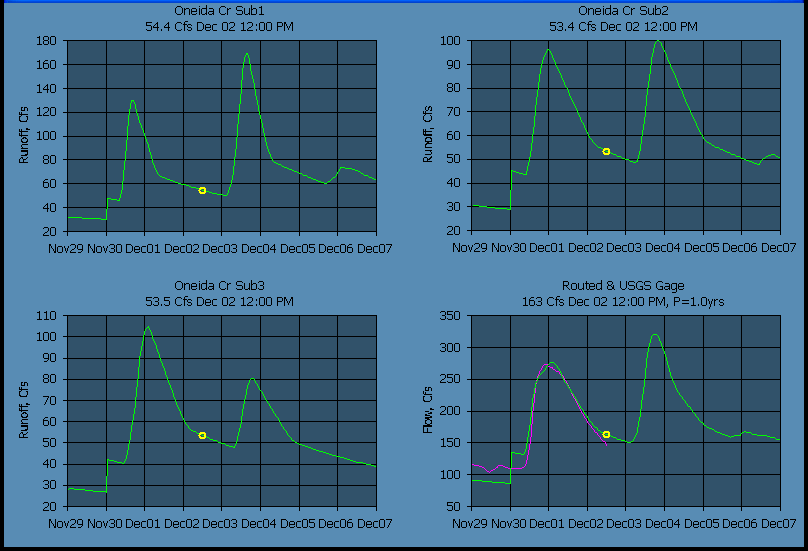
Nov 30, 2014: Here is the state of the 3 Sub's
hydrographs as the USGS gage is peaking in real-time with
the current snowmelt factors above. The yellow circle was the current
real-time. Sub 1 has peaked, Sub 2 is peaking and Sub 3 is just starting
to melt. The USGS gage is near it's peak... I hope. I looked at last
years USGS flows to see if this double peaking was normal but most winter flows
are ice affected and not published. If I paid for this gage I would tell
the USGS to give it a better shot than sorry no can do, it's so cold. I
knew they didn't pay their winter field man enough. So this is probably
about the last shot at this stuff for this year. I guess we
will have to supply the winter flows for them.
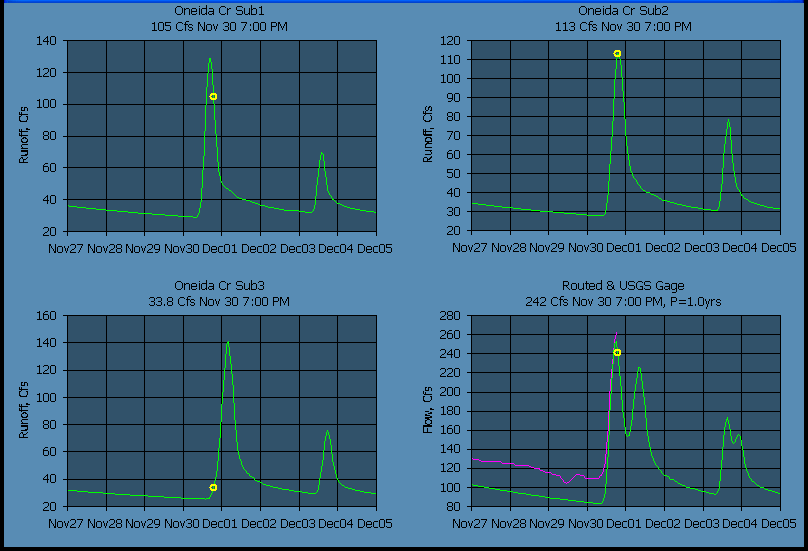
Nov 30 update: After some trials at everythig, I decided to put
the blame on soil losses, although raising the constant radar rainfall
adjustment from 1.0 to 1.35 woud also work. This is my first real winter
snowmelt with a real working USGS gage so all of this is conjecture and
undoubtedly will be rethought. I had to go to tri-liear reservoirs to
shape the hydrograph to account for very bad snowmelt??? But it
worked for this event. What the next event says may undo all my thinking.
The soil loss factors for the subs went from 0.85 to 0.485 but may had to
account for a USGS gage shifting and I kind of doubt the high recession flows
will hold. 0.5 would have worked as well but I'm using the 85 to remember
where summer losses are. As you can see, tell me what you want and ya got
it... for at least one event.
Sub1: +1, 1, 0.75, 1, 1.01, 1, 1, 34
Sub2: -1, 1, 0.75, 1, 0.99, 1, 1, 34
Sub3: -2, 1, 0.75, 1, 0.98, 1, 1, 34
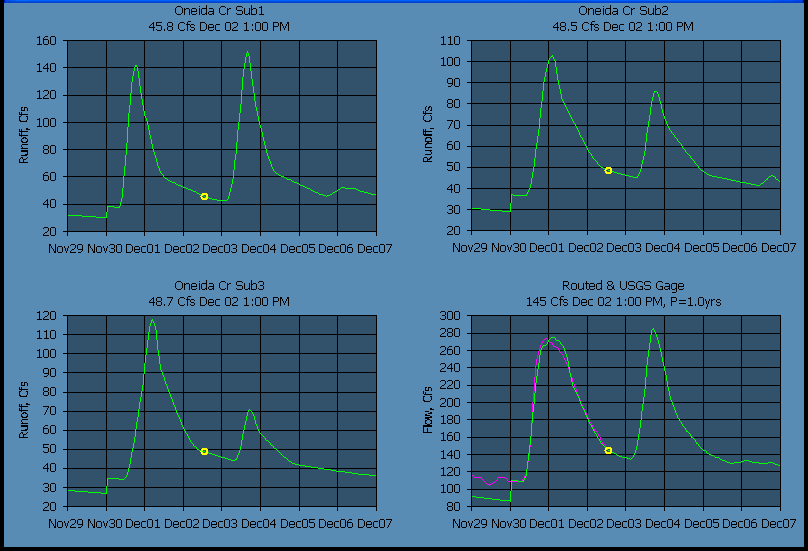
Nov 30 update2: As I figured, the USGS continues the steep
runoff recession while my subs have already gone to the high flatter soil
returns caused by increaseing the soil returns. It's a shame it's starting
to rain/snow again right at the phase 34F point so the recession may be short
lived. But I think I've seen enough to go back to the 0.85 soil loss
factor and raise the Gage/Radar constant ratio to 1.35. Ten wundergages
and not one heated, grrr!!! Although for the Nov 26-Dec 1 snowpack
build/melt the Bartlett Gage had sporatic morning gage melt amounts totaling
0.46" to the radar's 0.32 so G/R=1.44. That's just what the doctor ordered!
I also rasided the Base Flow for each sub from 8 cfs to 15 cfs which I hope is
due to a shifing USGS gage. And now note below how the ending base flows
are about 130 cfs instead of 160 cfs.
Winter runoff lag setups read:
************; ************; ************; *****Runoff******
COMPUTE-unit; -30301; Runoff; Oneida Cr Sub1, NY; 15; 4.0,
86, 0.1, 2, 41.8, 0.5, .17, 0.5, 4, 0.35, 12, 98, 82, 0.85, 0.0, 0.05, 0.3, 0.8,
0.03, 0.8, 0, Lag0; P1; 0.244; Triangle Unit Graph
COMPUTE-unit; -30302; Runoff; Oneida Cr Sub2, NY; 15; 7.5,
86, 0.1, 2, 38.4, 0.5, .17, 0.5, 4, 0.35, 12, 98, 82, 0.85, 0.0, 0.05, 0.3, 0.8,
0.03, 0.8, 0, Lag0; P1; 0.122; Triangle Unit Graph
COMPUTE-unit; -30303; Runoff; Oneida Cr Sub3, NY; 15; 6.5,
86, 0.1, 2, 34.7, 0.5, .17, 0.5, 4, 0.35, 12, 98, 82, 0.85, 0.0, 0.05, 0.3, 0.8,
0.03, 0.8, 0, Lag0; P1; 0.143; Triangle Unit Graph
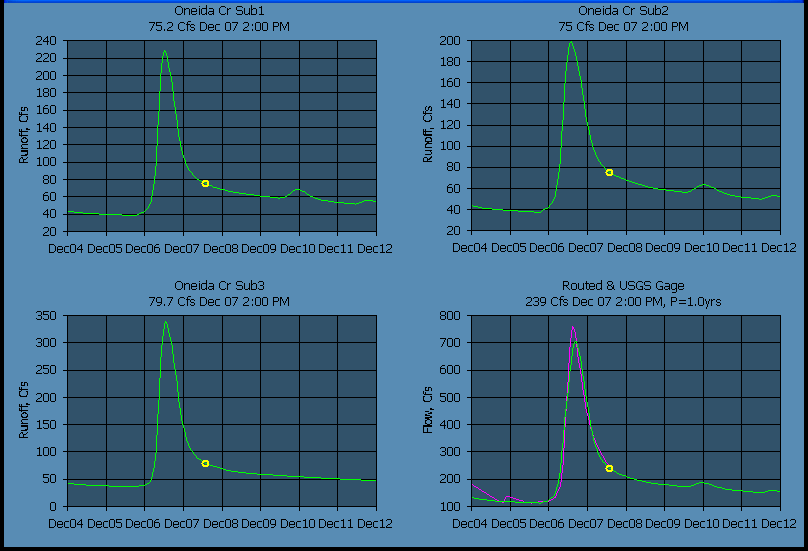
Dec 6 update: There was no melt at all to compare with
the 700 cfs USGS peak. So I added a +3 F shift to the base temperature
reported by the Wundergage. Hopefully if any adjustment to the melt is
needed it will be just this one factor to reset.
************; ************; ************; *****Wundergages*******
KNYDEANS2; 17200; Temperature; Oneida Cr, NY; 0;
3; P1+Shift
The snowmelt factors where set to these.
SNOWMELT-unit; 11301,-23301; Melt, SWC; Oneida Cr Sub1, NY; 0; +1, 1, 0.75, 1,
1.01, 1, 1, 34
SNOWMELT-unit; 11302,-23302; Melt, SWC; Oneida Cr Sub2, NY; 0; +1, 1, 0.75, 1, 1.01, 1, 1, 34
SNOWMELT-unit; 11303,-23303; Melt, SWC; Oneida Cr Sub3, NY; 0; 0, 1, 0.75, 1, 1, 1, 1, 34
The Triangle UGFs were replaced with the Little Tallapoosa DFG which is mid way
between the SCS and the Triangles:
************; ************; ************; *****Runoff******
COMPUTE-unit; -30301; Runoff; Oneida Cr Sub1, NY; 15; 6.0,
86, 0.1, 2, 41.8, 0.5, .17, 0.65, 4, 0.25, 12, 98, 82, 0.85, 0.0, 0.05, 0.3,
0.8, 0.03, 0.8, 0, Lag0; P1; 0; LittleTallapoosa.DGF
COMPUTE-unit; -30302; Runoff; Oneida Cr Sub2, NY; 15; 7.5,
86, 0.1, 2, 38.4, 0.5, .17, 0.65, 4, 0.25, 12, 98, 82, 0.85, 0.0, 0.05, 0.3,
0.8, 0.03, 0.8, 0, Lag0; P1; 0; LittleTallapoosa.DGF
COMPUTE-unit; -30303; Runoff; Oneida Cr Sub3, NY; 15; 6.5,
86, 0.1, 2, 34.7, 0.5, .17, 0.5, 4, 0.5, 12, 98, 82, 0.85, 0.0, 0.05, 0.3, 0.8,
0.03, 0.8, 0, Lag0; P1; 0; LittleTallapoosa.DGF
Dec 9 update: The Forecast of basin Temperature has been
shifted +2F higher (P1+2). Three Wundergages are being averaged for Temp,
Hudiity, and Windspeed with the Basin Avg Temp shifted +2F higher. The
Wundergage at the lowest elevation was down so that the +2F temperature shift
may be a bit low. The Rome airport heated rain gage seemed to be frozen for a while so the Syracuse
airport gage was used with a 2-hour G/R ratio because of its distance from the
basin. Base flow riparian factors reduced from 0.3 to 0.0. This will
remove the rising winter base flows and increase the summer flows that is useful
for arid streams.
Dec 15 update: The USGS made a flow measurement and
raised the flow so I put back in the base flow riparian factor at 0.3. The
model melt was way too soon with +2F temperature adjustment. I will
lower to +1F and will never change it again!!! I think the flaw in my long
wave radiation is that 95% Humidity doesn't gaurentee a cloudy sky with more
heat in New York so my long wave is the weak link in my flux capacitor here.
It only works in the movies. Update Dec 16: I lied
and have lowered the temp adjust to -1F for history and redid
starting Dec 12 to match the current snow on the web cams (ok, it so happens to
match the USGS flows but that would be cheating!). Update Dec 17:
I need to go to a -2.5F adjust ...grrrrr!!!!
Back to the Drawing Board with Long Wave
I looked at my Long Wave record from Switzerland I was using for correlating
with and found a much different variation in Fall to Winter than from Winter to
Spring so I removed the questionable record and got much better correlations.
So....
Upate Dec 12 to...: A +0.5F temperature adjustment
was used beginning Dec 12 with the new Long Wave computation and will continue
till....??? hell
freezes over. Ha...
Sub1, NY; 0; +1, 1, 0.75, 1, 1.01, 1, 1, 34
Sub2, NY; 0; +0.5, 1, 0.75, 1, 1.005, 1, 1, 34
Sub3, NY; 0; 0, 1, 0.75, 1, 1, 1, 1, 34
Dec 17 peak update: Steady as she goes with the Dec 12
settings. Let her ride for now.
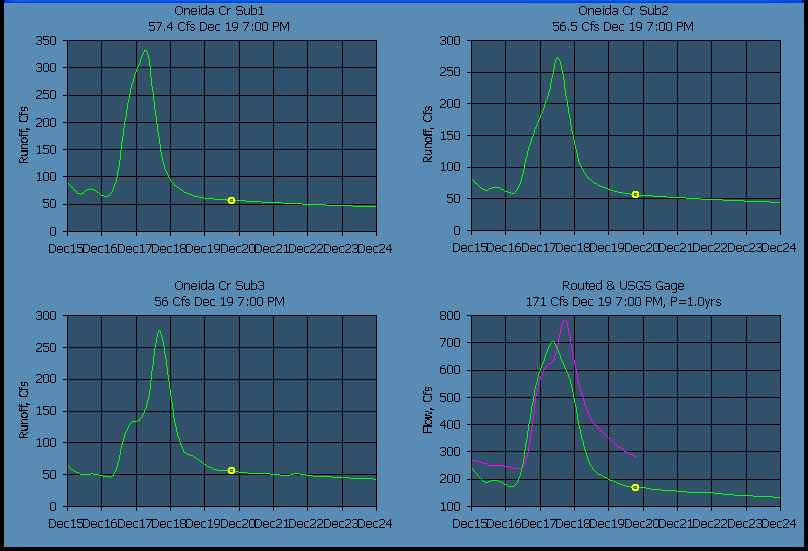
Dec 24 Peak--As the USGS gage was zooming off the graph I
figured all the snow on the web cams was indeed snow. I went back to Dec 9 and
used a default radar adjust factor of 1.5 with a 2 hour adjust of 0.04 trigger.
Viola! Case solved. I reduded the default adjust factor to 1.25 on Dec 22 and
remains at this. Radar is a very peculiar thing that takes some judgement,
and good judgement comes with experience, and experience, well as Cousin Woodman
says, that comes from bad judgement. My SCS loss method is pretty much a
done deal from the summer, so when the cumulative flow volumes aint adding up,
we probably have the wrong radar rainfall. And in general, I don't like
how far the heated airports are and am even a little dubious of the Syracuse
rain gage but what can you expect from flyboys. ;-) I have seen 3 USGS
rain gages and a Wundergage all with in 5 miles of each other and in this
perfect world they all march in step relative to the radar to where an
adjustment from anyone of them would suffice. So when looking at rain
gages to adjust the radar, the good ones will be the same relative to the radar
which leaves Syracuse the odd man out. But low strataforms are a horse of
another color based on radar site distance. So adjusting 50 mile subs with
70 mile gages in winter is just asking for trouble and probably summer too.
One can adjust 100 mile subs but only with 100 mile gages and not 50, nor 70 no
how.
Mar 11 Snowmelt Peak--As fate would have it, all 3 gages
averaged to be used in the snowmelt computations were down on the peaking Mar
11...P1 ABC Dairy, P3 White Eagle, and P5 Deansboro. So when this happens,
GetRealtime uses the previous days hourly values for the missing for better or
worse, which was a very warm day. I need to track down why the Forecast
for the snowmelt values where deleted when there is missing gage data which
would be a better estimate of conditions. The GH record did not collaborate the
high peak runoff for Mar 11. I have replaced ABC Dairy, White Eagle and
Deansboro with Ted's Farm, Smithfield, and Fountain Street temperatures which
means all my fine tuning of temperature is out the window.
Apr 13, 2015 End of Snowmelt--So what can go wrong does with
the temperature gages. The USGS began providing streamflow again on March
26 and my melts were way low due to the early model melt. Seeing the need
for a way to easily bring soil moisture and ground water return back on
track, I updated GetRealtime to do this for all subs at one time.
The user provides an amount of +-rain to be added to the soil and groundwater
based on the setup fractions to mimic infltration or reverse infiltration.
On Apr 13 I added 1.7" of infiltration that saturated the soils, raised the
groundwater, and brought the hydrograph back in line with the USGS flows base
and subsequent runoff event. Pretty slick deal. I probably should
have gone back to the summer unit graph so that's next. And this might be
a quick start way to calibrate a new model.
Aug 28, 2015--An 'IF' was added to the GetRealtime_setup.txt to
check for very dry base flow and if so then run other runoff setup lines for
broader unit graph (Little Tallapoosa) and raise SCS Inital Abstraction from the
standard 0.2 to 0.5. Seems to work well.
Summer Unit Graph--SUMMER SETTINGS with GWLossFact=0.2:
COMPUTE-unit; -30301; Runoff; Oneida Cr Sub1, NY; 15; 6.0,
86, 0.1, 2, 41.8, 0.5, .17, 0.5, 4, 0.35, 12, 98, 82, 0.85,
0.2, 0.05, 0.3, 0.8, 0.03, 0.8, 0, 0.2, Lag0; P1;
0; VillageCreek.DGF
COMPUTE-unit; -30302; Runoff; Oneida Cr Sub2, NY; 15; 6.5,
86, 0.1, 2, 38.4, 0.5, .17, 0.5, 4, 0.35, 12, 98, 82, 0.85,
0.2, 0.05, 0.3, 0.8, 0.03, 0.8, 0, 0.2, Lag0; P1;
0; VillageCreek.DGF
COMPUTE-unit; -30303; Runoff; Oneida Cr Sub3, NY; 15; 6.5,
86, 0.1, 2, 34.7, 0.5, .17, 0.5, 4, 0.35, 12, 98, 82, 0.85,
0.2, 0.05, 0.3, 0.8, 0.03, 0.8, 0, 0.2, Lag0; P1;
0; VillageCreek.DGF
Background hydrology and runoff setups:
How does this June 2013, Rainfall Frequency:
Produce this, Flood of History:
Because of this, Antecedent Flood Potential:
The annual peaks occur throught the year with the lagest peak on June 28 and 2nd
was Oct 9.
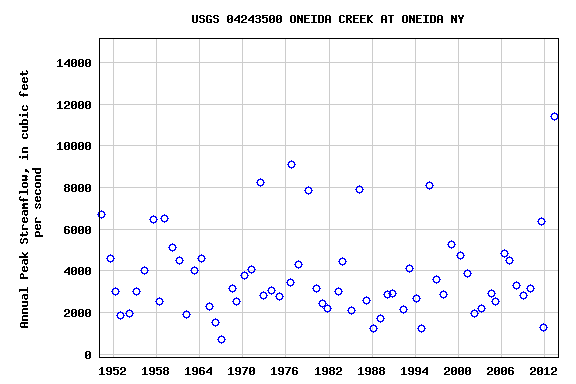
Oneida Creek at Oneida NY annul flow Pearson III log stats:
Mean=3.5198;
StdDev= 0.2312; Skew= -0.101 used in GetGraphs P=X yrs above:
GetRealtime's setup wizard for Sub 1 and is similar to the other 2 subs.
(Note the very high CN values):
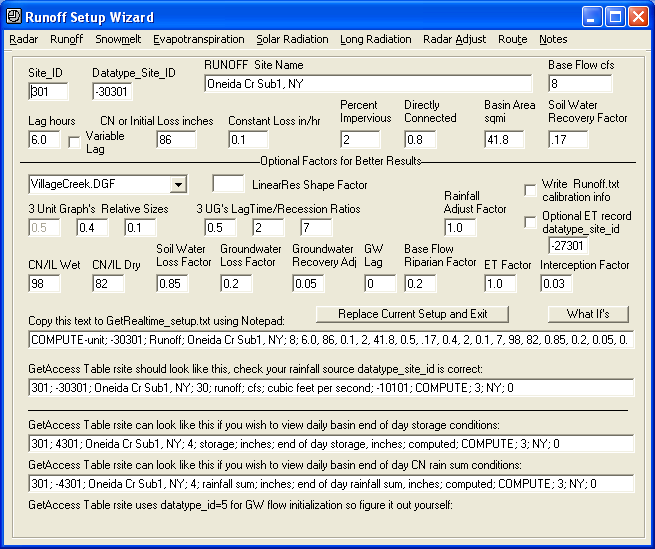
GetRealtime_setup.txt file with important summer runoff in red:
(note: I'm not sure how legal this is but for my Pacific time zone I used
my time meridian of -120 instead of -75 to shift the sun around for solar and ET
comps to match -3 hr shifted gages. Hopefully you wont have to.)
************; ************; ************; *****Forecasts*****
FORECAST-NWS; -11301; Forcast Rain; Oneida Cr Sub1, NY; -3; 42.9962,-75.5885,2
FORECAST-NWS; -11302; Forcast Rain; Oneida Cr Sub2, NY; -3; 42.9962,-75.5885,2
FORECAST-NWS; -11303; Forcast Rain; Oneida Cr Sub3, NY; -3;
42.9962,-75.5885,2
FORECAST-NWS; 17200; Temperature; Oneida Cr, NY; -3; 42.9962,-75.5885
FORECAST-NWS; 18200; Humidity; Oneida Cr, NY; -3; 42.9962,-75.5885
FORECAST-NWS; 28200; Windspeed; Oneida Cr, NY; -3; 42.9962,-75.5885; P1*0.75
************; ************; ************; *****BGM RADAR*******
NEXRAD-BGM; -10301; Radar Rain; Oneida Cr Sub1, NY ; 0
NEXRAD-BGM; -10302; Radar Rain; Oneida Cr Sub2, NY ; 0
NEXRAD-BGM; -10303; Radar Rain; Oneida Cr Sub3, NY ; 0
NEXRAD-BGM; -10201; Rainfall; ABC Dairy KNYCANAS5, NY ; 0
NEXRAD-BGM; -10202; Rainfall; Caz Lake KNYCAZEN4, NY ; 0
NEXRAD-BGM; -10203; Rainfall; White Eagle KNYHAMIL3, NY ; 0
NEXRAD-BGM; -10204; Rainfall; Fountain Street KNYCLINT15, NY ; 0
NEXRAD-BGM; -10205; Rainfall; Deansboro KNYDEANS2, NY ; 0
NEXRAD-BGM; -10206; Rainfall; Lowell KNYROME4, NY ; 0
NEXRAD-BGM; -10207; Rainfall; Bartlett KNYWESTM2, NY ; 0
NEXRAD-BGM; -10208; Rainfall; Curtin Dairy KNYCASSV2, NY ; 0
NEXRAD-BGM; -10209; Rainfall; WB Yacht Club KNYCAZEN5, NY ; 0
NEXRAD-BGM; -10210; Rainfall; Teds Farm KNYCAZEN7, NY ; 0
************; ************; ************; *****Wundergages*******
KNYCANAS5; 17200; Temperature; Oneida Cr, NY
KNYCANAS5; 18200; Humidity; Oneida Cr, NY
KNYCANAS5; 28200; Wind Speed; Oneida Cr, NY
KNYCANAS5; 10201; Rainfall; ABC Dairy, NY
KNYCAZEN4; 10202; Rainfall; Caz Lake, NY
KNYHAMIL3; 10203; Rainfall; White Eagle, NY
KNYCLINT15; 10204; Rainfall; Fountain Street, NY
KNYDEANS2; 10205; Rainfall; Deansboro, NY
KNYROME4; 10206; Rainfall; Lowell, NY
KNYWESTM2; 10207; Rainfall; Bartlett, NY
KNYCASSV2; 10208; Rainfall; Curtin Dairy, NY
KNYCAZEN5; 10209; Rainfall; WB Yacht Club, NY
KNYCAZEN7; 10210; Rainfall; Teds Farm, NY
KNYCAZEN7; 29210; Solar Radiation; Teds Farm, NY; 0; 0; 2.065*P1
************; ************; ************; *****RATIOS*******
COMPUTE-hour; 10251; Rainfall; Avg Rain Gages Oneida Cr; 0; 0;
(P1+P2+P3+P4+P5+P6+P7+P8+P9)/N
COMPUTE-hour; -10251; Rainfall; Avg Rain Radars Oneida Cr; 0; 0;
(P1+P2+P3+P4+P5+P6+P7+P8+P9)/N
COMPUTE-hour; -31251; Ratio; Avg G/R Ratio Oneida Cr; 0; 0.02, 1.2, 5; P1/P2
************; ************; ************; *****Adjusted Rainfall*******
COMPUTE-unit; -11301; Adj Rain; Oneida Cr Sub1, NY; 0; -1, 1.2, 0.4, 0.5; P1*P2
COMPUTE-unit; -11302; Adj Rain; Oneida Cr Sub2, NY; 0; -1, 1.2, 0.4, 0.5; P1*P2
COMPUTE-unit; -11303; Adj Rain; Oneida Cr Sub3, NY; 0; -1, 1.2, 0.4, 0.5; P1*P2
COMPUTE-unit; -11201; Adj Rain; Wundergage #1 Adjust; 0; -1, 1.2, 0.4, 0.5;
P1*P2
************; ************; ************; *****SNOW CALCS******
COMPUTE; 29200; Solar Radiation; Oneida Cr, NY; 0; 42.9962,-75.5885,-120, 630
COMPUTE; -29200; Long Radiation; Oneida Cr, NY; 0
COMPUTE; -27200; ET Grass; Oneida Cr, NY; 0; 42.9962,-75.5885,-120, 630, 0.75
SNOWMELT-unit; 11301,-23301; Melt, SWC; Oneida Cr Sub1, NY; 0; 0, 1, 0.75, 1,
1, 1, 1, 34
SNOWMELT-unit; 11302,-23302; Melt, SWC; Oneida Cr Sub2, NY; 0; 0, 1, 0.75, 1,
1, 1, 1, 34
SNOWMELT-unit; 11303,-23303; Melt, SWC; Oneida Cr Sub3, NY; 0; 0, 1, 0.75, 1,
1, 1, 1, 34 ************; ************; ************; *****Runoff******
COMPUTE-unit; -30301; Runoff; Oneida Cr Sub1, NY; 8;
6.0, 86, 0.1, 2, 41.8, 0.5,
.17, 0.4, 2, 0.1, 7, 98, 82, 0.85, 0.2, 0.05, 0.2, 0.8, 0.03, 0.8, 0, Lag0; P1;
0; VillageCreek.DGF
COMPUTE-unit; -30302; Runoff; Oneida Cr Sub2, NY; 8;
6.5, 86, 0.1, 2, 38.4, 0.5,
.17, 0.4, 2, 0.1, 7, 98, 82, 0.85, 0.2, 0.05, 0.2, 0.8, 0.03, 0.8, 0, Lag0; P1;
0; VillageCreek.DGF
COMPUTE-unit; -30303; Runoff; Oneida Cr Sub3, NY; 8;
6.5, 86, 0.1, 2, 34.7, 0.5,
.17, 0.4, 2, 0.1, 7, 98, 82, 0.85, 0.2, 0.05, 0.2, 0.8, 0.03, 0.8, 0, Lag0; P1;
0; VillageCreek.DGF
************; ************; ************; *****Routings*****
ROUTE-unit; -1300; Flow; Route Sub3 And Combine All
************; ************; ************; *****USGS Gages*****
04243500; 1300; Flow; ONEIDA CR AT ONEIDA, NY
04243500; 2300; Gage Height; ONEIDA CR AT ONEIDA, NY
COMPUTE-Unit; -2300; Gage Height; Oneida Cr at Oneida; 0; -10;
0.05066*(P1+260+Shift)^0.6591933
************; ************; ************; **Daily Curve Numbers
for Display Only**
COMPUTE-Day; -6301; SCS CN; Oneida Cr Sub1, NY; 0; 0; 1000/(P1+10)
COMPUTE-Day; -6302; SCS CN; Oneida Cr Sub2, NY; 0; 0; 1000/(P1+10)
COMPUTE-Day; -6303; SCS CN; Oneida Cr Sub3, NY; 0; 0; 1000/(P1+10)
************; ************; ************; *****Upload Graphs*****
SHELL-C:\GetProjects\GetOneidaCr\GetNexrad\GetNexrad.exe -2 mypassword; 0;
Picture; Oneida Cr Nexrad Picture; 0
SHELL-C:\GetProjects\GetOneidaCr\GetGraphs\GetGraphs.exe 1 mypassword; 0;
Graphs; Getgraphs to Web; 0
END
GetAccess Table Rsite reads:
ROUTINGS:
Sub 3 was routed to Sub 1 & Sub 2 outlets at the USGS gage and combined
and routing file reads:
Oneida Cr Routing Sub3 to USGS Gage and Cobine with Sub1 and Sub2
Get 4 -30303 Sub3
Route Muskingum-Cunge MuskingumCungeOneidaCr.Rat
Get 4 -30301 Sub1
Combine
Get 4 -30302 Sub2
Combine
End
My free ModPulXsec.exe
Muskingum-Cunge rating Sub 3 to Sub 1 as Elev, Flow, K, X, Cascades:
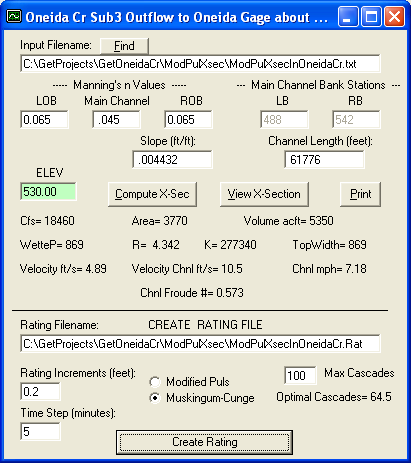 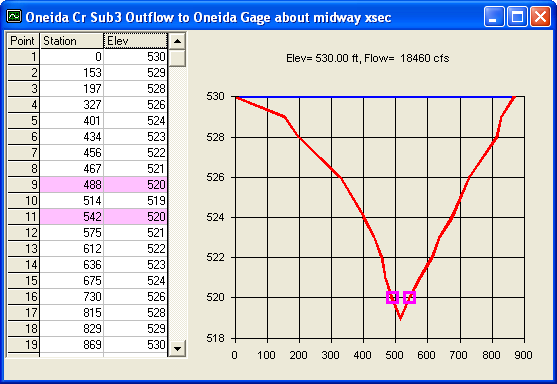
Elev, Flow, K, X, Cascades
|
Oneida Cr Sub3 Outflow to Oneida Gage about midway xsec MuskingumCunge
timestep=5 minutes |
|
56 lines below |
|
|
|
|
519 |
0 |
0 |
0 |
100 |
|
519.2 |
0.511 |
4.46 |
0.434 |
100 |
|
519.4 |
3.25 |
4.62 |
0.402 |
100 |
|
519.6 |
9.57 |
4.7 |
0.387 |
100 |
|
519.8 |
20.6 |
4.76 |
0.376 |
100 |
|
520 |
37.4 |
4.8 |
0.367 |
100 |
|
520.2 |
65.8 |
4.71 |
0.384 |
100 |
|
520.4 |
102 |
4.73 |
0.381 |
100 |
|
520.6 |
146 |
4.77 |
0.373 |
100 |
|
520.8 |
198 |
4.83 |
0.363 |
100 |
|
521 |
259 |
4.88 |
0.353 |
100 |
|
521.2 |
330 |
4.94 |
0.343 |
100 |
|
521.4 |
410 |
4.9 |
0.334 |
98 |
|
521.6 |
500 |
4.74 |
0.326 |
94 |
|
521.8 |
600 |
4.59 |
0.317 |
90 |
|
522 |
710 |
4.47 |
0.311 |
87 |
|
522.2 |
831 |
4.36 |
0.303 |
84 |
|
522.4 |
962 |
4.24 |
0.296 |
81 |
|
522.6 |
1110 |
4.11 |
0.291 |
78 |
|
522.8 |
1260 |
4.04 |
0.284 |
76 |
|
523 |
1430 |
3.95 |
0.28 |
74 |
|
523.2 |
1600 |
3.93 |
0.275 |
73 |
|
523.4 |
1780 |
3.89 |
0.27 |
72 |
|
523.6 |
1980 |
3.81 |
0.265 |
70 |
|
523.8 |
2190 |
3.78 |
0.261 |
69 |
|
524 |
2420 |
3.75 |
0.256 |
68 |
|
524.2 |
2670 |
3.71 |
0.251 |
67 |
|
524.4 |
2930 |
3.68 |
0.247 |
66 |
|
524.6 |
3220 |
3.59 |
0.243 |
64 |
|
524.8 |
3510 |
3.55 |
0.239 |
63 |
|
525 |
3830 |
3.51 |
0.236 |
62 |
|
525.2 |
4170 |
3.47 |
0.233 |
61 |
|
525.4 |
4520 |
3.43 |
0.229 |
60 |
|
525.6 |
4890 |
3.4 |
0.223 |
59 |
|
525.8 |
5280 |
3.28 |
0.223 |
57 |
|
526 |
5690 |
3.24 |
0.22 |
56 |
|
526.2 |
6080 |
3.26 |
0.215 |
56 |
|
526.4 |
6490 |
3.27 |
0.213 |
56 |
|
526.6 |
6920 |
3.3 |
0.208 |
56 |
|
526.8 |
7390 |
3.24 |
0.206 |
55 |
|
527 |
7880 |
3.26 |
0.203 |
55 |
|
527.2 |
8390 |
3.28 |
0.198 |
55 |
|
527.4 |
8940 |
3.23 |
0.197 |
54 |
|
527.6 |
9510 |
3.25 |
0.192 |
54 |
|
527.8 |
10110 |
3.19 |
0.192 |
53 |
|
528 |
10740 |
3.22 |
0.187 |
53 |
|
528.2 |
11480 |
3.09 |
0.187 |
51 |
|
528.4 |
12240 |
3.04 |
0.185 |
50 |
|
528.6 |
13040 |
2.98 |
0.184 |
49 |
|
528.8 |
13860 |
2.93 |
0.183 |
48 |
|
529 |
14710 |
2.87 |
0.183 |
47 |
|
529.2 |
15360 |
2.88 |
0.181 |
47 |
|
529.4 |
16060 |
2.95 |
0.177 |
48 |
|
529.6 |
16810 |
2.96 |
0.176 |
48 |
|
529.8 |
17610 |
2.97 |
0.174 |
48 |
|
530 |
18460 |
2.98 |
0.171 |
48 |
More runoff to come....
Important Note: Nothing on this page is intended as
interpretation of any legal authority such as water rights and supply. This page
is intended solely as a demonstration of techniques in flood potential
monitoring. The reader assumes all risk for any damages whatsoever in connection
with the access, use, quality, or performance of the supplied data just so you
know.
|