|
source: Wunderground/Intellicast
Current
composite radar
loop above. Below is zoomed ILN N0Q
hi-res radar station at Wilmington OH, Wundergages, and
adjusted N0Q at watersheds. Note that the raw N0Q radar here almost always
shows "ground clutter" because of being so close to the radar site. Ground
clutter (0.02" to 0.05" a day) is just another simple matter that rain gage
adjustment removes. No rain at the rain gages for the hour then no radar rain.
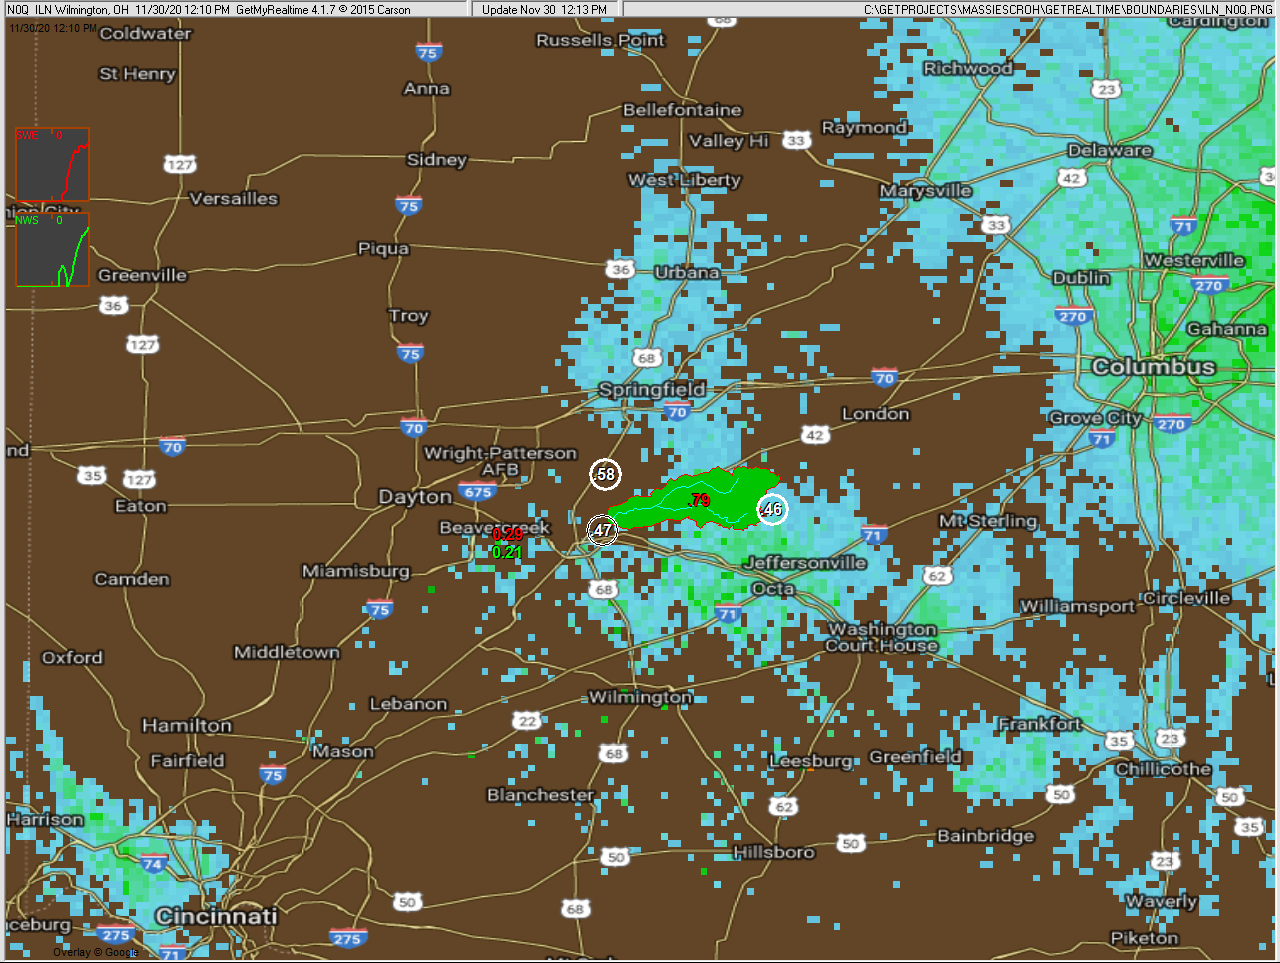
The 63.2 sqmi MassiesCreek basin was not subdivided and the USGS gage is
03241500 Massies Creek at Wilberforce, OH. The basin boundary was digitized using
Google Earth Pro Add Polygon method and saved as a KML file. My
GoogleKML2Text.exe program then converts the kml to text for my
LatLongPixelsFromFile.exe that creates the GetRealtime basin boundary pixels.
These programs are free on my Help web page from the top menu above.
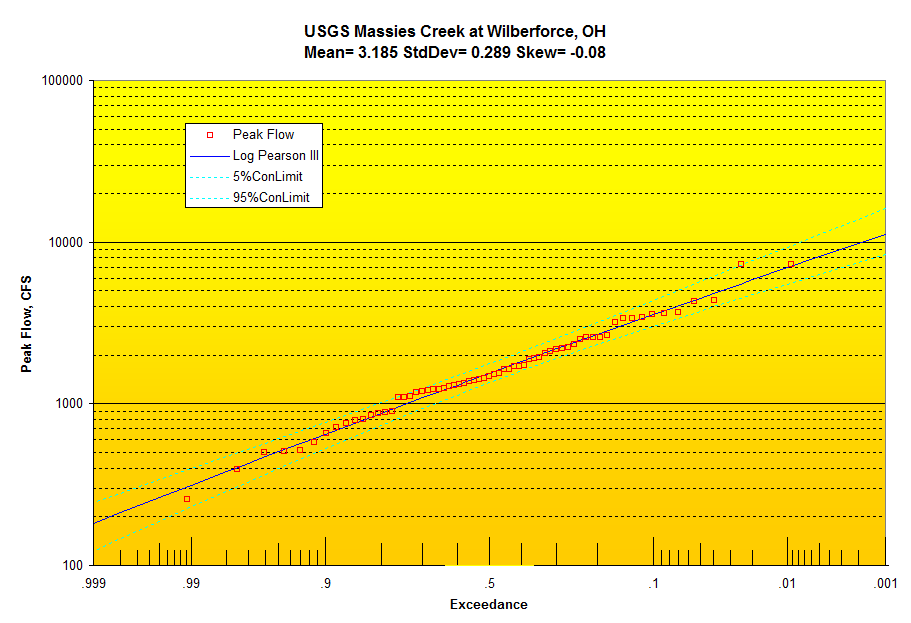
The NWS and USGS does not provide flood stage info so I used the 5 yr, 10 yr, 50
yr and 200 yr flood frequencies from my Log Pearson frequency curve and
interpolated in historical flood stages.
Annual peak FLOWS are also provided since 1953 and I created a Log Pearson III
annual propability distribution of the peaks for use for reporting peak flow
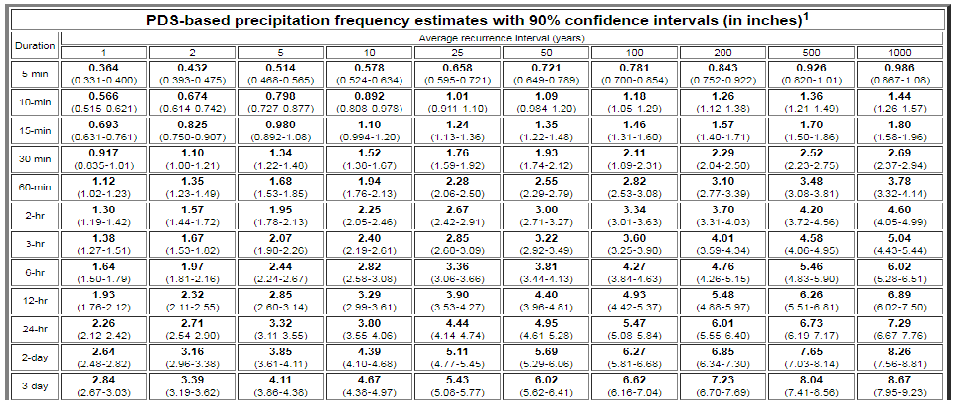
recurrence in GetGraphs. I also got the NOAA Atlas 14 partial probability rainfall
depths for reporting the 5-min to 3-day recurrence of rain depth.
Last model run info from database as text each run
(GetFromAccessNOW.exe):
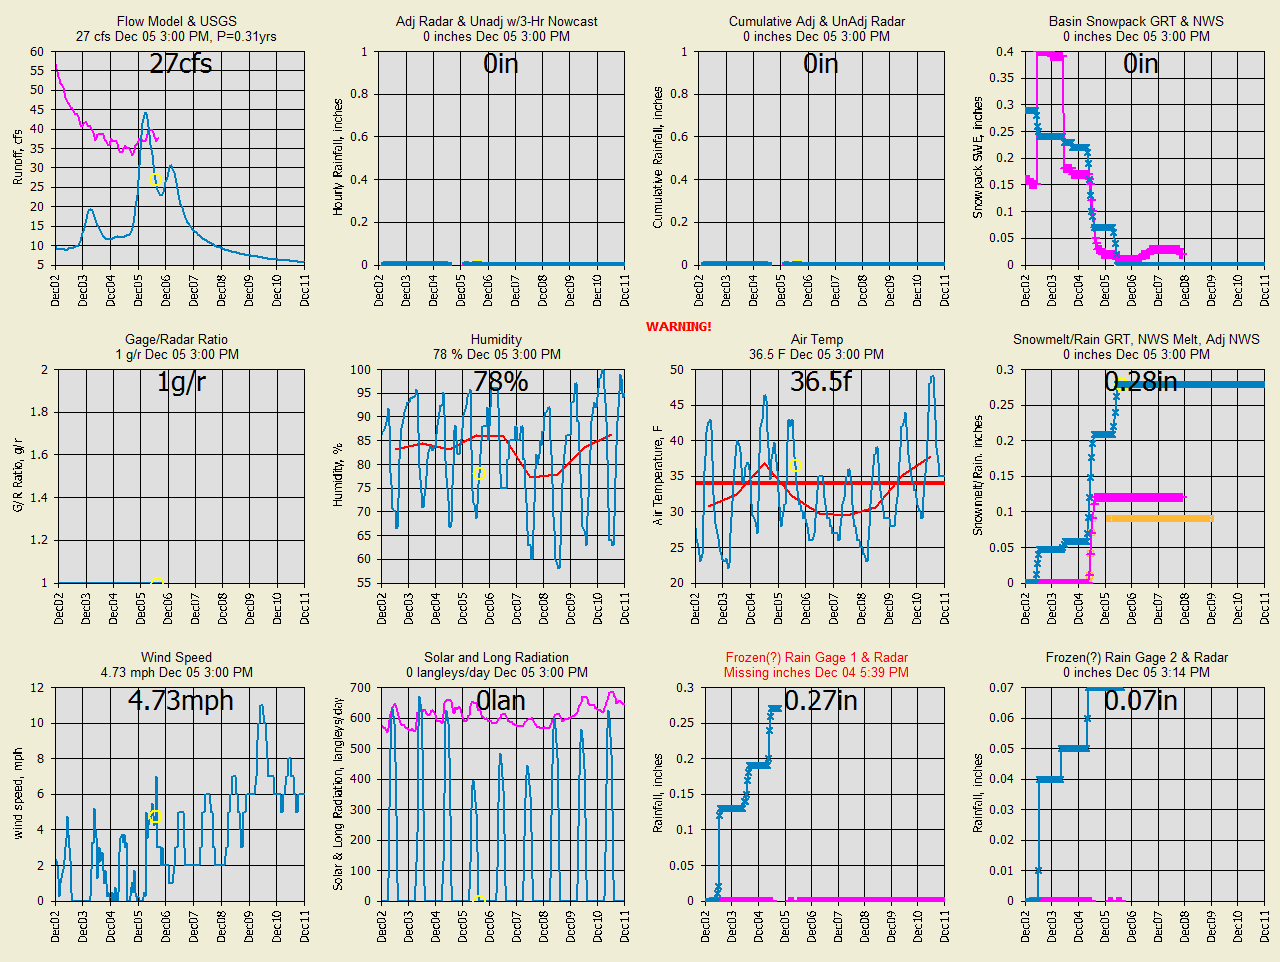
Current automated graphs and radar (updated when runoff)
NOTE ALL TIMES ARE FOR MY PACIFIC TIME ZONE
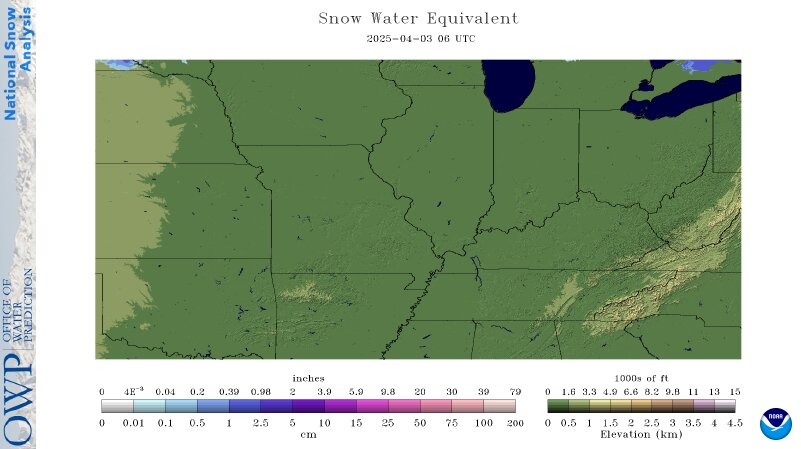
NWS Snowcast Model of SWE and Snow Melt:

NWS Model Point OH-GR-28 Compared to GRT Using NWS Rain+Snow Precip:
input:
Summary of Snowmelt (Series 1=Blue, Series 2=Pink, Series 3=Orange):
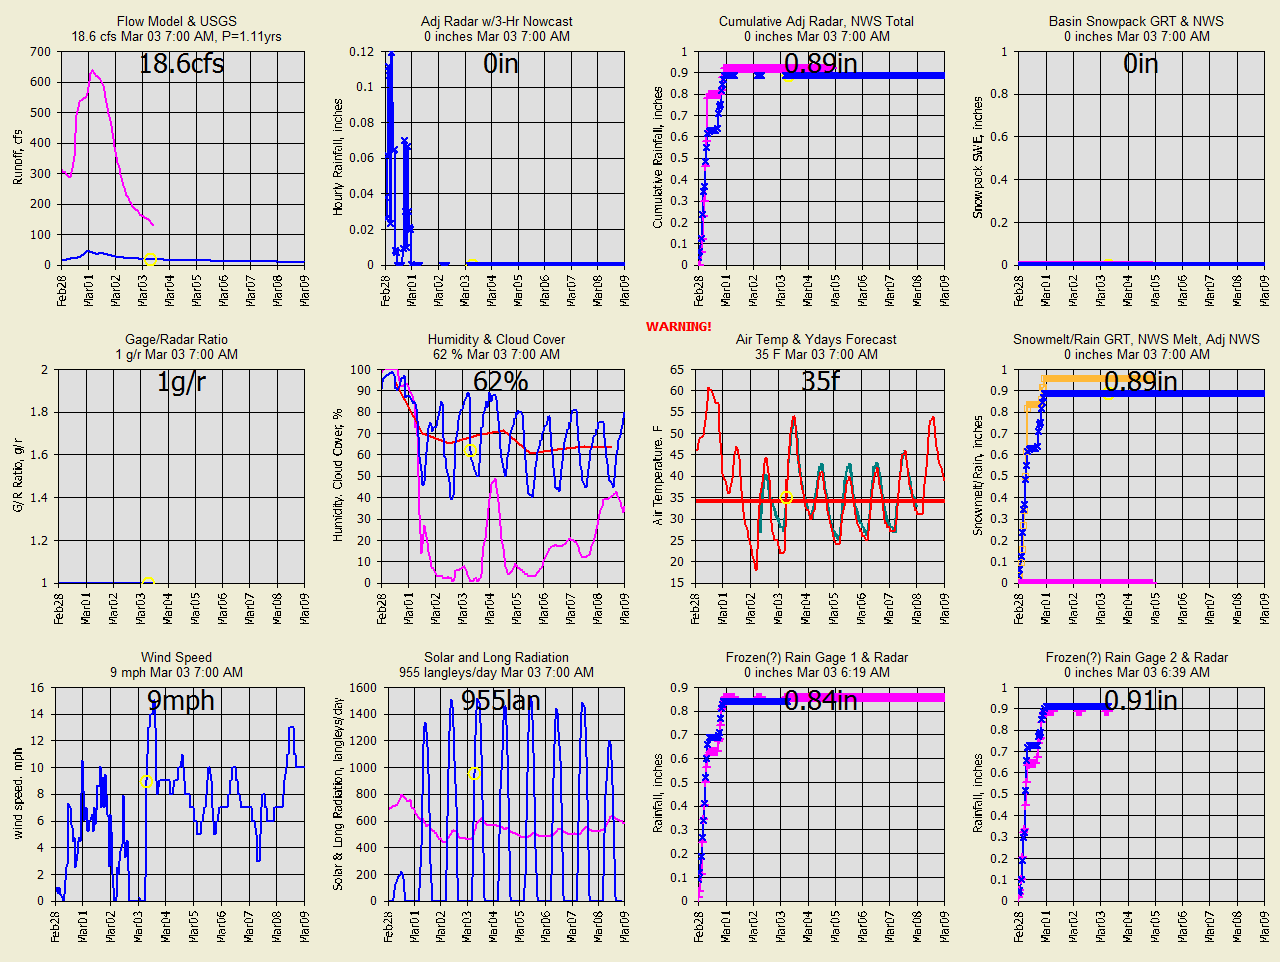
Radar ratio adjusted rainfall and
Wundergages (pink is second parameter referred to) :
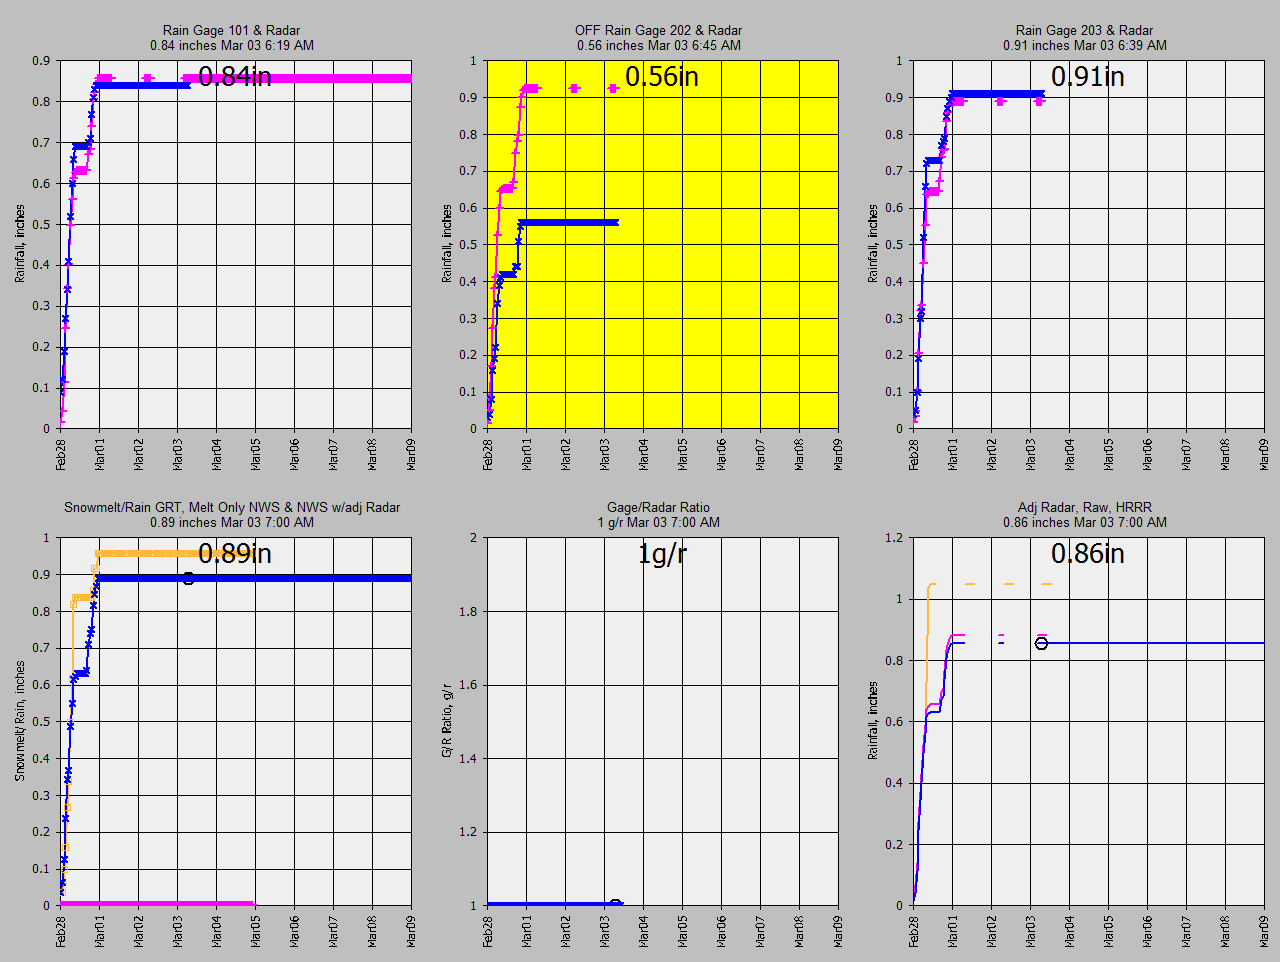
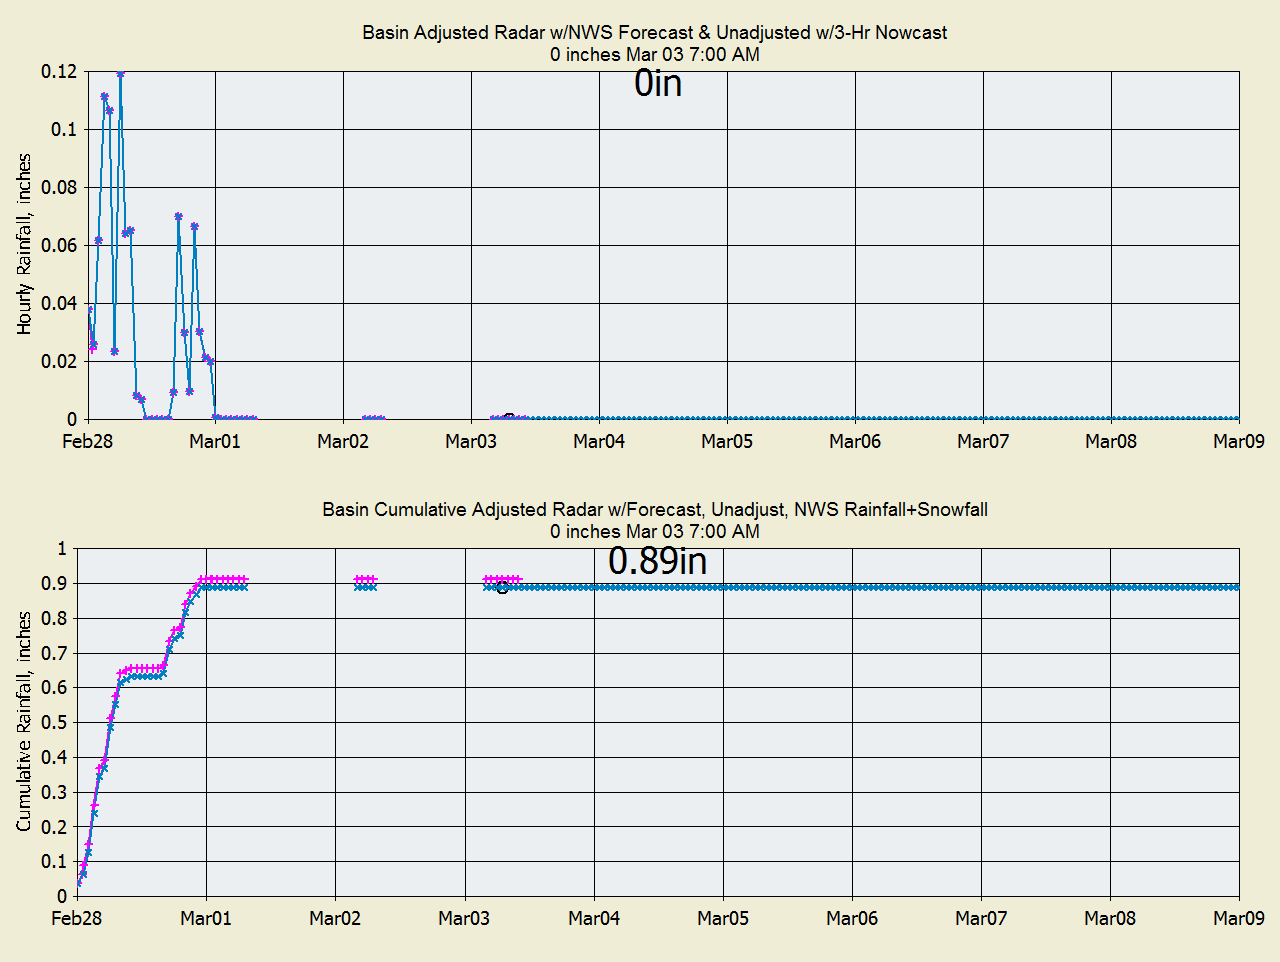
Hourly Adjusted Radar, 3hr Nowcast, 6hr HRRR forecast, NWS 7day Forecast and
Unadjusted Radar:
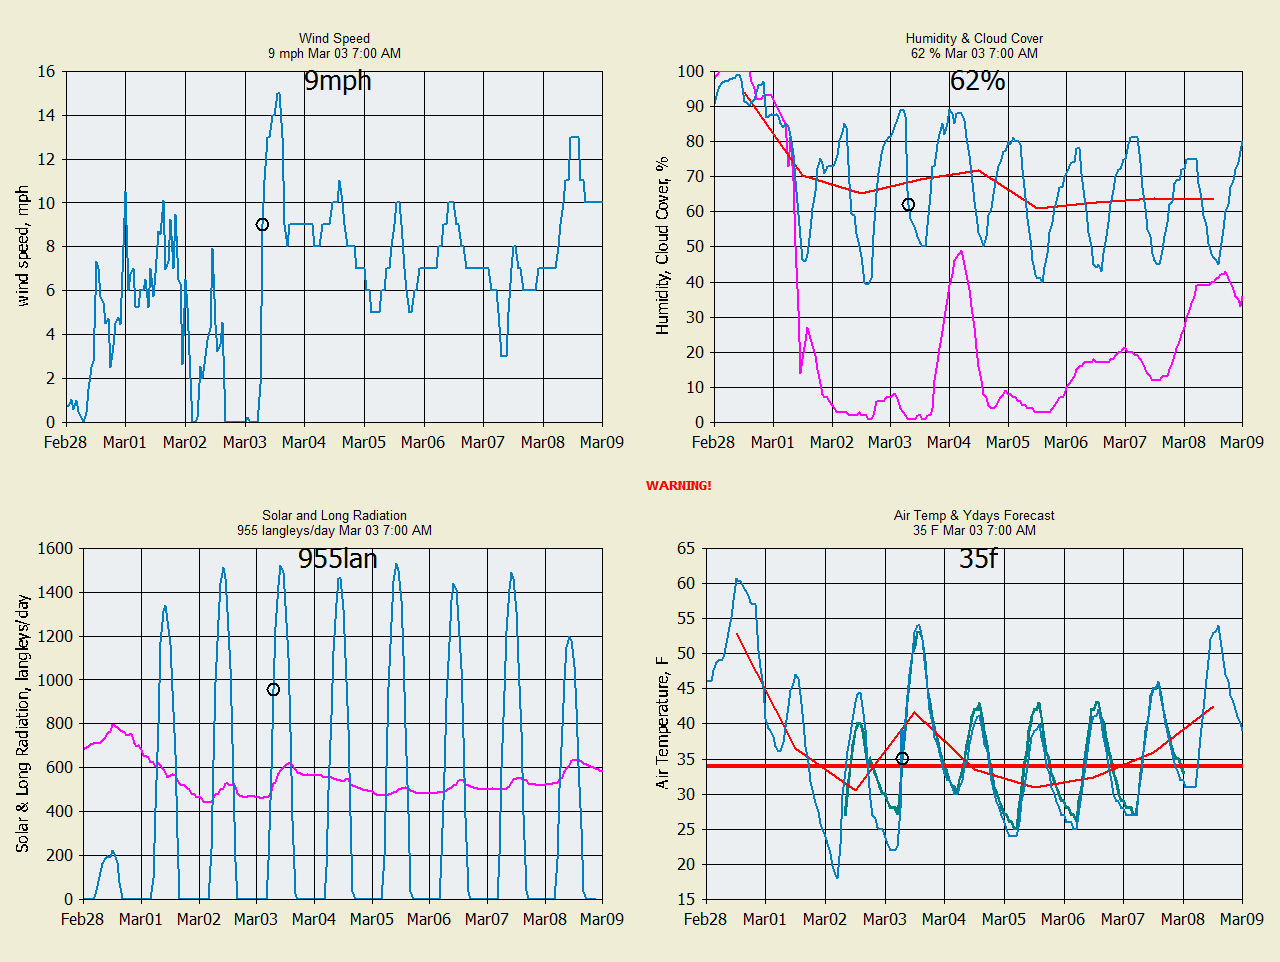
Meteorlogical data from Wundergages for snowmelt and evapotranspiration used by
GRT:
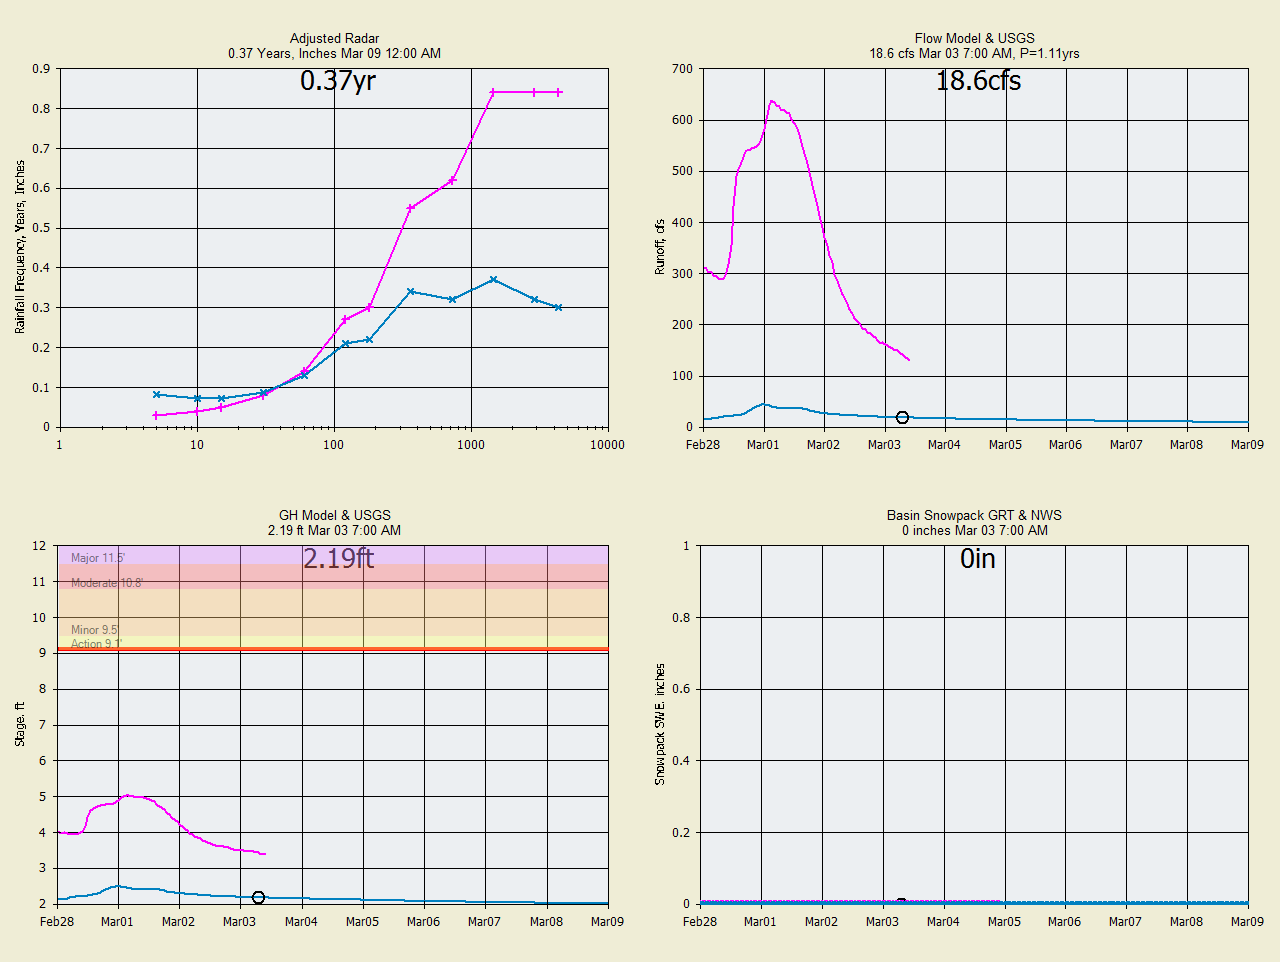
Rainfall Frequency,
Runoff & Frequency, Flood Stages and Snowpack:
Past Snowmelt Runoff Comparisons w/NWS Snowcast:
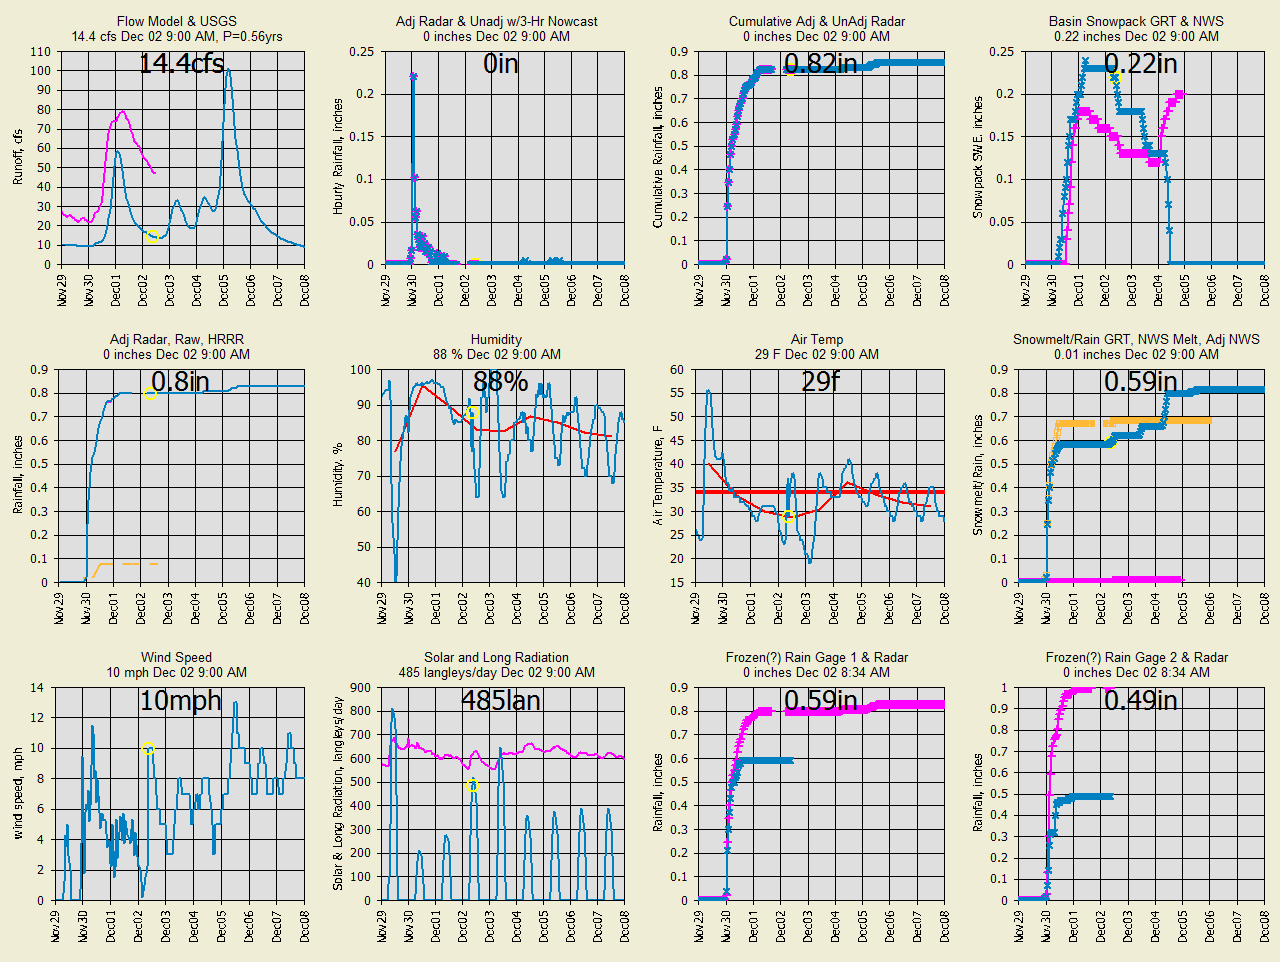
Dec 2, 2020 (Series 1=Blue, Series 2=Pink, Series 3=Orange,
Now=Yellow Circle):
Note Dec 4 snowpack forecasts, who is right will show up in USGS flow...
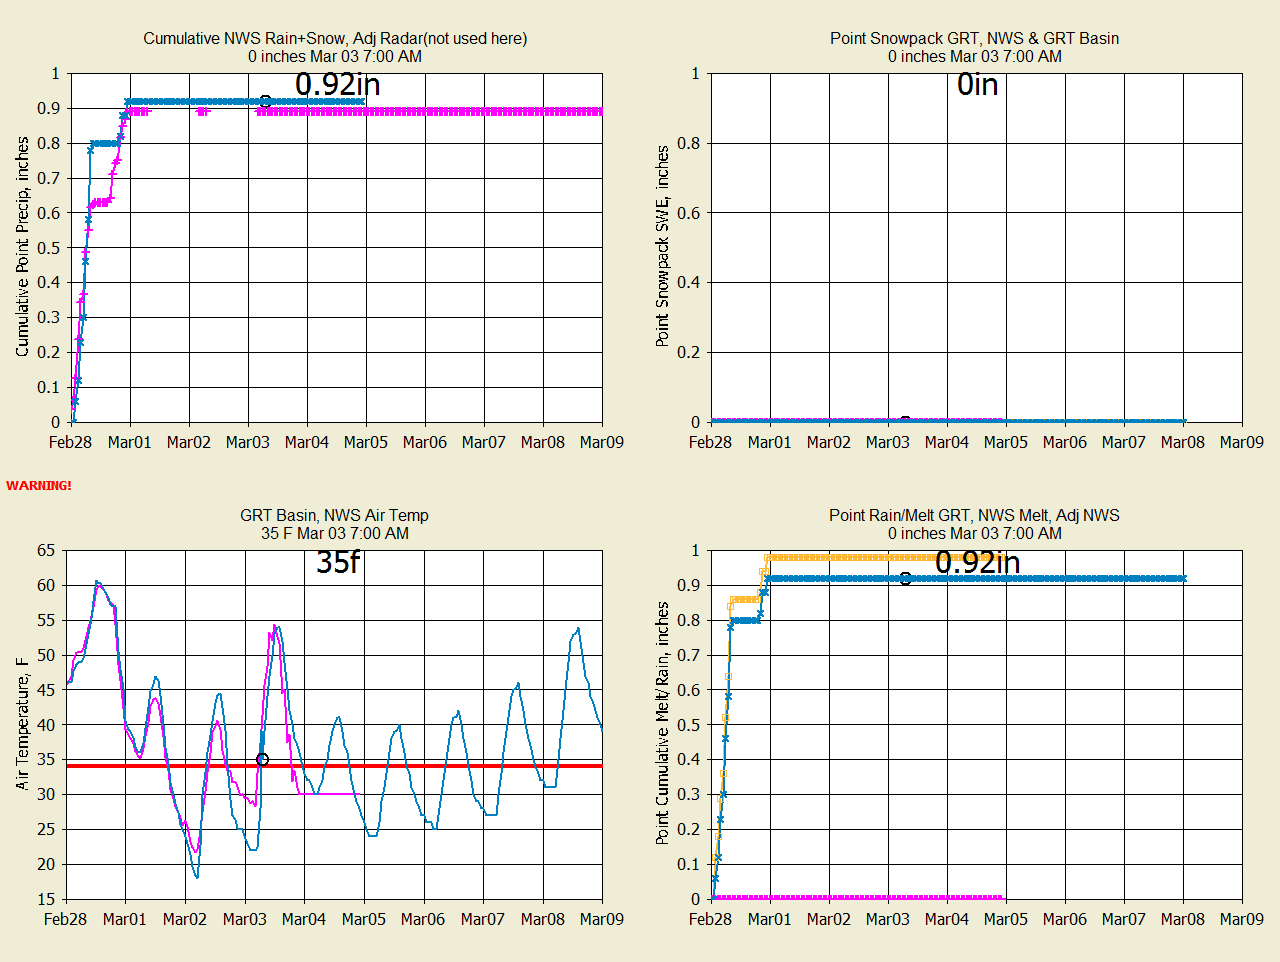
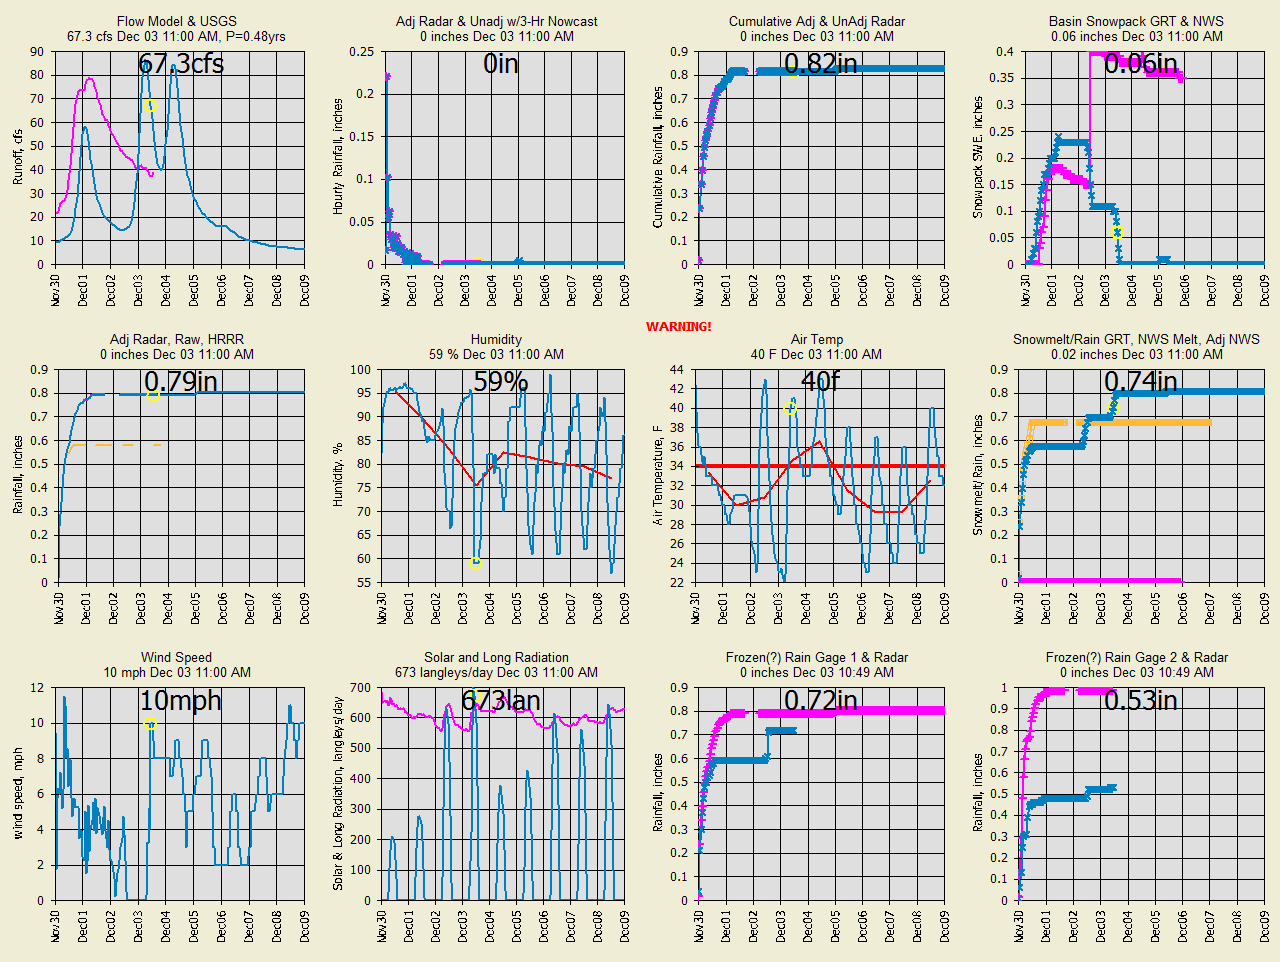
Dec 3, 2020 (Series 1=Blue, Series 2=Pink, Series 3=Orange,
Now=Yellow Circle):
Note Dec
2 NWS snowpack jumped to 0.4 with no precip and no gage observation noted.
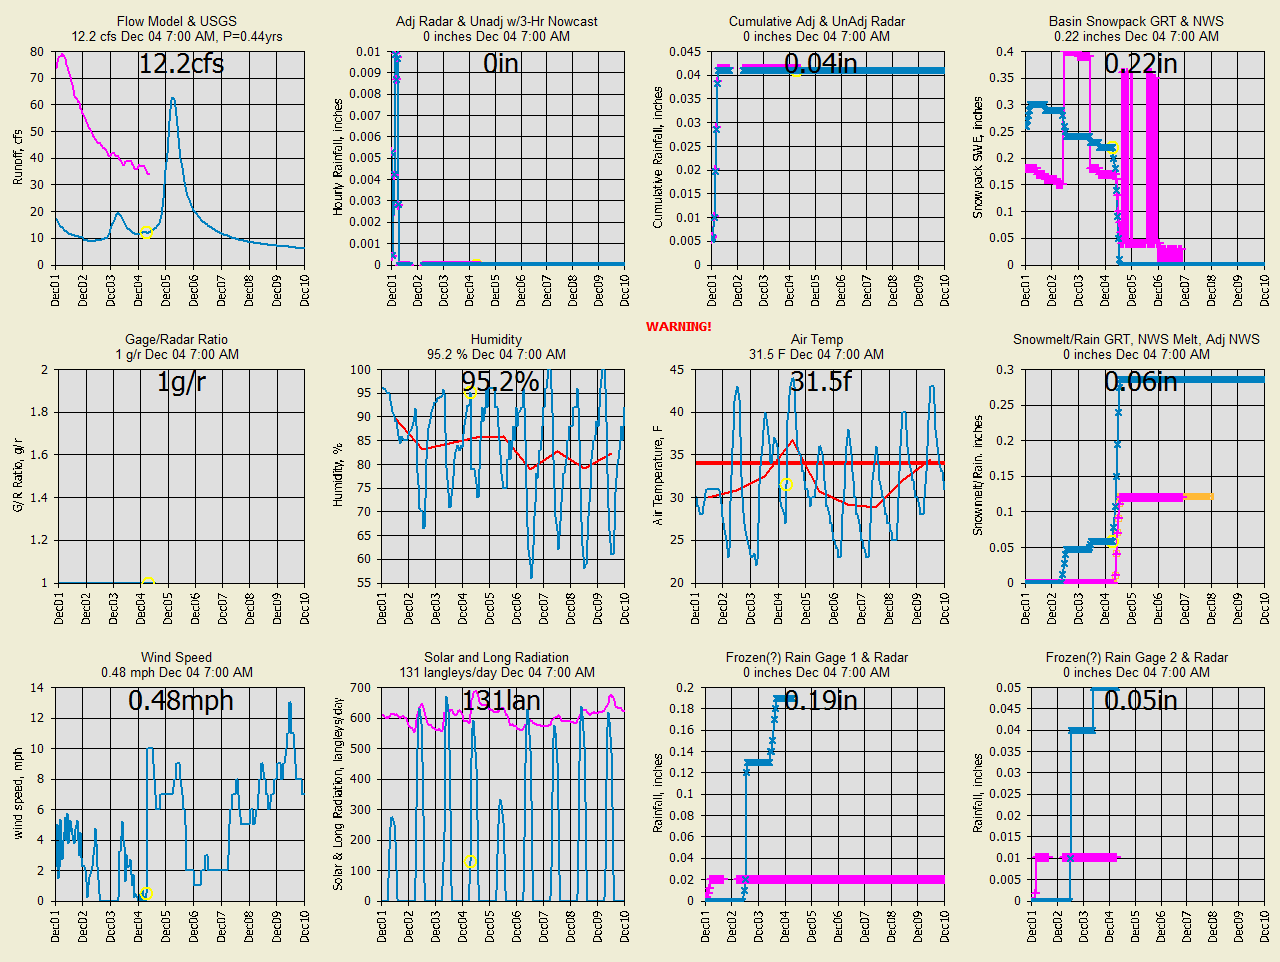
Dec
4, 2020 (Series 1=Blue, Series 2=Pink, Series 3=Orange,
Now=Yellow Circle):
NWS irratic changes to SWE are for updated startup as observations are made.
Dec 5, 2020 (Series 1=Blue, Series 2=Pink, Series 3=Orange,
Now=Yellow Circle):
NWS irratic changes to SWE are for updated startup as observations are made.
Past Runoff Comparisons:
Sep 15, 2019 (Series 1=Blue, Series 2=Pink, Series
3=Orange):
:

Massies Creek at Wilberforce OH
Point precipitation frequency estimates (inches) NOAA Atlas 14 Volume 2 Version
3
Data type: Precipitation depth Time series type: Partial duration
Project area: Ohio River Basin
Location name (ESRI Maps): Cedarville, Ohio, USA
Station Name: - Latitude: 39.7170° Longitude: -83.7470° Elevation (USGS):
1062.16 ft
Annual Peak Flows:
Important Note: Nothing on this page is intended as
interpretation of any legal authority such as water rights and supply. This page
is intended solely as a demonstration of techniques in flood potential
monitoring. The reader assumes all risk for any damages whatsoever in connection
with the access, use, quality, or performance of the supplied data just so you
know.
|