|
The 2015-2016 rainy season
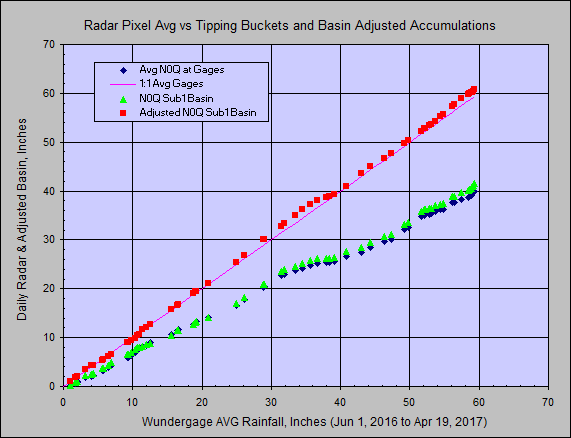
5-minute NEXRAD N0Q
radar, rain gages, and USGS data has been downloaded with my
free GetRealtime and ran as history and runoff
coefficients calibrated as best I can without looking at each event's rain
gages. Next year the rain gages will be monitored and coefficents updated
as needed. So here is the history's initial calibration......
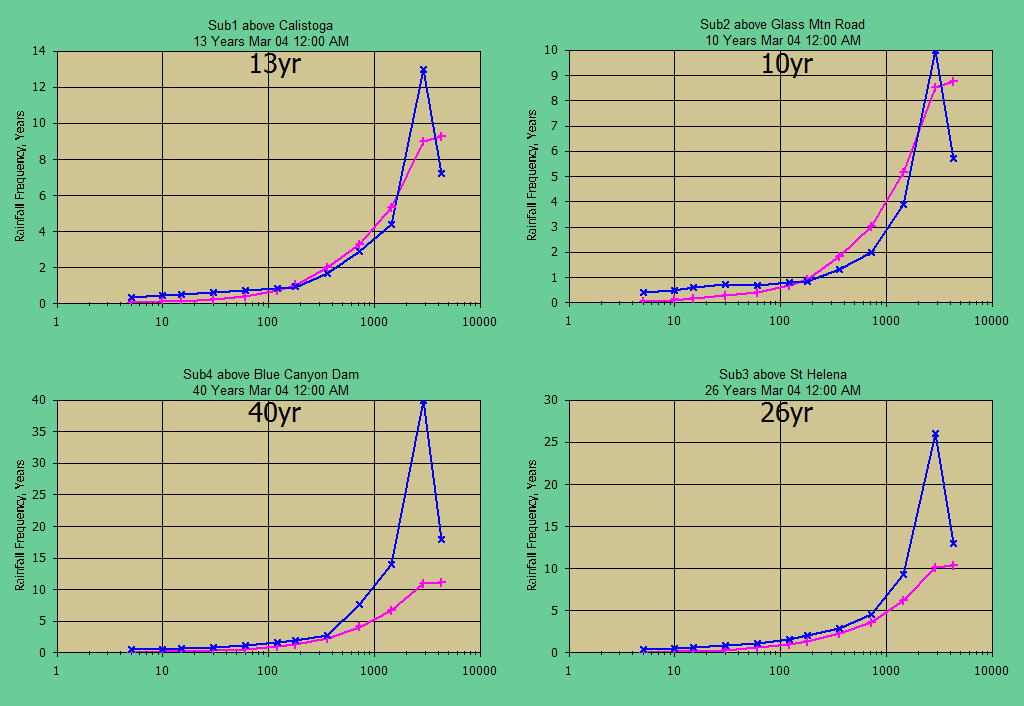
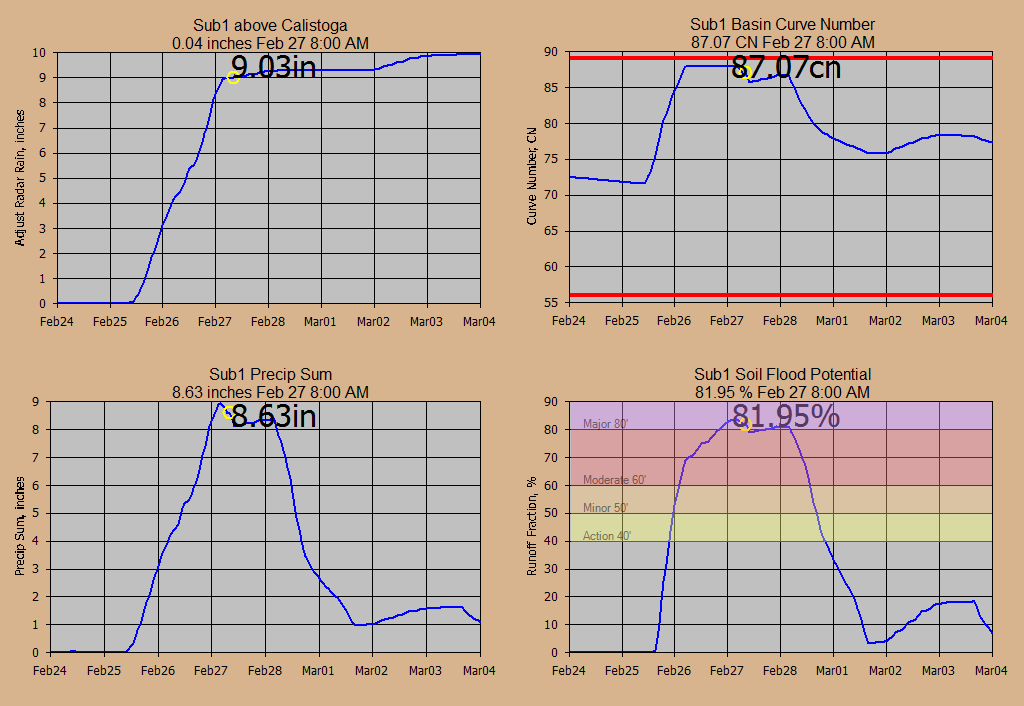
The basin above the USGS streamgage 11456000 NAPA R NR ST HELENA, CA was
subdivided into 4 subbasins using my free GetMapArea:
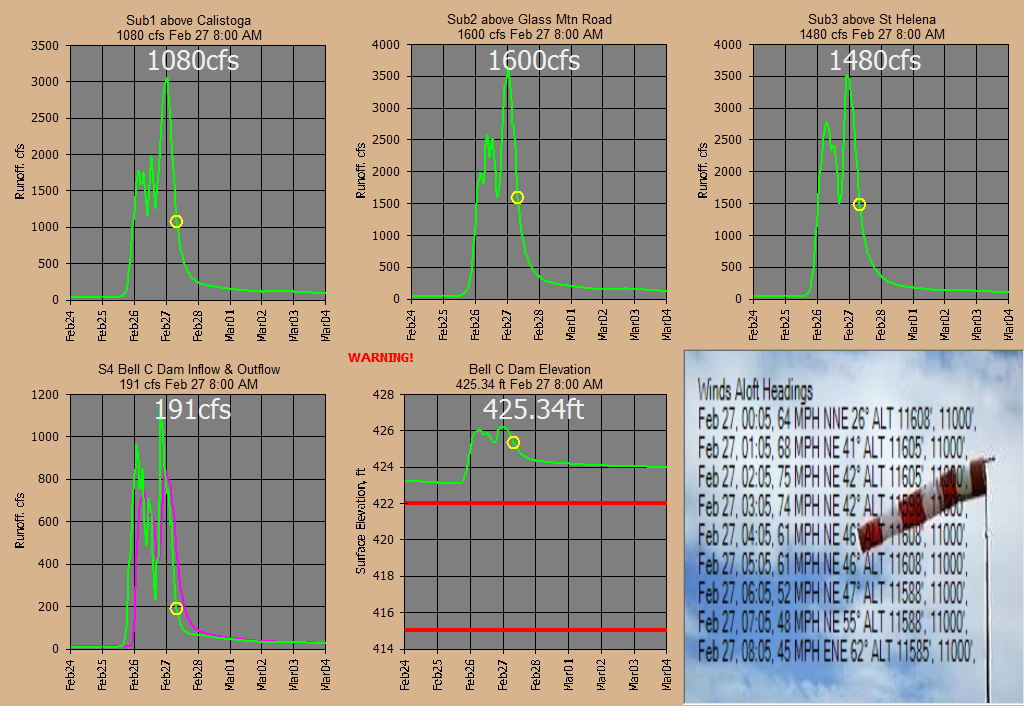
Sub 1: Above Lillie Street above Calistoga - 22.0 sqmi.
Sub 2: Above Glass Mountain Road above Barro - 29.8 sqmi.
Sub 4: Above Bell Canyon Dam above Barro - 5.87 sqmi.
Sub 3: Above Pope Street at St Helena USGS gage - 23.7 sqmi.
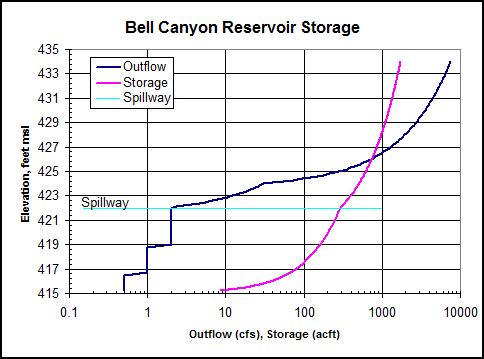
As you can see I added Sub 4 after I thought the
Bell Canyon Reservoir might need broken out and routed separately. The
reservoir capacity table was developed from the surface area using an estimated
power curve of H^1.06. So for 79 acres surface, at 1 ft depth, 79^1.06=103
so Storage=103*H^1.06. For the spillway a 5 ft wide rectangle notch 2 ft
high was guessed at (2*W*H^1.5) in a 80 ft long level ogee spillway (3*W*H^1.5)
by a pretty poor viewing with Google Earth
(but thanks be to shadows). A 0.5 to 2 cfs
water supply was diverted from the reservoir with a 7 ft drawdown available
below the spillway. All conjecture on my part. As it turns out all
probably unnessacary since I still had to construct a unit graph for the unusual
amount of storage in the system.
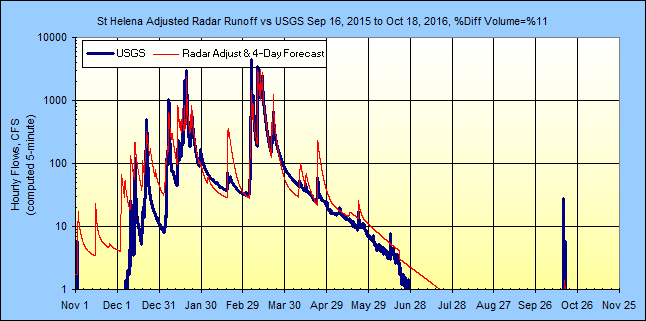
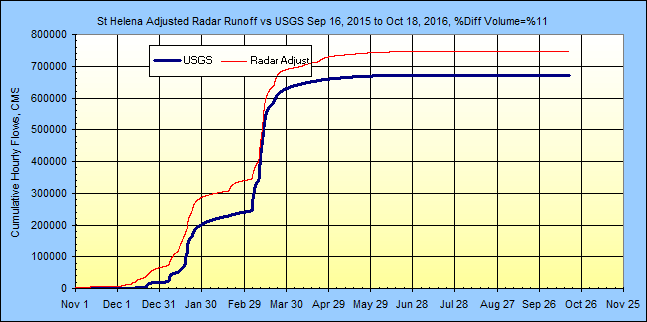
The channel routings were cascading Modified Puls ratings using my free
ModPulXsec with x-section data measured
with Google Earth about midway in each reach. The history runoff was run
as one period so the optimized cascades were based on 2/3's of the peak flow for
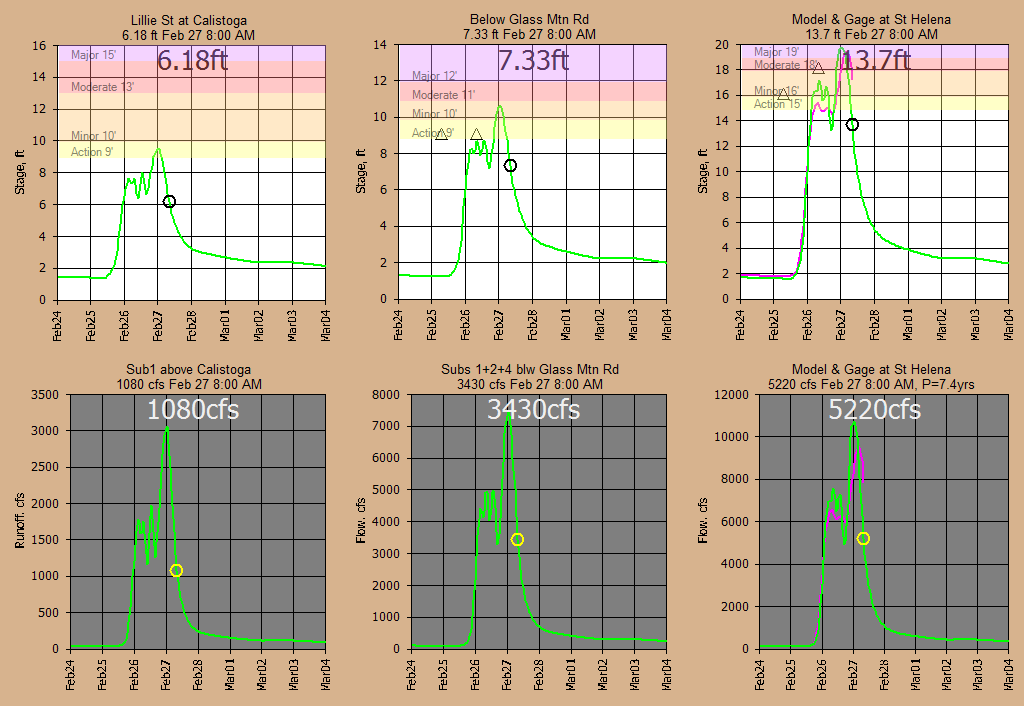
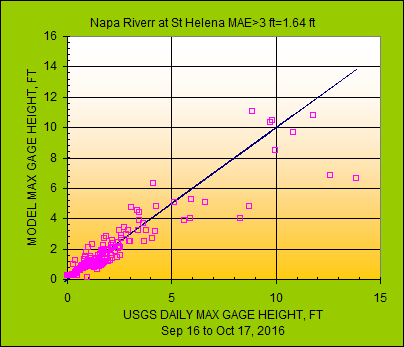
the year... so all is roughed in for now. The model stage at the USGS gage
is a lookup in the USGS rating. The stage at Calistoga is a Google Earth'd
x-section as is my below Glass Mtn Road stage rating. The bank full
elevation is the flood 'Action Stage' at my ratings and the USGS gage rating
'Action Stage' is from the NWS who operate a
continuous flood warning site here.
Let's see how we do.
This web page is automatically updated as my free GetRealime
runs in unattended batch mode... when rain is in the area.
Next year's
rainy season it will all be run in real-time and closely monitored for needed
adjustments and hopefully better results.
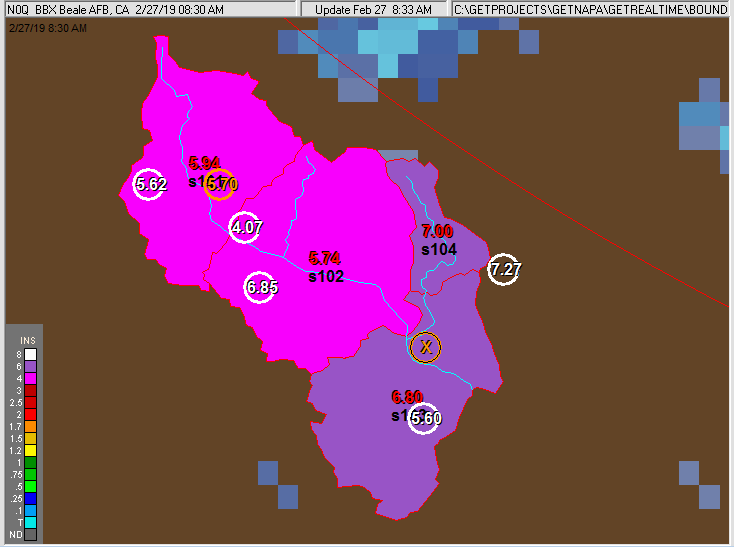
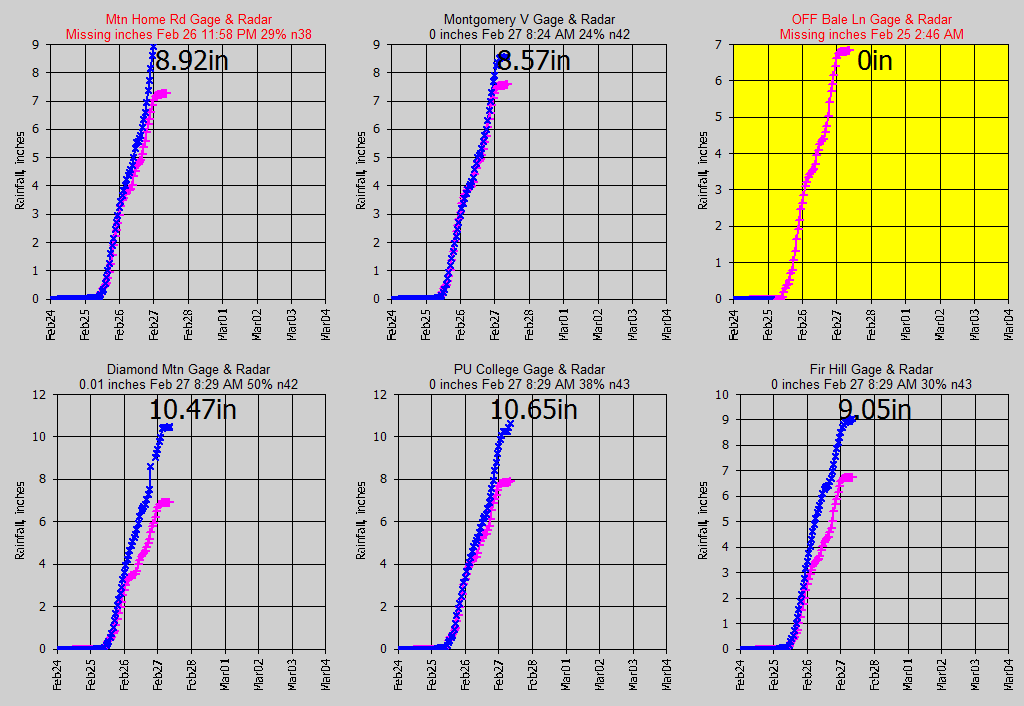
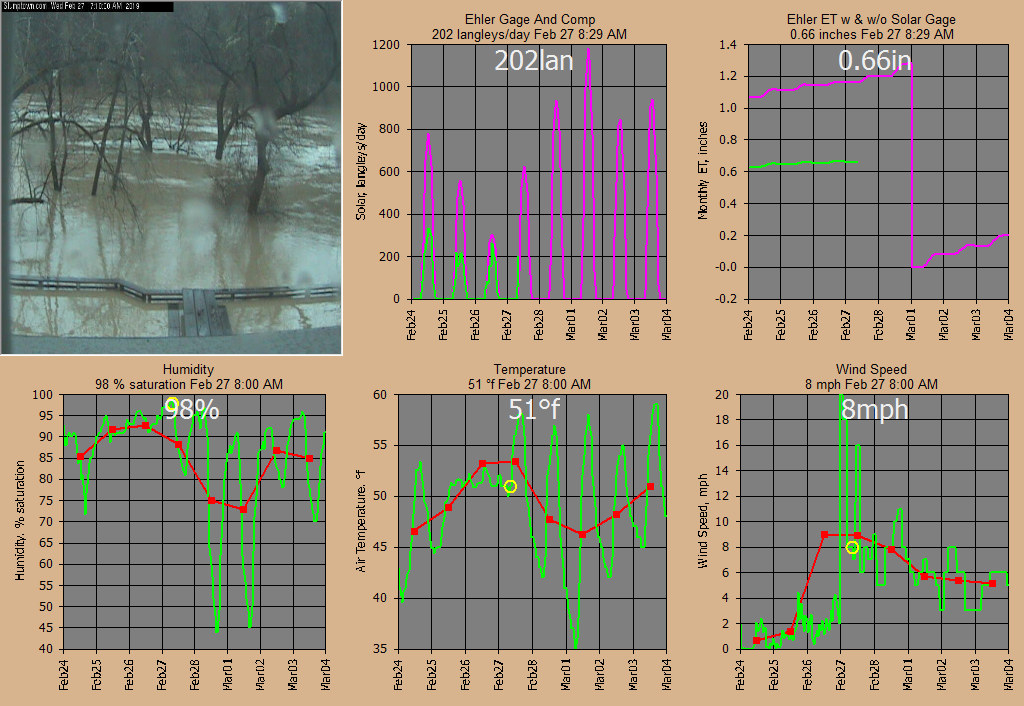
Last real-time radar image monitoring with my free GetNexrad: (radar cells are 0.6
miles wide)
Intellicast
big picture Current California Radar Loop:

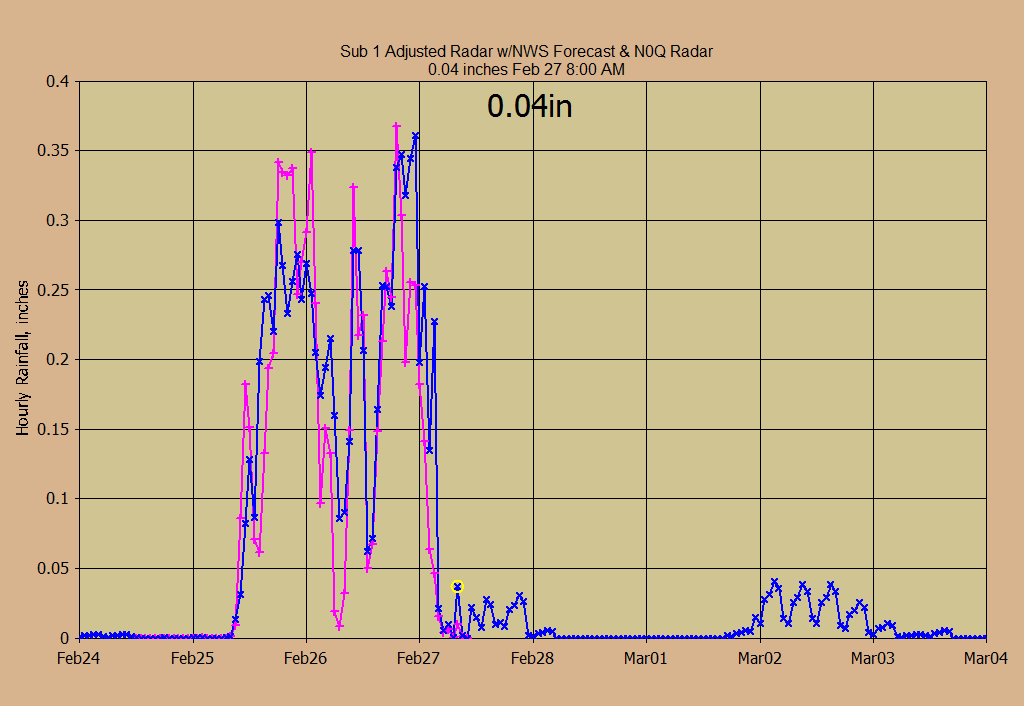
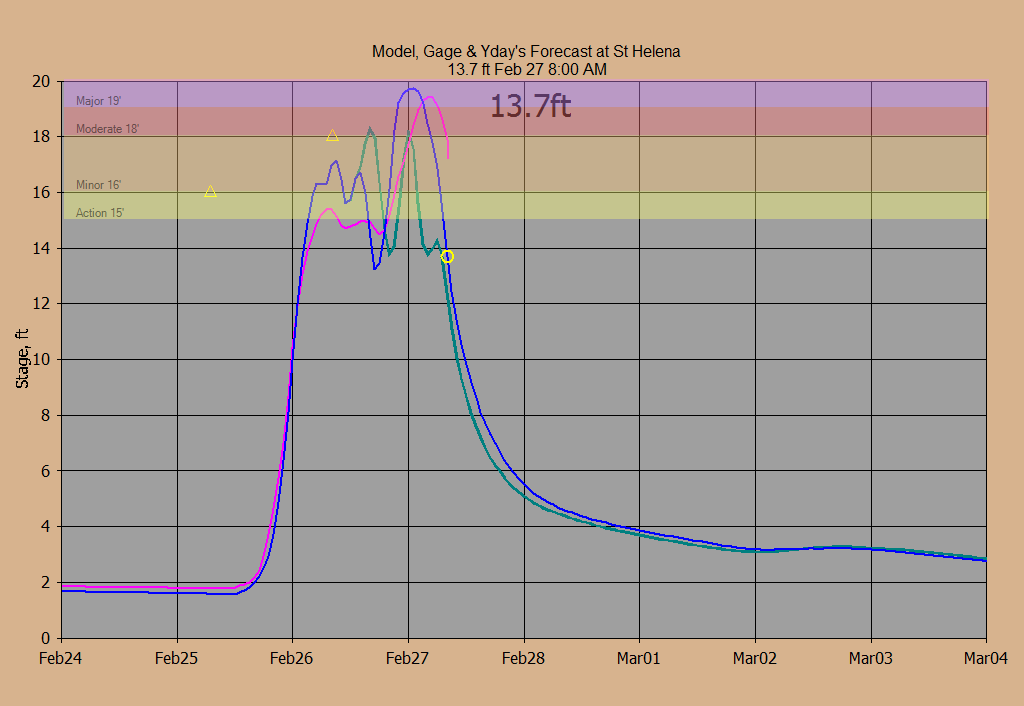
Current real-time monitoring graphs with my free GetGraphs:
If you need data from the database sent to your web page sort of like this data table,
then GetRealtime can shell my free GetFromAccessNow:
Alert triangles on NWS forecast > 0.1"/HR:
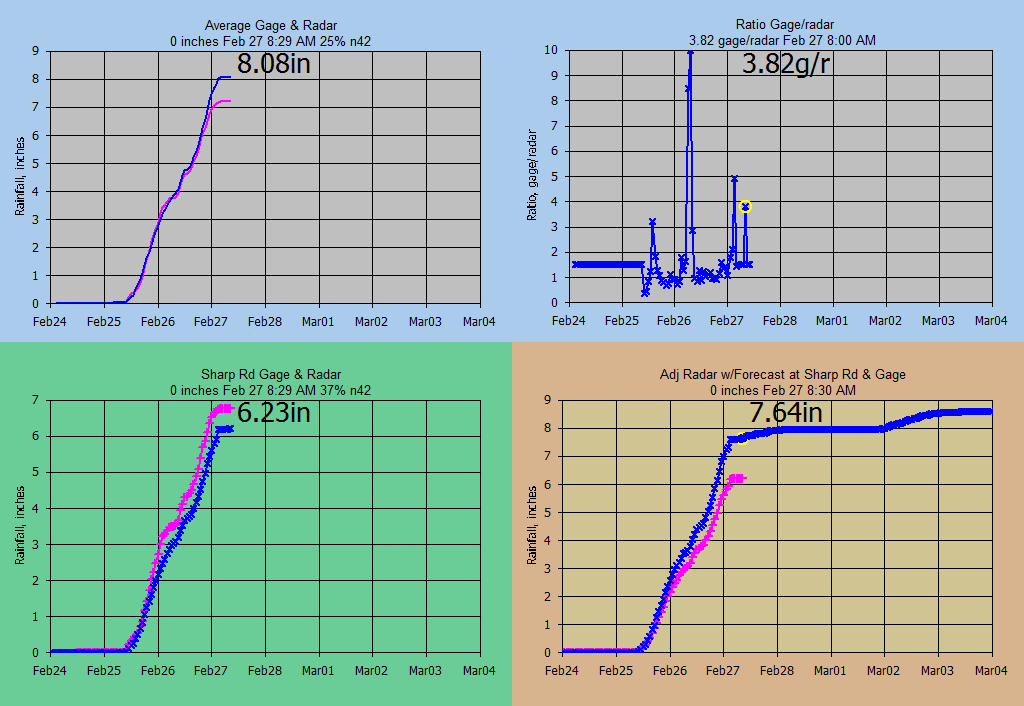
(all graphs pink colored series is the second source referred to so the pink
here is raw radar w/nowcast)
(The
Nowcasts will be evaluated on my
web page here.
Nowcast removed here due to coastline.)
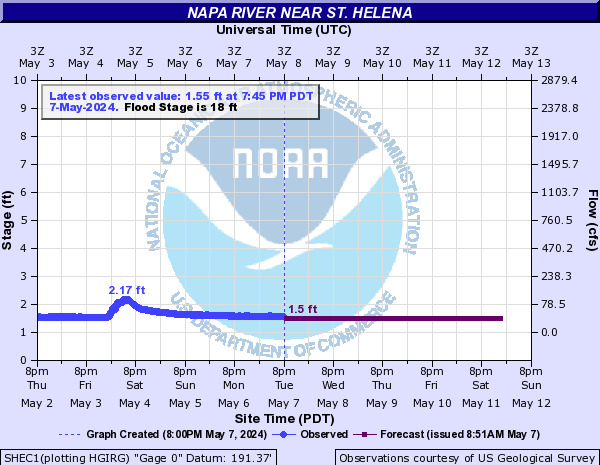
Flood Stage at USGS Gage at St. Helena:
=========================================
More Current Info.....
=========================================
Winds Aloft are used in the 2-hour
radar Nowcast:
The pic is on the nearby Russian River.
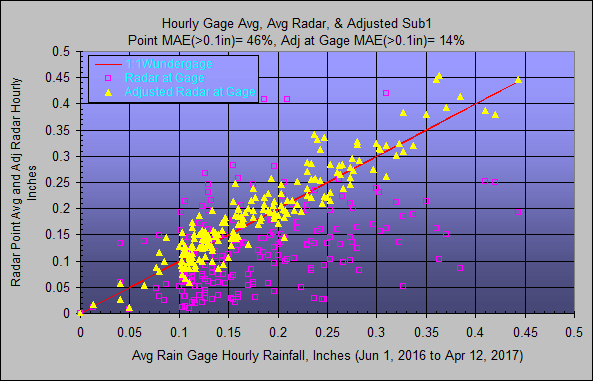
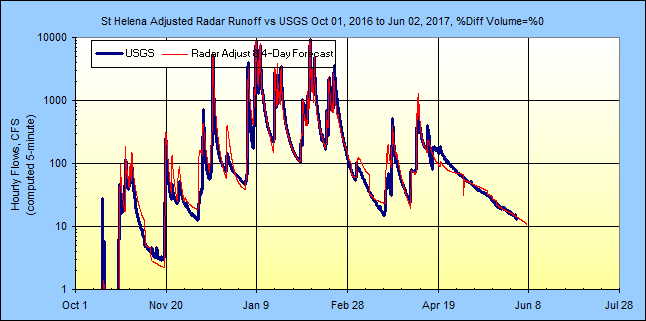
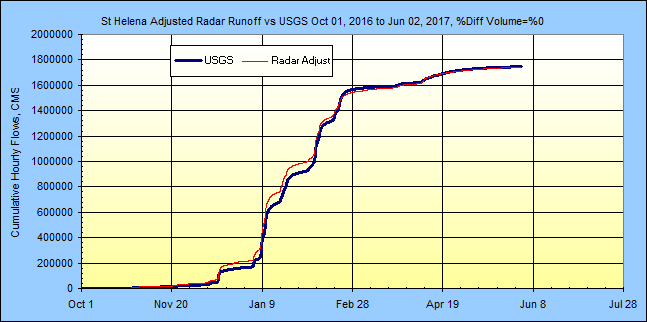
PART 2: Longer Term Oct 1, 2016 to Jun 1, 2017:

PART 1: 2015-2016 Initial Calibrations:
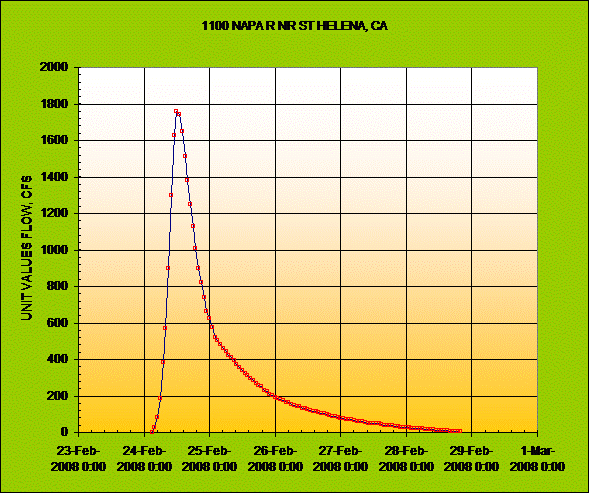
Napa.DGF
dimensionless unit graph computed for Feb 24, 2008. It was the best stand alone event I
found. Even still I had to remove a lump caused by more unwanted rainfall.
There were over 400 , 15-Minute
USGS flows for the period so after lump removal the 15-minute graph was
interpolated to hourlys before de-dimensionalizing. Could not you
have just used hourlys to begin with??? Hmmm.... dont confuse me.
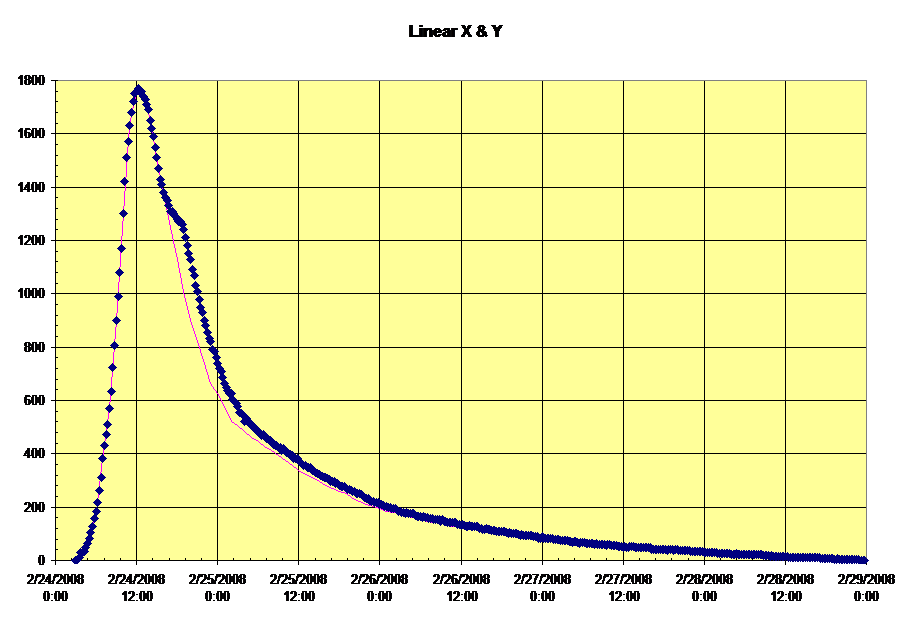
Interpoloate hourly
with my free GetRegression for
roughly 100 values in the unit graph construction:
A guesstimate of Bell Canyon
Dam Storage and Release curves:
(I can see I didn't do this
quite right, but you get the idea)
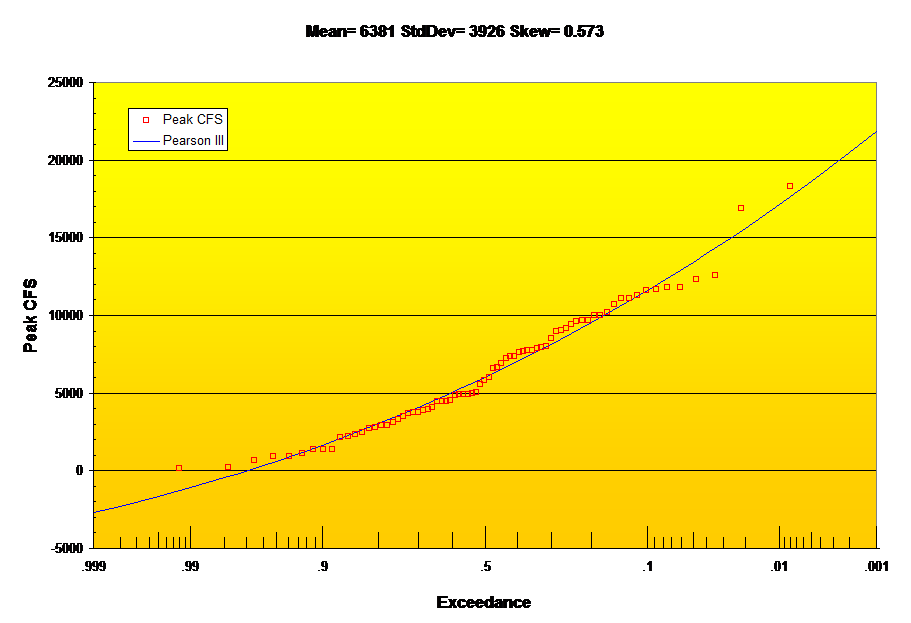
USGS
Napa River at Saint Helena
Gage Annual Peak Flow Normal Probability Distribution from my free
GetRegression:
(because of high Log skew, normal used) Flows below P=0.999 are shown as
fraction of this flow value on GetGraphs Pyrs= so I'm not sure what I did for
the 1 year flow here, certainly not a negative flow but so far seems reasonable???
Ah, because flows will always be zero or greater and within the 0.999
recurrance, no need for 1 year flow at all because all possible flows have
recurrence greater than 1 year (zero flow has 1.03 year recurrance). Did
the lower zero bound cause the high LOG skew or is there still rain on snow to
deal with??? The wiggly squigglys and those top 2 events are not encouraging.
On the other hand, a change in slope of plotting positions indicates a mixed
poplulation, but I don't see that here, even after 75 years of record.
The 6-hour NWS forecasts are distributed to 5-minutes using my California
distribution and thought that would fit in around here and
nowcasts based on winds aloft are limited to 2 hours because of the radar/coast
stratiform overshoot situation. Depending of wind speed and direction, 2
hours is pushing it so you don't want to cancel out the NWS forecast values with
bad radar. Update Jan 5, 2017: Nowcast removed
because the radar cannot see past the coastline and was zeroing out the NWS
forecast.
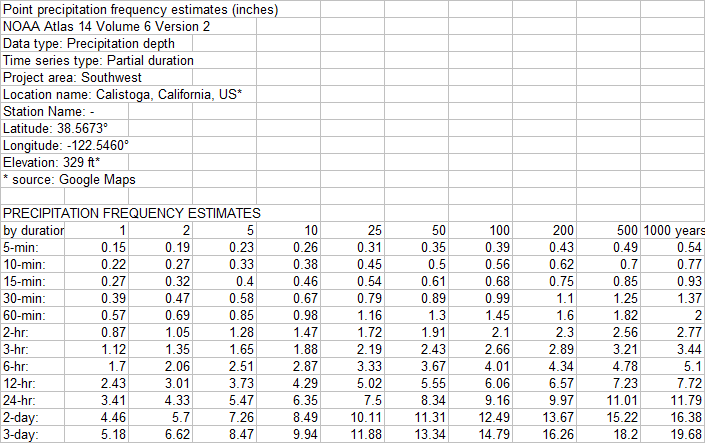
NOAA Atlas 14 used in frequency graphs above:
GetRealtime_setup.txt info:
Future Days=5
Percent Missing Allowed= 90%
Write Dailys= True
Write Hourly Avg= True
Write Daily Max= True
Write Unit Values= True
Write Unit Shifts= False
Overwrite Protected Source 5= True
Check for Possible Bad Values= False
Possible Bad Value Change= 200%
Last Runoff Run's Storage= True
Minutes between retrievals=60
Max hours of radar=4
Save Radar greater than= False
Beep on Save= True
Delete temporary internet files=True
Loop radar boundaries=True
Use Nexrad Ridge1 full web file listing=False
Use Nexrad short web file listing=False
Use Nexrad Ridge2 Iowa State Mesonet=True
Compact and Backup HDB at midnight= True
GetAccess.exe folder=C:\GETPROJECTS\GETNAPA\GETACCESS\
GetGraphs.exe folder=C:\GETPROJECTS\GETNAPA\GETGRAPHS\
GetNexrad.exe folder=C:\GETPROJECTS\GETNAPA\GETNEXRAD\
NowCast Info folder=C:\GETPROJECTS\GETNAPA\GETNEXRAD\
Gage Avg OnOff folder=C:\GETPROJECTS\GETNAPA\GETGRAPHS\
Radar Boundary File folder=C:\GETPROJECTS\GETNAPA\GETREALTIME\BOUNDARIES\
Menu Pic=C:\GETPROJECTS\GETNAPA\GETREALTIME\NAPA.JPG
Menu Text Color= 16035726
Minimize to System Tray=True
Column Widths=1305,615,2130,4725,555,4080,2205
Alert Address=
Alert Address CC=
Alert Address BCC=
Alert Start Time=-1
Don't Ask Questions=True
Create Winds Aloft graphic file=True
Metric Units=False
Database Connection String=Provider=Microsoft.Jet.OLEDB.4.0;Data
Source=C:\GetProjects\GetNapa\GetAccess\GetAccessHDB_Napa.mdb;User
Id=admin;Password=;
Station_ID; Datatype_Site_ID; Datatype_Name; Site_Name; base1; shift1; formula1;
base2; shift2; formula2; base3; shift3; formula3
************; ************; ************; *****BBX RADAR*******
NEXRAD-DAX; -10101; Radar Rain; Napa River at Calistoga, CA; 1
NEXRAD-DAX; -10102; Radar Rain; Napa River above Glass Mtn Road, CA; 1
NEXRAD-DAX; -10103; Radar Rain; Napa River blw Pope Street St Helena, CA; 1
NEXRAD-DAX; -10104; Radar Rain; Blue Canyon Reservoir, CA; 1
NEXRAD-DAX; -10131; Radar Rain; Mountain Home Rd; 1
NEXRAD-DAX; -10132; Radar Rain; Montgomery Vineyards; 1
NEXRAD-DAX; -10133; Radar Rain; Glass Mountain; 1
NEXRAD-DAX; -10134; Radar Rain; Ehlers Lane; 1
NEXRAD-DAX; -10135; Radar Rain; Sharp Rd Ranch; 1
NEXRAD-DAX; -10136; Radar Rain; PU College; 1
NEXRAD-DAX; -10137; Radar Rain; Magnolia Oaks; 1
************; ************; ************; *****NWS Forecasts*****
FORECAST-NWS; -11101; Forcast Rain; Sub 1 Napa River at Calistoga, CA; 0;
38.531, -122.499,4
FORECAST-NWS; -11102; Forcast Rain; Sub 2 Napa River above Glass Mtn Road, CA;
0; 38.531, -122.499,4
FORECAST-NWS; -11103; Forcast Rain; Sub 3 Napa River blw Pope Street St Helena,
CA; 0; 38.531, -122.499,4
FORECAST-NWS; -11104; Forcast Rain; Sub 4 Bell Canyon Reservoir, CA; 0; 38.531,
-122.499,4
FORECAST-NWS; -11135; Forcast Rain; Gage Sharp Rd Ranch, CA; 0; 38.531,
-122.499,4
FORECAST-NWS; 17131; Forcast Temperature; Mountain Home Rd Solar; 0; 38.531,
-122.499,4
FORECAST-NWS; 18131; Forcast Humidity; Mountain Home Rd Solar; 0; 38.531,
-122.499,4
FORECAST-NWS; 28131; Wind Speed; Mountain Home Rd Solar; 0; 38.531, -122.499,4
************; ************; ************; *****Wundergages*******
KCACALIS7; 10131; Rainfall; Mountain Home Rd Solar
KCACALIS7; 18131; Humidity; Mountain Home Rd Solar
KCACALIS7; 29131; Solar Radiation; Mountain Home Rd Solar; 0; 0; 2.065*P1
KCACALIS7; 27131; ET Grass; Mountain Home Rd Solar; 0; 38.531, -122.499,-120,
272,0.75
KCACALIS7; 17131; Temperature; Mountain Home Rd Solar
KCACALIS7; 28131; Wind Speed; Mountain Home Rd Solar
COMPUTE; -29131; Solar Radiation; Mountain Home Rd Solar; 0; 38.531,
-122.499,-120, 272
COMPUTE; -27131; ET Grass; Mountain Home Rd Solar; 0; 38.531, -122.499,-120,
272,0.75
KCACALIS19; 10132; Rainfall; Montgomery Vineyards KCASAINT14; 10133; Rainfall;
Glass Mountain
KCACALIS5; 10135; Rainfall; Sharp Rd Ranch KCAANGWI11; 10136; Rainfall; PU
College
KCASAINT12; 10137; Rainfall; Magnolia Oaks KCASAINT7; 10134; Rainfall; Ehlers
Lane Solar
**poor wind speed
KCASAINT30; 18134; Humidity; Ehlers Lane Solar
************; ************; ************; *****RATIO*******
COMPUTE-hour; 10121; Rainfall; Napa Avg Rain Gages; 0; 0; (P1+P2+P3+P4)/N
COMPUTE-hour; -10121; Rainfall; Napa Avg Radars; 0; 0; (P1+P2+P3+P4)/N
COMPUTE-hour; -31121; Ratio; Napa Avg Ratio; 0; 0.003,4,20; P1/P2
COMPUTE-hour; 10122; Rainfall; Napa Avg Rain Gages; 0; 0; (P1+P2+P3+P4)/N
COMPUTE-hour; -10122; Rainfall; Napa Avg Radars; 0; 0; (P1+P2+P3+P4)/N
COMPUTE-hour; -31122; Ratio; Napa Avg Ratio; 0; 0.003,4,20; P1/P2
************; ************; ************; *****Adjusted Rainfall*******
COMPUTE-unit; -11101; Adj Radar Rain; Sub 1 Napa River at Calistoga, CA; 0; -1,
4.0,0.3,1.5; P1*P2
COMPUTE-unit; -11102; Adj Radar Rain; Sub 2 Napa River above Glass Mtn Road, CA;
0; -1, 4.0,0.3,1.5; P1*P2
COMPUTE-unit; -11103; Adj Radar Rain; Sub 3 Napa River blw Pope Street St
Helena, CA; 0; -1, 4.0,0.3,1.5; P1*P2
COMPUTE-unit; -11104; Adj Radar Rain; Sub 4 Bell Canyon Reservoir, CA; 0; -1,
4.0,0.3,1.5; P1*P2
COMPUTE-unit; -11135; Adj Radar Rain; Spring Mountain Gage, CA; 0; -1,
4.0,0.3,1.5; P1*P2
************; ************; ************; *****Runoff******
COMPUTE-unit; -30101; Runoff; Sub 1 Napa River at Calistoga, CA; 0; 8, 56, 0.1,
0.1, 22.05, 2.2, 0.07, 0.3, 4.5, 0.3, 8, 89, 56, 0.8, 0.25, 2.5, 0, .8, 0.03,
1.00, 0, 0.2, 1, 0.7, -1, LagV; P1; 0; NapaRiver.DGF
COMPUTE-unit; -30102; Runoff; Sub 2 Napa River above Glass Mtn Road, CA; 0; 9,
56, 0.1, 2, 29.76, 2.2, 0.07, 0.3, 4.5, 0.3, 8, 89, 56, 0.8, 0.25, 2.5, 0, 0.8,
0.03, 0.8, 0, 0.2, 1, 0.7, 0, LagV; P1; 0; NapaRiver.DGF
COMPUTE-unit; -30103; Runoff; Sub 3 Napa River blw Pope Street St Helena, CA; 0;
9.5, 56, 0.1, 0.1, 23.71, 2.2, 0.07, 0.3, 4.5, 0.3, 8, 89, 56, 0.85, 0.25, 2.5,
0, 0.8, 0.03, 1.00, 0, 0.2, 1, 0.7, 0, LagV; P1; 0; NapaRiver.DGF
COMPUTE-unit; -30104; Runoff; Sub 4 Napa River Into Bell Canyon Reservoir; 0;
3.5, 56, 0.1, 0.1, 5.869, 2.2, 0.07, 0.3, 4.5, 0.3, 8, 89, 56, 0.5, 0.25, 2.5,
0, 0.8, 0.03, 1.00, 0, 0.2, 1, 0.7, 0, LagV; P1; 0; NapaRiver.DGF
************; ************; ************; *****Route******
ROUTE-unit; -1104; Flow; Route Bell Can Dam In And Out to Main
ROUTE-unit; -1102; Flow; Route Sub 1, Bell And Combine Sub 2
ROUTE-unit; -1103; Flow; Route Sub 1+2+Bell And Combine Sub 3
LOOKUP-Unit; -2101;
Stage>-daymax-9ft_action,11ft_minor,13ft_moderate,15ft_major; Napa R at
Calistoga
LOOKUP-Unit; -2102;
Stage>-daymax-9ft_action,10ft_minor,11ft_moderate,12ft_major; Napa R below Glass
Mtn Rd
Run-LOOKUP-Unit; -2103;
Stage>-daymax-15ft_action,16ft_minor,18ft_moderate,19ft_major; Napa R at St
Helna
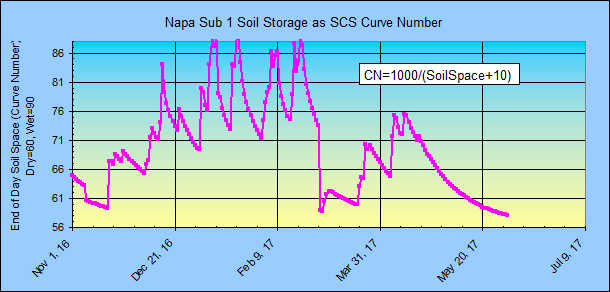
************; ************; ************; *****Soil Moisture*****
COMPUTE-hour; -6101; Soil Runoff Fraction; Napa R at Calistoga Soil Flood
Potential; 0; 0; 0; P2>0.2*P1; 0; 100*(P2-0.2*P1)^2/(P2+0.8*P1)/P2
COMPUTE-hour; -5101; SCS CN; Napa R at Calistoga Soil CN; 0; 0; 1000/(P1+10)
************; ************; ************; *****USGS*****
11456000; 1100; Flow; NAPA R NR ST HELENA, CA 11456000; 2100; Gage Height; NAPA
R NR ST HELENA, CA
************; ************; ************; ***** Shell Pics To Web*****
**SET-INTERVAL; -11101; Forcast Rain; Aldridge Cr at Toney Basin, AL; +4,rhour;
60; P1>.001; 0; 30; P1>.2
SHELL-C:\GETPROJECTS\GETNAPA\GETNEXRAD\GetNexrad.exe -2 mypassword; 0; Pic; Pic
of Radar; 0
SHELL-C:\GETPROJECTS\GETNAPA\GETGRAPHS\GetGraphs.exe 4 mypassword; 0; Graphs;
Getgraphs to Web; 0
SHELL-C:\GETPROJECTS\GETNAPA\GETGRAPHS\GetFromAccessNOW.exe rdaymax, 17131 10121
-10121 -11101 -10101 1100 2100 -2103 -1103, -2, 5, NapaNOW.txt, mypassword; 0;
Flow Data to Web; Put Flow Data Text File on Web; 0
END
Important Note: Nothing on this page is intended as
interpretation of any legal authority such as water rights and supply. This page
is intended solely as a demonstration of techniques in flood potential
monitoring. The reader assumes all risk for any damages whatsoever in connection
with the access, use, quality, or performance of the supplied data just so you
know.
|