|
The
Dec 2015
5-minute N0Q Huntsville radar, rain gages, and USGS data has been downloaded with my
free GetRealtime and ran as history and runoff
coefficients calibrated as best I can without looking at each event's rain
gages. Now the rain gages will be monitored and coefficents updated
as needed. So here is the history's initial calibration......
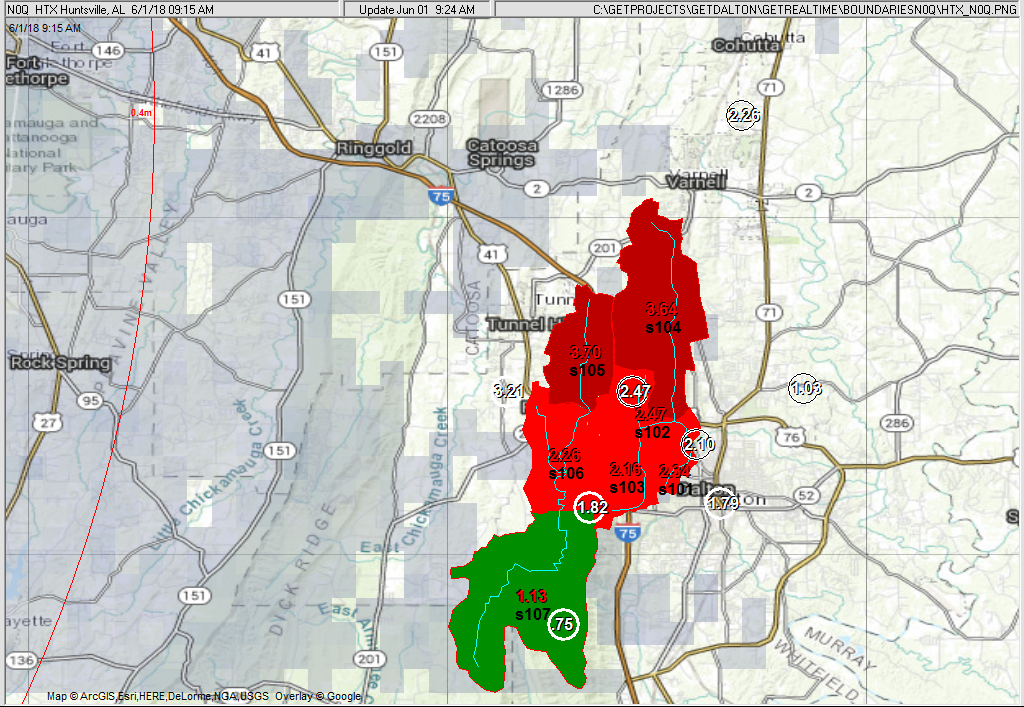
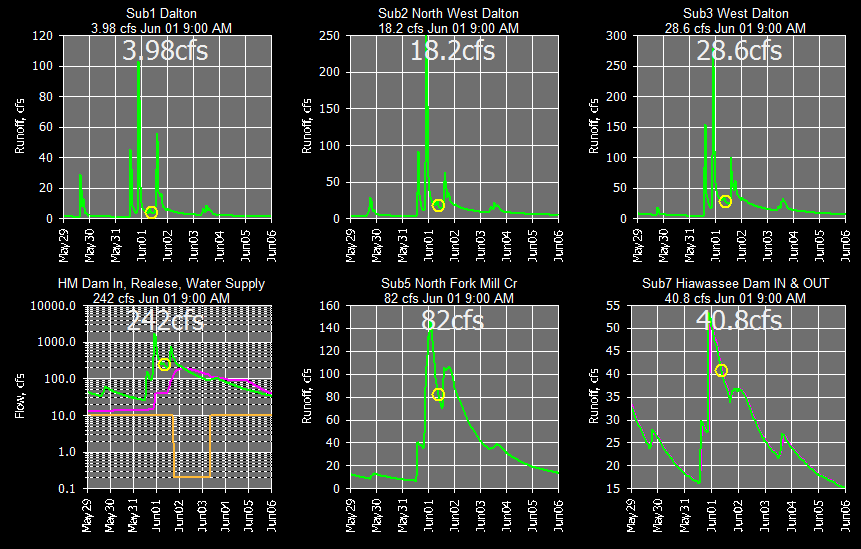
The basin above the USGS streamgage 02385500 MILL
CREEK AT DALTON, GA was
subdivided into 7 subbasins using my free GetMapArea. The
subbasins are shown on my free GetNexrad display below.
The USGS rain gage appears to be another worst in the world as half of them are.
You can't make this stuff up.
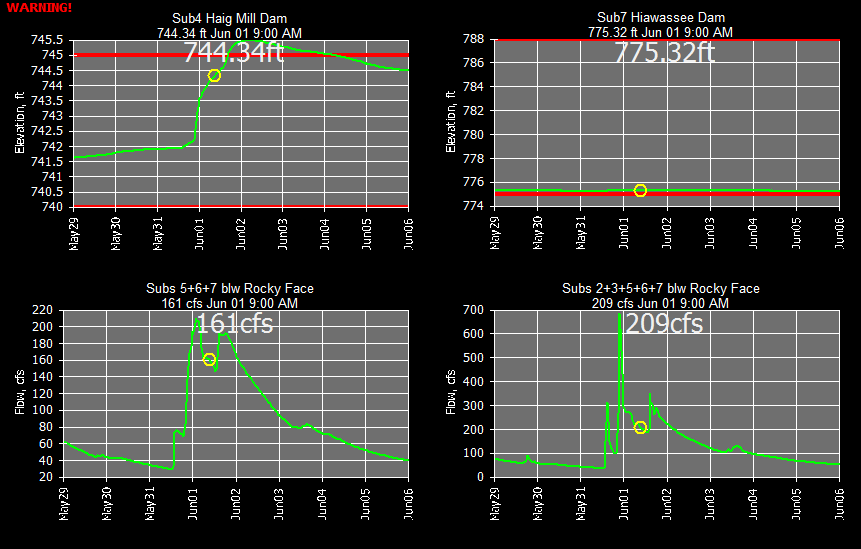
The largest two of many ponds and reservoirs were broken out for routings. The
Haig Mill Lake capacity table was developed from 2 content values I found online
as "height is 57 feet Its capacity is 5545 acre feet. Normal storage is 2212
acre feet" which was plenty to go on. The other smaller reservoir,
Hiawassee Company Lake, was based on it's normal surface area and and top of dam
elevation contour elevation area using Google Earth as 34 acres and 50 acres. So for
34 acres surface, at 1 ft depth, 34^1.1=48.4
so Storage=48.4*H^1.1 and then the 1.1 jiggled to hit 50 acres when full.
The power curve was jiggled on Haig Mill Lake to hit to 2 known
capacitiess.
For the spillways, Haig Mill Dam has an 80 ft long level ogee spillway Q=3*80*H^1.5 and an outlet
structure estimated as Q=0.6*12.5*(64.4*H)^0.5. Hiawassee has a roadway
dip on the top of dam so again and effective W of Q=3*80*H^1.5. (Do all
small dams have 80' spillways??? Every one I have come across so far has
been.). The Hiawassee Dam outlet stucture uses Q=0.6*36*(64.4*H)^0.5.
All from Google Earth guesstimates.
Haig Mill Reservoir has a 1 cfs water supply diversion I guessed at so if inflow
is less than 1 cfs then a drawdown of up to 35 ft is possible. All this
is pure conjecture but should get us in the ballpark.
The channel routings were cascading Modified Puls ratings using my free
ModPulXsec with x-section data measured
with Google Earth about midway in each reach. The history runoff was run
as one period so the optimized cascades were based on 2/3's of the peak flow for
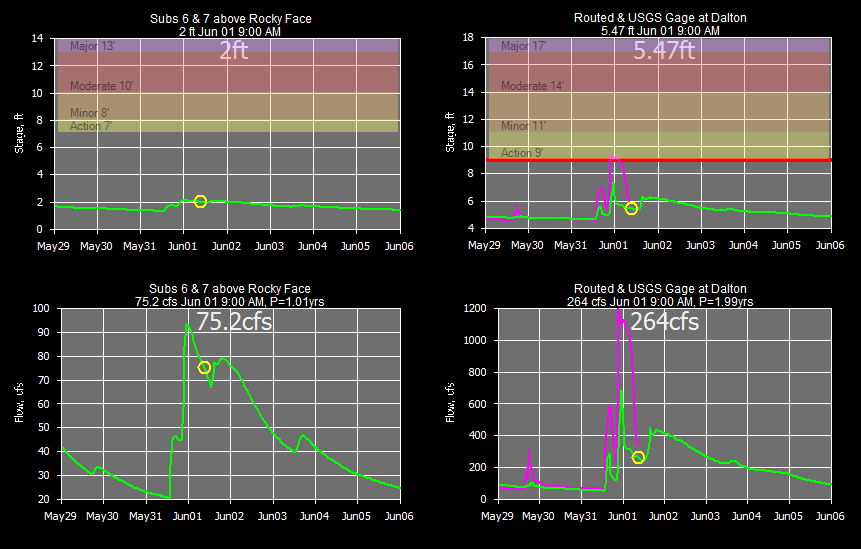
the year... so all is roughed in for now. The model stage at the USGS gage
is a lookup in the USGS rating. The stage above Rocky Face is a Google Earth'd
x-section. The bank full
elevation is the flood 'Action Stage' at my ratings and the USGS gage rating
'Action Stage' is from the NWS who operate a
observed flooding site here.
The history period Jan 1-Jun 1, 2016
was subsequently downloaded, some
refinements made to the Dec calibrations, but not many and looks like we are
in the ballpark.
Let's see how we do in real-time
(all times are my Pacific Time).
This web page is automatically updated as my free GetRealime
runs in unattended batch mode... when rain is in the area.
Last real-time radar image monitoring by shelled free GetNexrad: (radar cells are 0.6
miles wide)
Intellicast big picture Current Approaching Radar Loop:

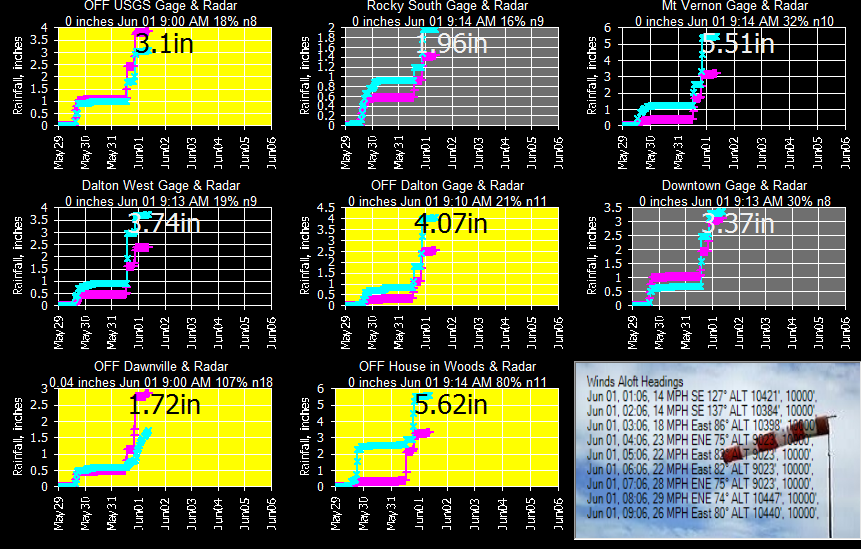
Current real-time monitoring graphs with my free GetGraphs:
If you need data from the database sent to your web page sort of like this data table,
then GetRealtime can shell my free GetFromAccessNow:
Current Hourly Values...
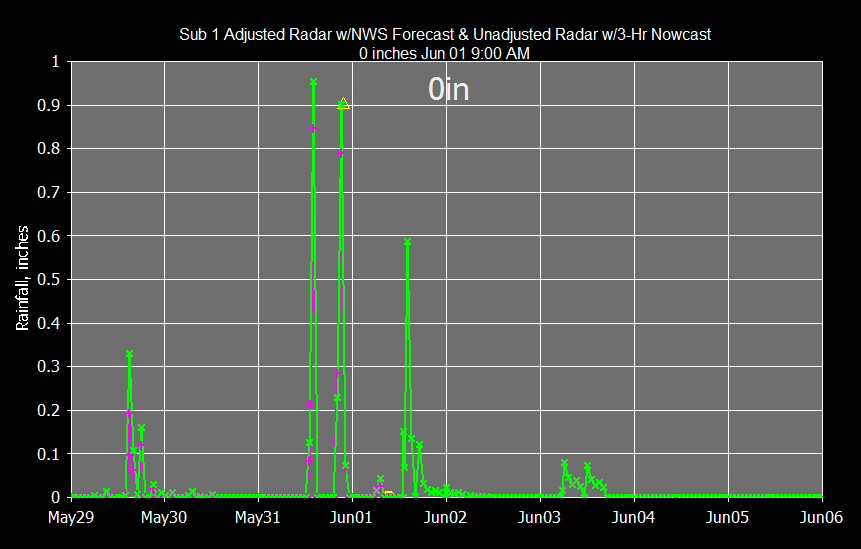
NWS forecast and 3-Hour Nowcast:
Alert triangles for forecasts greater than 0.1 inch/hour.
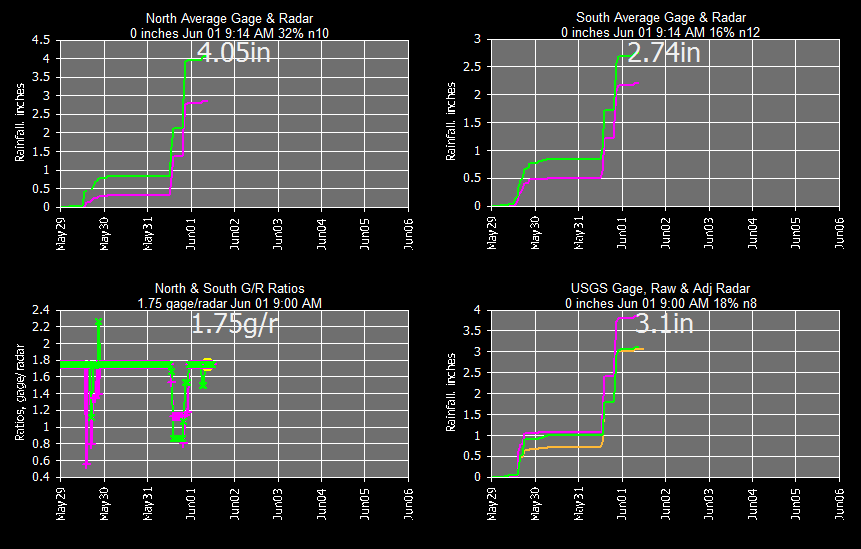
(All graphs pink colored series is the second source referred to so the pink
here is raw radar w/nowcast)
(The
Nowcasts will be evaluated on my
web page here.)
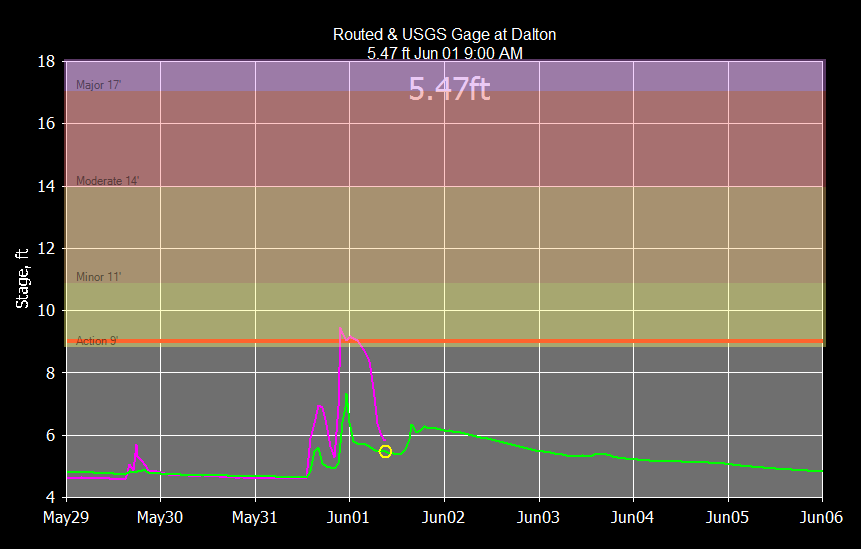
Flood Stage at Dalton Gage:
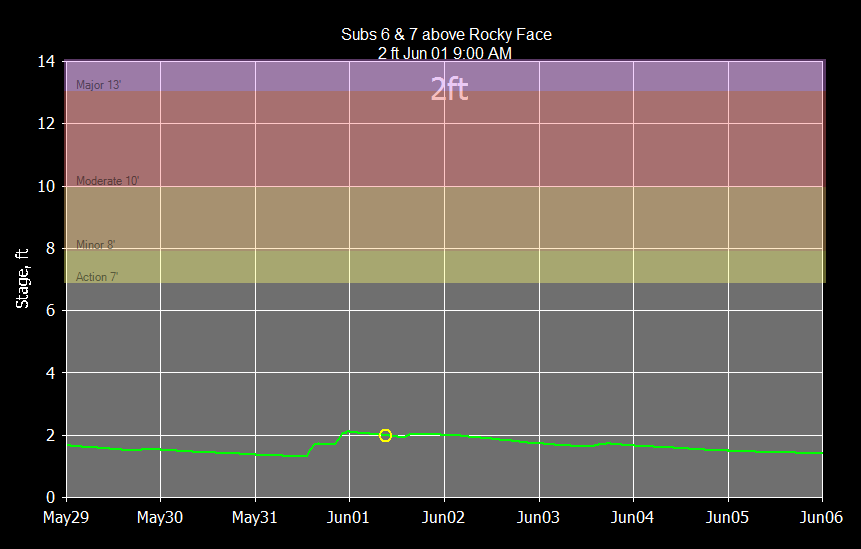
Flood Stage of South Fork Above Rocky Face:
========================================================
More Current Info...........
========================================================
Nov 2016 to ... (started out in extreme drought):
2015-2016 Initial Calibrations:
Radar Raingall Adjustments, Hourly and Daily:
The Dailys always line up, it's the hourlys that count!!!
Haig Mill Creek Dam Storage Curve Estimate includes 1 cfs water supply so rated
outflow will have 1 cfs removed after routing.
Hiawassee Company Dam Storage Curve Estimate:
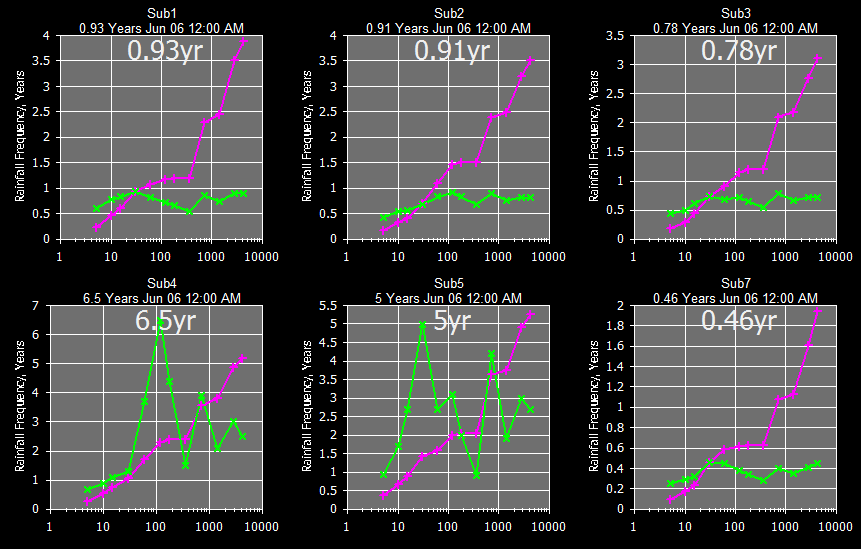
USGS Mill Creek at Dalton
Gage Annual Peak Flow Log-Normal Probability Distribution from my free
GetRegression: (Haig Mill Dam built in 1995 on Sub 4 seems to
really dampen the peaks here, along with the paradox valley outflow of Subs
5,6,7 being at right angle to their basin long valley axis. The dam seems
to have
reduced the 100 year flow from 9,900 cfs to 2,700 cfs.
Just for your info, here are the peaks prior to Haig Mill Dam (1944-1959):
For the flows rated at a xsection above Rocky Face for Subs 6+7, the USGS
Southeastern regional analysis by Gotvald (q10=398*A^0.617) was way too high for
this paradoxical valley so I removed the Sub 4 Haig Mill basin from the USGS
gage 40 sqmi and used Subs 6+7 area 9.5/31.6=0.3 * USGS latest period peaks.
This should provide a guesstimate of flood flow recurrence for this point in
GetGraphs above.
The 6-hour NWS forecasts are distributed to 5-minutes using my Vegas 3
distribution and thought that would fit in around here and nowcasts based on
winds aloft are limited to 3 hours.
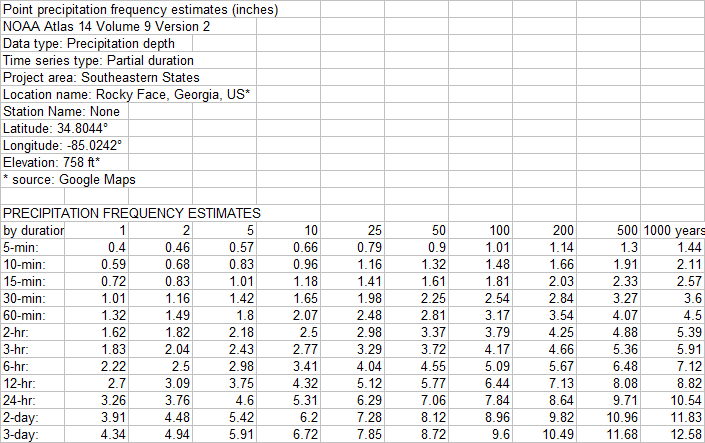
NOAA Atlas 14 used in frequency graphs above:
Current GetRealtime_setup.txt file:
Future Days=5
Percent Missing Allowed= 100%
Write Dailys= True
Write Hourly Avg= True
Write Daily Max= True
Write Unit Values= True
Write Unit Shifts= False
Overwrite Protected Source 5= True
Check for Possible Bad Values= False
Possible Bad Value Change= 200%
Last Runoff Run's Storage= True
Minutes between retrievals=60
Max hours of radar=4
Save Radar greater than= False
Beep on Save= True
Delete temporary internet files=True
Loop radar boundaries=True
Use Nexrad Ridge1 full web file listing=False
Use Nexrad short web file listing=False
Use Nexrad Ridge2 Iowa State Mesonet=True
Compact and Backup HDB at midnight= True
GetAccess.exe folder=C:\GETPROJECTS\GETDALTON\GETACCESS\
GetGraphs.exe folder=C:\GETPROJECTS\GETDALTON\GETGRAPHS\
GetNexrad.exe folder=C:\GETPROJECTS\GETDALTON\GETNEXRAD\
NowCast Info folder=C:\GETPROJECTS\GETDALTON\GETNEXRAD\
Gage Avg OnOff folder=C:\GETPROJECTS\GETDALTON\GETGRAPHS\
Radar Boundary File folder=C:\GETPROJECTS\GETDALTON\GETREALTIME\BOUNDARIESN0Q\
Menu Pic=C:\GETPROJECTS\GETDALTON\GETREALTIME\DALTON.JPG
Menu Text Color= 5869787
Minimize to System Tray=True
Column Widths=1500,615,2130,2280,555,1890,2205
Alert Address=
Alert Address CC=
Alert Address BCC=
Alert Start Time=-1
Don't Ask Questions=True
Create Winds Aloft graphic file=True
Metric Units=False
Database Connection String=Provider=Microsoft.Jet.OLEDB.4.0;Data
Source=C:\GetProjects\GetDALTON\GetAccess\GetAccessHDB_DALTON.mdb;User
Id=admin;Password=;
Station_ID; Datatype_Site_ID; Datatype_Name; Site_Name; base1; shift1; formula1;
base2; shift2; formula2; base3; shift3; formula3
************; ************; ************; *****N0Q RADAR*******
NEXRAD-HTX; -10101; Radar Rain; Sub 1 Mill Cr, Dalton, GA; 0; Nowcast 3, adjust
type 3
Run-NEXRAD-HTX; -10102; Radar Rain; Sub 2 Mill Cr, Dalton, GA; 0; Nowcast 3,
adjust type 3
NEXRAD-HTX; -10103; Radar Rain; Sub 3 Mill Cr, Dalton, GA; 0; Nowcast 3, adjust
type 3
NEXRAD-HTX; -10104; Radar Rain; Sub 4 Mill Cr, Dalton, GA; 0; Nowcast 3, adjust
type 3
NEXRAD-HTX; -10105; Radar Rain; Sub 5 Mill Cr, Dalton, GA; 0; Nowcast 3, adjust
type 3
NEXRAD-HTX; -10106; Radar Rain; Sub 6 Mill Cr, Dalton, GA; 0; Nowcast 3, adjust
type 3
NEXRAD-HTX; -10107; Radar Rain; Sub 7 Mill Cr, Dalton, GA; 0; Nowcast 3, adjust
type 3
NEXRAD-HTX; -10131; Radar Rain; USGS CREEK AT DALTON, GA
NEXRAD-HTX; -10132; Radar Rain; KGAROCKY2 Rocky Face Ridge, GA
NEXRAD-HTX; -10133; Radar Rain; KGATUNNE2 Mt Vernon, GA
NEXRAD-HTX; -10134; Radar Rain; KGADALTO8 Dalton West, GA
NEXRAD-HTX; -10135; Radar Rain; KGADALTO11 Dalton, GA
NEXRAD-HTX; -10136; Radar Rain; KGADALTO7 Downtown Dalton, GA
NEXRAD-HTX; -10137; Radar Rain; KGADALTO19 Dawnville, GA
NEXRAD-HTX; -10138; Radar Rain; KGARINGG10 Pleasant Valley, GA
************; ************; ************; *****NWS Forecasts*****
FORECAST-NWS; -11101; Forcast Rain>0.3"-hour; Sub 1; -3; 34.8044,-85.0242,3
FORECAST-NWS; -11102; Forcast Rain; Sub 2; -3; 34.8044,-85.0242,3
FORECAST-NWS; -11103; Forcast Rain; Sub 3; -3; 34.8044,-85.0242,3
FORECAST-NWS; -11104; Forcast Rain; Sub 4; -3; 34.8044,-85.0242,3
FORECAST-NWS; -11105; Forcast Rain; Sub 5; -3; 34.8044,-85.0242,3
FORECAST-NWS; -11106; Forcast Rain; Sub 6; -3; 34.8044,-85.0242,3
FORECAST-NWS; -11107; Forcast Rain; Sub 7; -3; 34.8044,-85.0242,3
Run-FORECAST-NWS; 11135; Rainfall; Dalton, GA; -3; 34.8044,-85.0242,3
************; ************; ************; *****Wundergages*******
02385500; 10131; Rainfall; MILL CREEK AT DALTON, GA
KGAROCKY2; 10132; Rainfall; Rocky Face Ridge, GA
KGATUNNE2; 10133; Rainfall; Mt Vernon, GA
KGADALTO8; 10134; Rainfall; Dalton West, GA
KGADALTO11; 10135; Rainfall; Dalton, GA
KGADALTO7; 10136; Rainfall; Downtown Dalton, GA
KGADALTO19; 10137; Rainfall; Dawnville, GA
KGARINGG10; 10138; Rainfall; Pleasant Valley, GA
************; ************; ************; *****RATIO*******
COMPUTE-hour; 10121; Rainfall; North Avg Rain Gages; 0; 0; (P1+P2+P3+P4+P5)/N
COMPUTE-hour; -10121; Rainfall; North Avg Radars; 0; 0; (P1+P2+P3+P4+P5)/N
Run-COMPUTE-hour; -31121; Ratio; North Avg Ratio; 0; 0.02,1,6; P1/P2
COMPUTE-hour; 10122; Rainfall; South Avg Rain Gages; 0; 0; (P1+P2+P3+P4+P5)/N
COMPUTE-hour; -10122; Rainfall; South Avg Radars; 0; 0; (P1+P2+P3+P4+P5)/N
COMPUTE-hour; -31122; Ratio; South Avg Ratio; 0; 0.02,1,6; P1/P2
************; ************; ************; *****Adjusted Rainfall*******
COMPUTE-unit; -11101; Adj Radar Rain>0.3"-hour; Sub 1; 0; -1,1.0,0.3,1.5; P1*P2
COMPUTE-unit; -11102; Adj Radar Rain; Sub 2; 0; -1,1.0,0.3,1.5; P1*P2
Run-COMPUTE-unit; -11103; Adj Radar Rain; Sub 3; 0; -1,1.0,0.3,1.5; P1*P2
COMPUTE-unit; -11104; Adj Radar Rain; Sub 4; 0; -1,1.0,0.3,1.5; P1*P2
COMPUTE-unit; -11105; Adj Radar Rain; Sub 5; 0; -1,1.0,0.3,1.5; P1*P2
COMPUTE-unit; -11106; Adj Radar Rain; Sub 6; 0; -1,1.0,0.3,1.5; P1*P2
COMPUTE-unit; -11107; Adj Radar Rain; Sub 7; 0; -1,1.0,0.3,1.5; P1*P2
COMPUTE-unit; -11131; Adj Radar Rain; USGS Gage; 0; -1,1.0,0.3,1.5; P1*P2
************; ************; ************; *****Runoff******
Run-COMPUTE-unit; -30101; RUNOFF; Sub 1 Dalton, GA; 0; 0.75, 70, 0.1, 25, 0.781,
0.3, .2, 0.4, 2, 0.1, 7, 90, 60, 0.7, 0.5, 2, 0.3, 0.75, 0.03, 0.8, 0, 0.2, 1,
0.7, -1, Lag0; P1; 0; VillageCreek.DGF
COMPUTE-unit; -30102; RUNOFF; Sub 2 Dalton, GA; 0; 1.416667, 70, 0.1, 15, 3.146,
0.3, .2, 0.4, 2, 0.1, 7, 90, 60, 0.7, 0.5, 2, 0.2, 0.75, 0.03, 0.8, 0, 0.2, 1,
0.7, 0, Lag0; P1; 0; VillageCreek.DGF
COMPUTE-unit; -30103; Runoff; Sub 3 Dalton, GA; 0; 1.0, 60, 0.1, 20, 3.699, 0.3,
.2, 0.4, 2, 0.1, 7, 87, 55, 0.6, 0, 2, 0.1, 1.0, 0.03, 0.8, 0, 0.2, 1, 0.7, 0,
Lag0; P1; 0; VillageCreek.DGF
COMPUTE-unit; -30104; Runoff; Sub 4 Dalton, GA; 1; 2.0, 65, 0.1, 2, 9.423, 0.3,
.2, 0.4, 2, 0.1, 7, 90, 60, 0.6, 0, 2, 0.1, 1.0, 0.03, 1, 0, 0.2, 1, 0.7, 0,
Lag0; P1; 0; VillageCreek.DGF
COMPUTE-unit; -30105; Runoff; Sub 5 Dalton, GA; 0; 6.0, 65, 0.1, 0.1, 4.536,
0.3, .2, 0.4, 2, 0.1, 7, 90, 60, 0.6, 0, 2, 0.1, 1.0, 0.03, 0.8, 0, 0.2, 1, 0.7,
0, Lag0; P1; 0; VillageCreek.DGF
COMPUTE-unit; -30106; Runoff; Sub 6 Dalton, GA; 0; 4.5, 65, 0.1, 0.1, 5.295,
0.3, .2, 0.4, 2, 0.1, 7, 90, 60, 0.6, 0, 2, 0.1, 1.0, 0.03, 0.8, 0, 0.2, 1, 0.7,
0, Lag0; P1; 0; VillageCreek.DGF
COMPUTE-unit; -30107; Runoff; Sub 7 Dalton, GA; 0; 7.25, 65, 0.1, 0.1, 12.88,
0.3, .2, 0.4, 2, 0.1, 7, 90, 60, 0.6, 0, 2, 0.1, 1.0, 0.03, 0.8, 0, 0.2, 1, 0.7,
0, Lag0; P1; 0; VillageCreek.DGF
************; ************; ************; *****Route******
ROUTE-unit; -1104; Flow; Route Haig Mill Dam Out
ROUTE-unit; -1107; Flow; Route Hiawassee Dam Sub 7 Out
ROUTE-unit; -1105; Flow; Route Sub 7 to 5 Combine 7,6,5
ROUTE-unit; -1103; Flow; Route Sub 7,6,5 to 3 And Combine Subs 2&3
ROUTE-unit; -1100; Flow; Route Sub 7,6,5,3.2 to Gage And Combine Sub 4&1
ROUTE-unit; -1106; Flow; Combine 7+6 For Flood Stage above Rocky Face
LOOKUP-Unit; -2106; Stage>-daymax-7ft_action,8ft_minor,10ft_moderate,13ft_major;
S Fork Mill Cr above Rocky Face
LOOKUP-Unit; -2100;
Stage>-daymax-9ft_action,11ft_minor,14ft_moderate,17ft_major; Mill Cr at Dalton
Gage
************; ************; ************; *****Soil Moisture just for
display*****
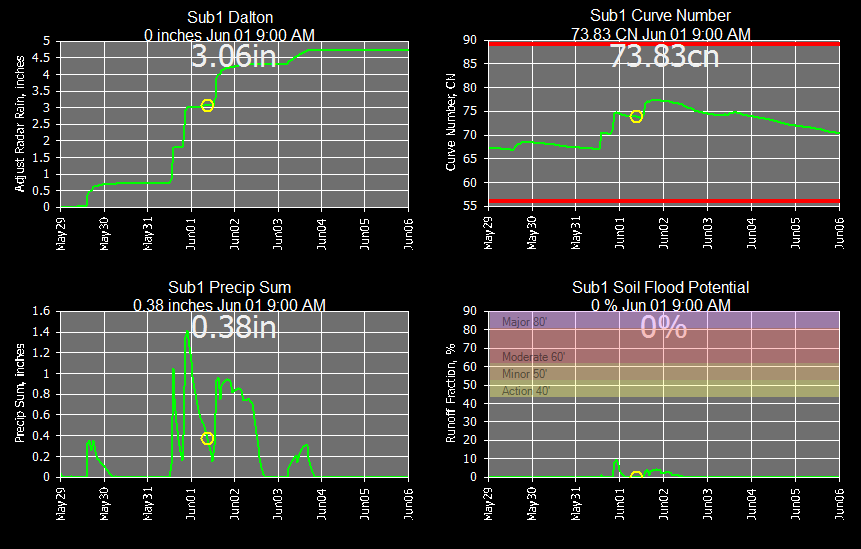
COMPUTE-hour; -6101; Soil Runoff Fraction>40%-hour; Sub1 Soil Flood Potential;
0; 0; 0; P2>0.2*P1; 0; 100*(P2-0.2*P1)^2/(P2+0.8*P1)/P2
COMPUTE-hour; -5101; SCS CN; Sub1 Soil CN; 0; 0; 1000/(P1+10)
************; ************; ************; *****USGS*****
02385500; 1100; Flow; MILL CR AT DALTON, GA
02385500; 2100; Gage Height; MILL CR AT DALTON, GA
************; ************; ************; ****Set
Run Interval based on forecast rain*****
**SET-INTERVAL; -11101; Forcast Rain; Sub 1; +4,rhour;
60; P1>.001; 0; 30; P1>.2
************; ************; ************; ***** Shell for Web Display*****
SHELL-C:\GETPROJECTS\GETDALTON\GETNEXRAD\GetNexrad.exe -2 mypassword; 0; Pic;
Pic of Radar; 0
SHELL-C:\GETPROJECTS\GETDALTON\GETGRAPHS\GetGraphs.exe 4 mypassword; 0; Graphs;
Getgraphs to Web; 0
SHELL-C:\GETPROJECTS\GETDALTON\GETGRAPHS\GetFromAccessNOW.exe rdaymax, 10122
-10122 10131 -10131 -11131 1100 -1100 2100 -2100 -6101, -2, 5, DaltonNOW.txt,
mypassord; 0; Flow Data to Web; Put Flow Data Text File on Web; 0
END
Important Note: Nothing
on this page is intended as interpretation of any legal authority such as water
rights and supply. This page is intended solely as a demonstration of techniques
in flood potential monitoring. The reader assumes all risk for any damages
whatsoever in connection with the access, use, quality, or performance of the
supplied data just so you know.
|