|
This web page demo is being used to refine the
GetRealtime programs to automate dispaly of real-time runoff and forecasts for
dissemination techniques over the web. It is also a collaboration with an
Alabama egineering compay with a long time interest in runoff modeling for this
particular large basin to see if radar can improve runoff and if dimensionless
graphs can handle these big basins with out further complicating subdivisions.
The 1,461 sqmi Tallapoosa River basin at Harris Dam was subdivided into 8
subbasins and is a much different type runoff than I normallly have studied in
that each of these large subbasins have complex drainage systems and runoff
timings. It was quickly found that the good ol' trusty SCS dimensionless
unit graph and even the 3-Triangle unit graph was not even in the ballpark for
dealing with the multiple timings of the stream confluences for these subs.
Not to fear, it was a simple matter to construct new dimensionless unit graphs
for these large basins using the 272 sqmi Tallapoosa at Tallapoosa gage and 94.7 sqmi
Little Tallapoosa at Carrollton gage. These 2 dimensionless graphs
were then used at the other subs having similar hydrograph shapes. Note
the strange shapes of the hydrographs below.
Big Area sqmi: 1465
Sub1=272
Sub2=94.7
Sub3=178
Sub4=150
Sub5=162
Sub6=195
Sub7=348
Sub8=61.3
sum=1461 sqmi
Subbasin numbers:
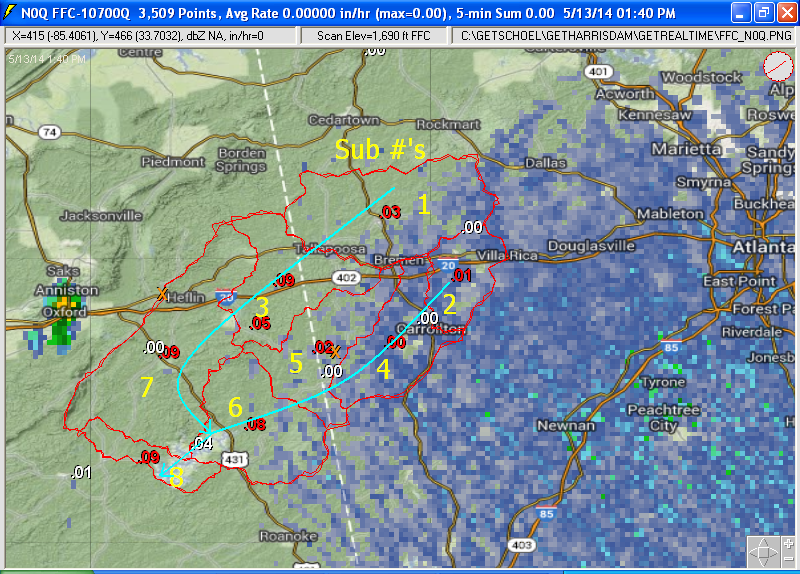
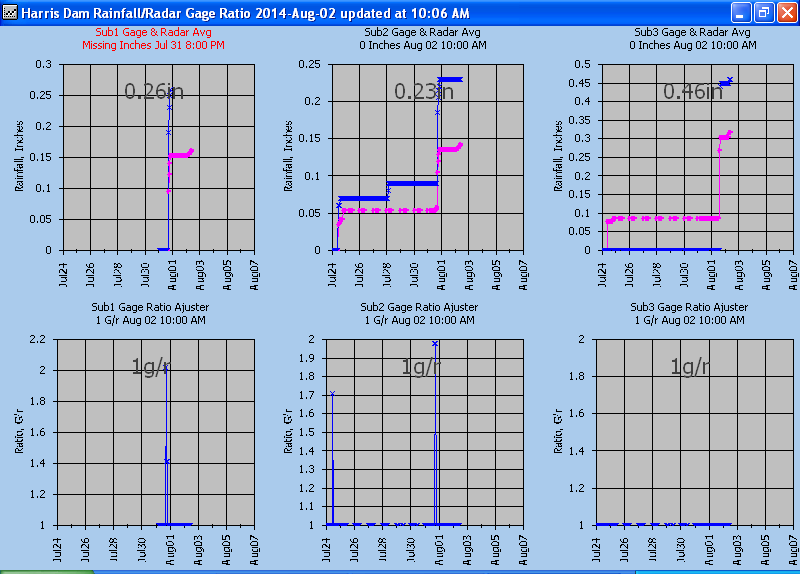
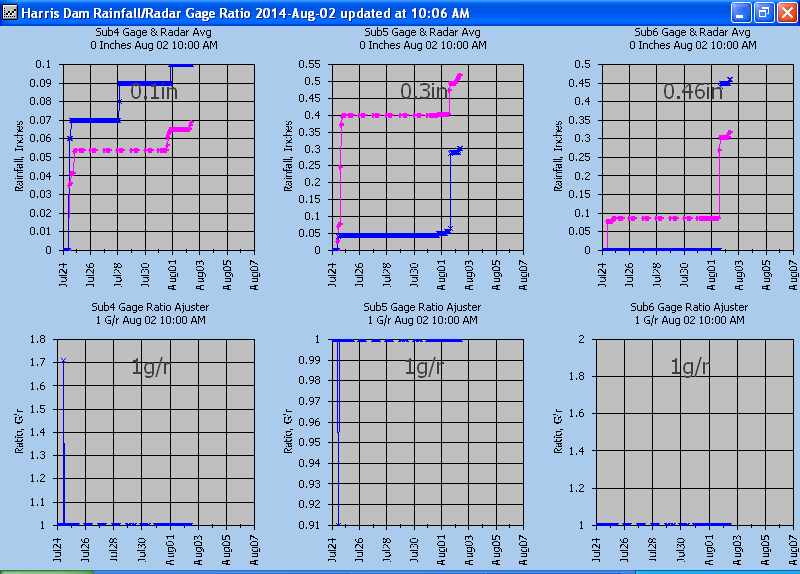
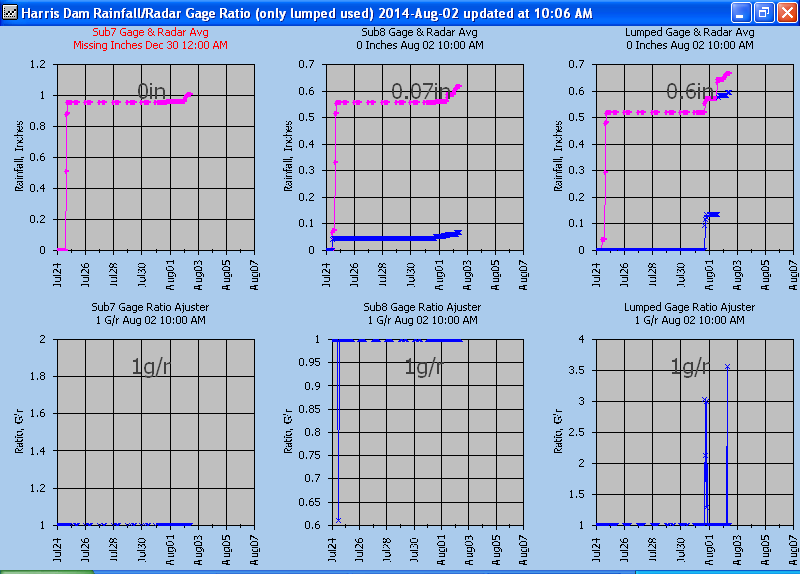
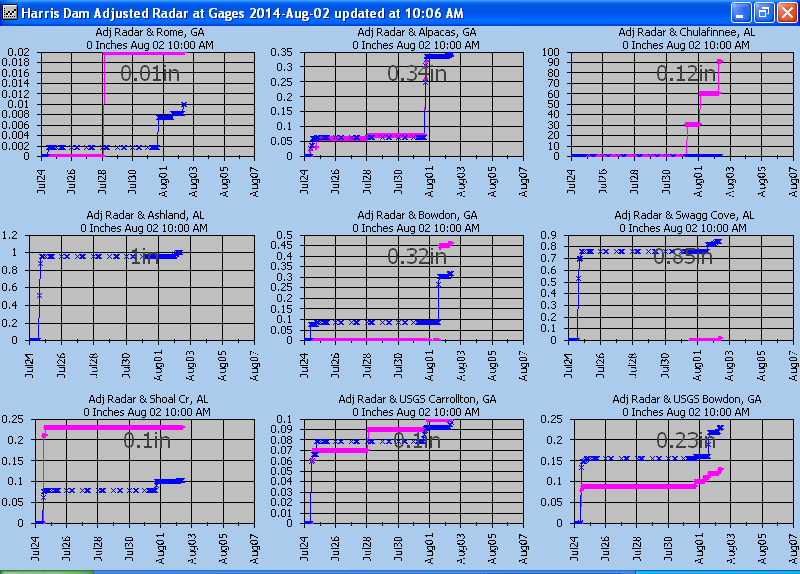
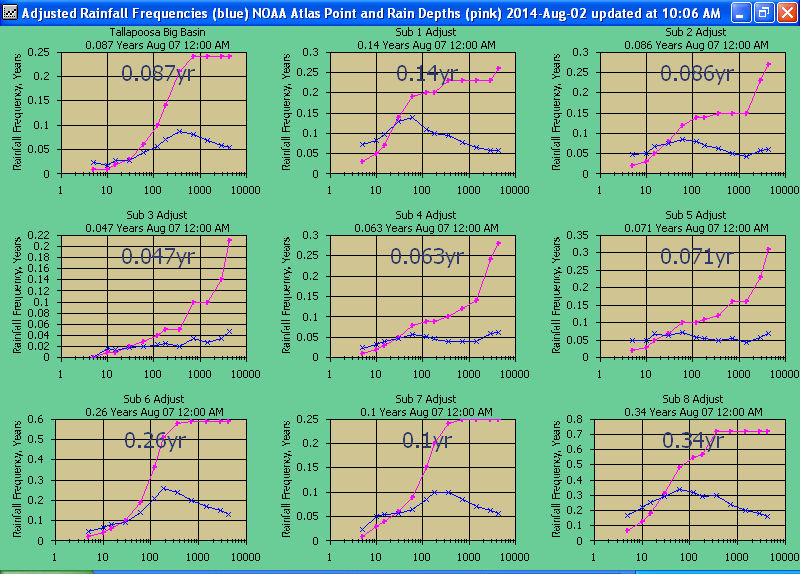
There are currently
7 real-time Wunderground rain gages and 2 USGS rain gages
that can be up to 1 hour in arrears (7+2=9 rain gages). The USGS gages are
excellant and the Wundergages as usual can be hit and miss. The current unused
rain gages that are operator (that's me using the GetGraphs display)
interactively turned off are displayed with a yellow background below. The 1-km
5-minute N0Q reflectivity was converted to rainfall at the gages, the Gavg/Ravg
hourly ratio was applied to the subs averaged radar rainfall. Typically
the 2 or 3 nearest raingages are used to ratio each sub's radar rainfall.
This study probably has as much a bad rain gage problem as the complications of using
very large sub sizes... so the web automation is emphasized here but I'm not
giving up on these large subs yet. And of course GetRealtime can replace
the model routings at the USGS gages with the latest gaged flow for further
routing but that is not what we need to tame these beasts.
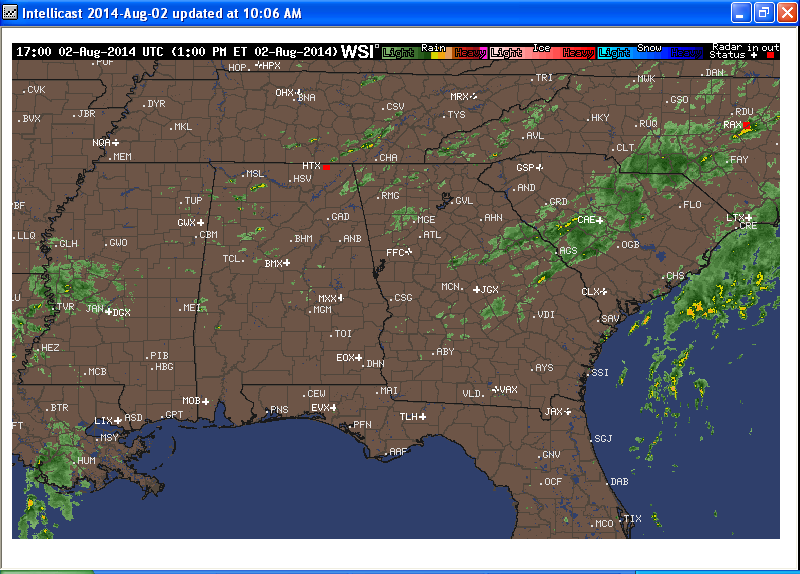
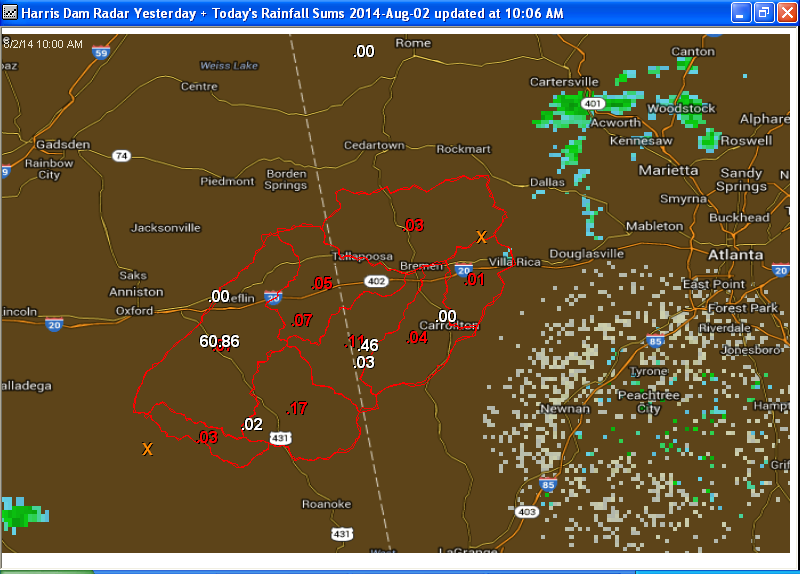
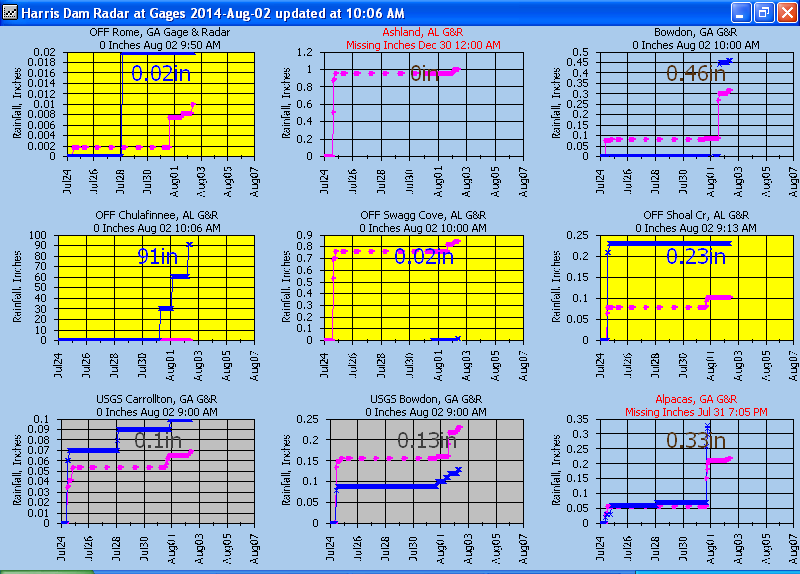
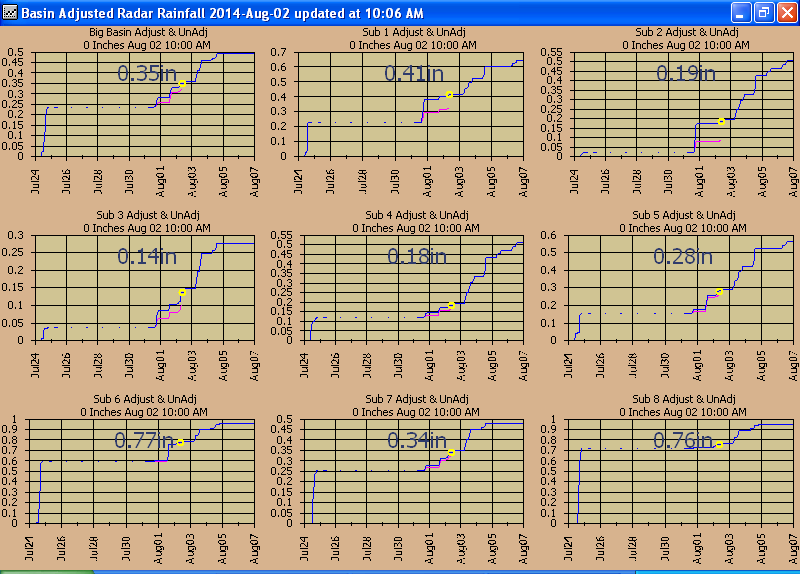
AUTOMATED RUNOFF DISPLAY
The following pics are updated automatically when ever GetRealtime runs.
During periods of no rainfall, for this test GetRealtime creates the pics when I
run it, probably daily. When it looks like rain I will start it at every 30 minutes or so
to see how things work. Note all times are my Pacific Time.
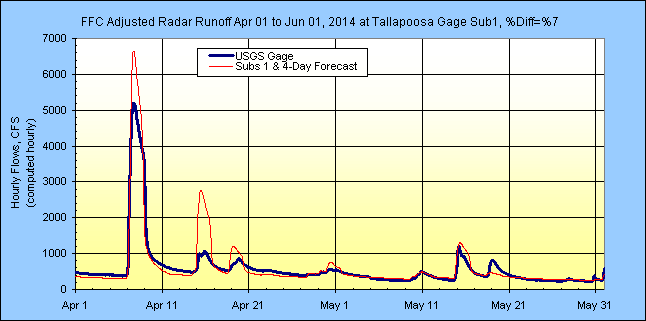
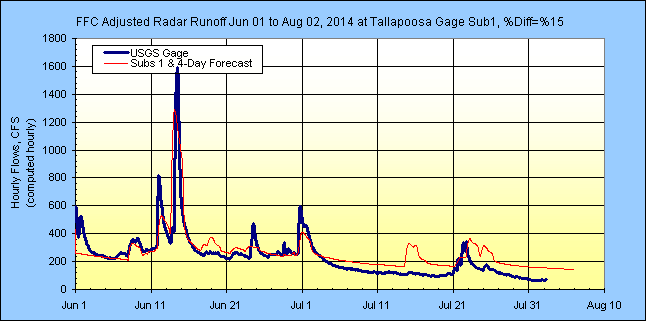
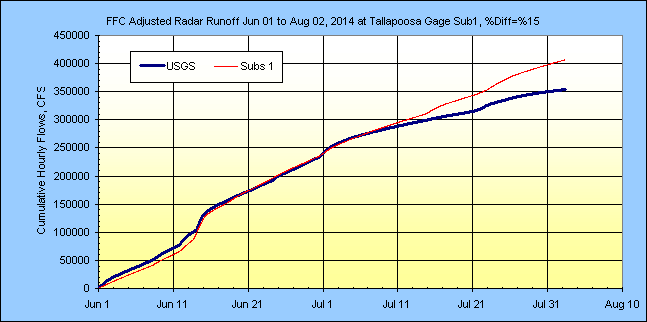
LONGER TERM HYDROGRAPHS UPDATED DAILY
The folowing pics from Excel linked to the GetAccess database show how well or
not so well our very large subs are doing runoff wise. More or better rain
gages couldn't hurt here. I will let these soils get acclimated before further
runoff refining. There are 5 USGS stream gages in this basin to work with so
this aint over yet. The runoff seems to be improving as the soil moisture gets
up to speed and recovery factors were increased from 0.05 (sandy clay) to 0.17
(silt loam) steepening
the recessions beginning June 1, 2014.
Looking at the subs runoff below, this basin's runoff modeling if done for
real-time operations could use some user input from time to time to get things
back on track. From what I have read of Army COE's operator's runoff input at
their larger basins, they would adjust the soil moisture to produce the observed
runoff. I believe the NWS does soil moisture adjust too. I'm thinking that rainfall
being the weakest link here, you could adjust the recent rainfall to produce the
observed peaking (or base flow?) and that would automatically get both soil
moisture and groundwater flow back in shape. Something to think about and
perhaps try in the future here. The flow point of real interest here is
inflow to Harris Dam reservoir for release scheduling so event inflow volume is
very important.
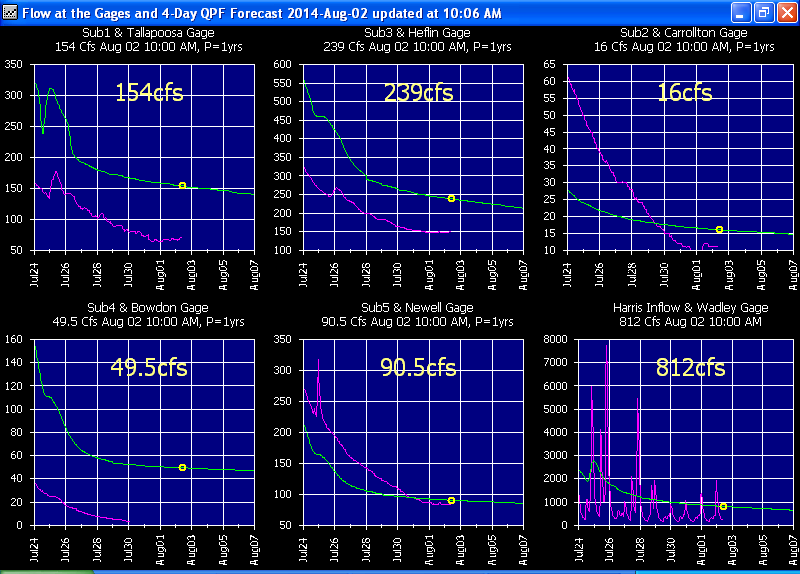
Tallapoosa Fork
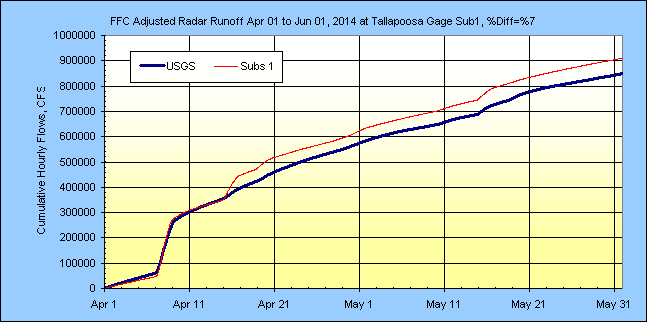
Subs 1 at USGS Tallapoosa Gage:
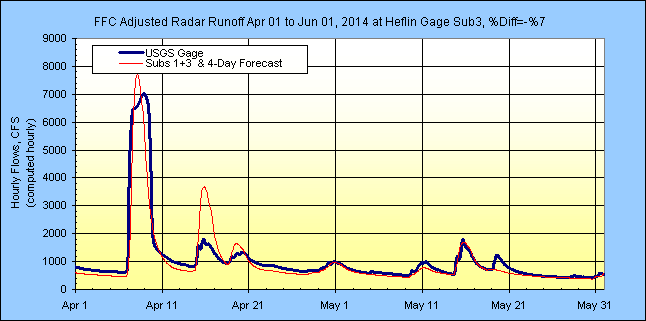
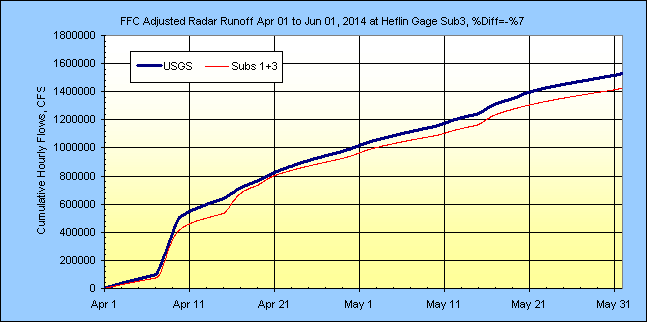
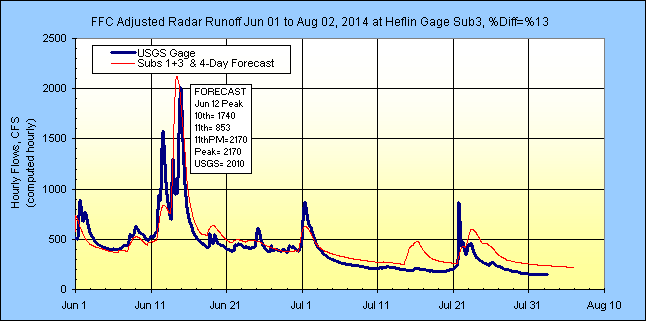
Subs 1 & 3 routed and combined at USGS Heflin Gage:
Little Tallapoosa Fork
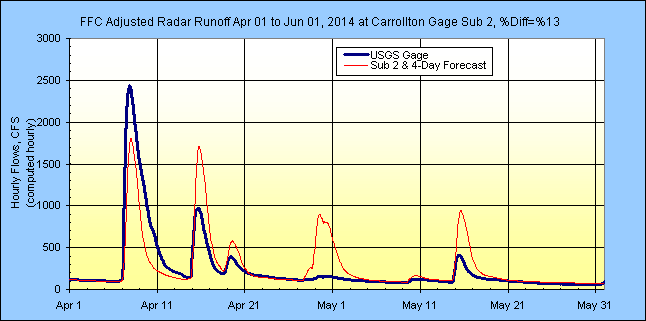
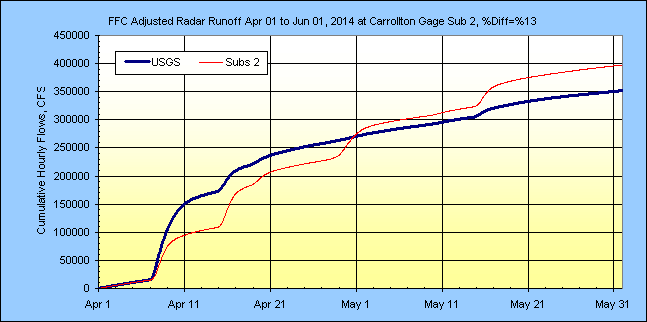
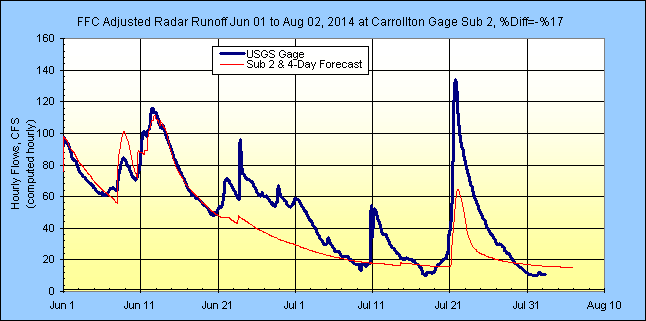
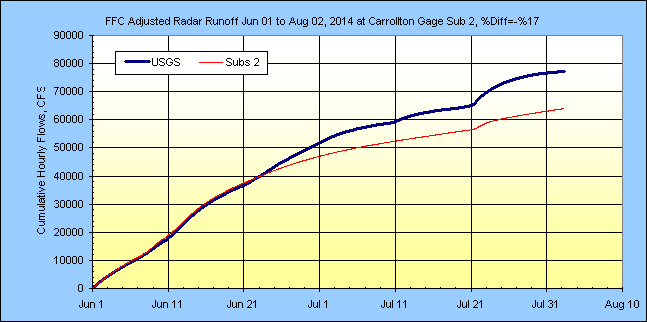
Subs 2 at USGS Carrollton Gage:
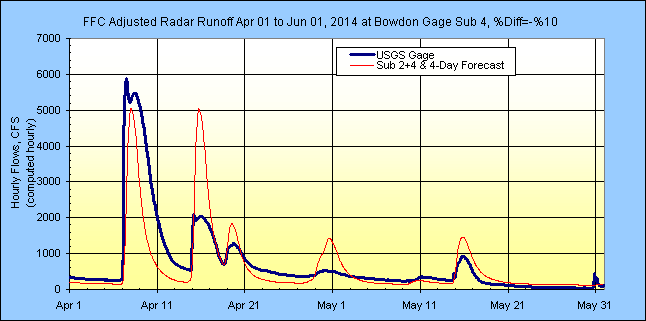
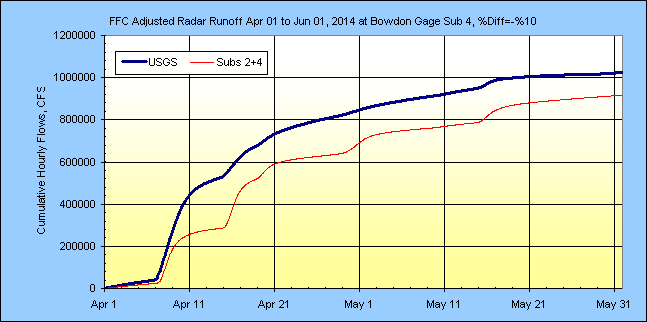
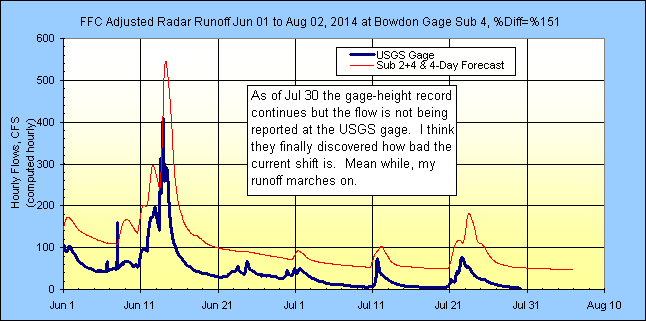
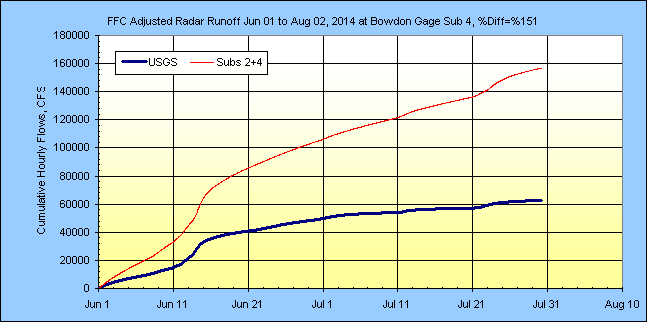
Subs 2 & 4 at USGS Bowdon Gage:
The USGS Bowdon gage seems to have been put on a fewer measurements schedule for
thrift and the measurement 2014-05-16 seems way out of line with history and I
have ignored it here. The downstream gage Newell seems to confirm the bad shift
at this Bowdon gage. Did I ever tell you about the time I worked for the USGS
and all we had were adding machines... and beer was 99cents a 6-pack (Brown
Derby).
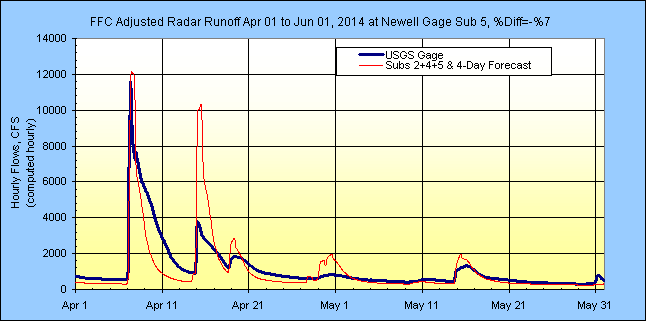
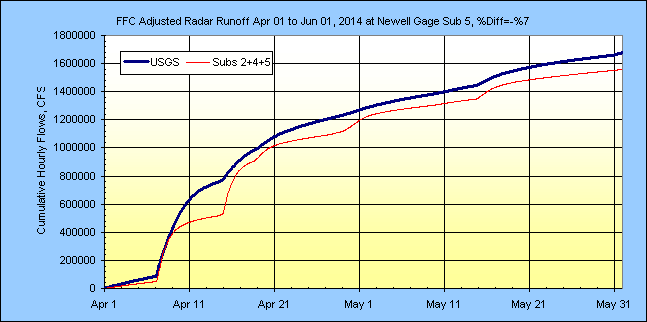
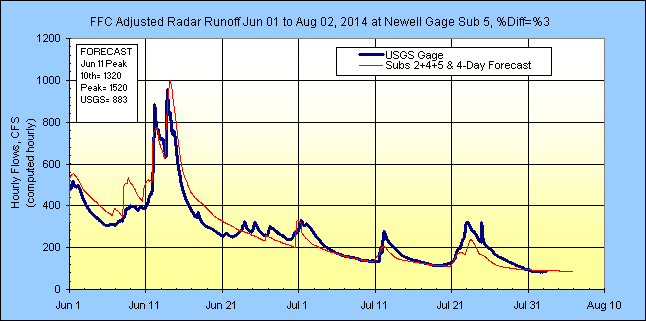
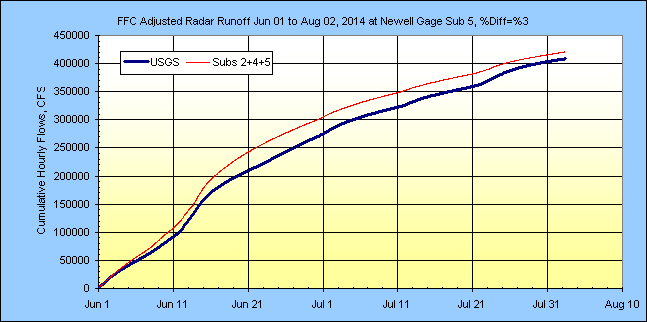
Subs 2, 4 & 5 routed and combined at USGS Newell Gage:
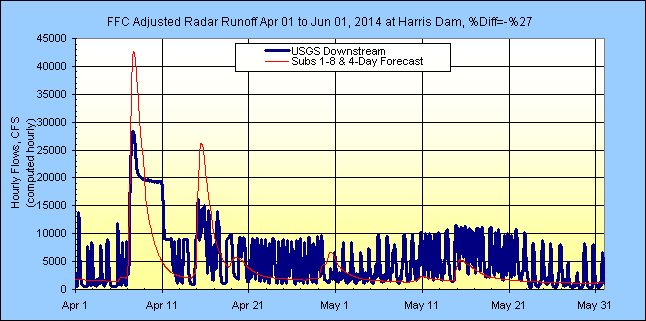
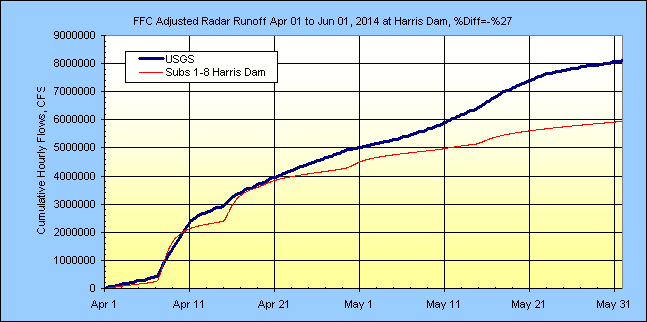
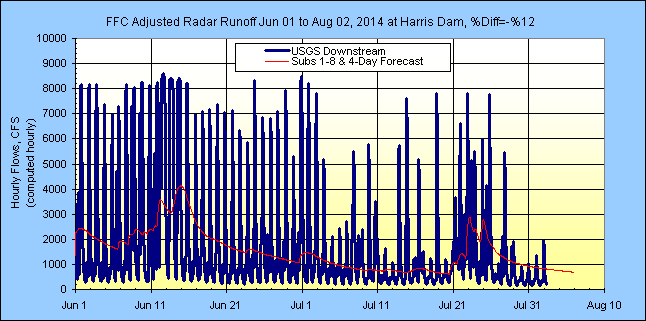
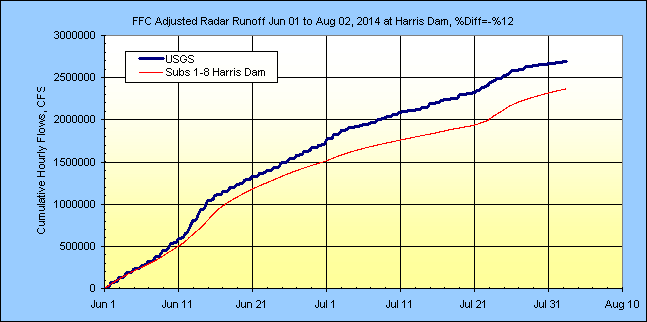
Subs 1-8 routed and combined as inflow to
Harris Dam and compared with way downstream 1675 sqmi USGS Wadley Gage with
side inflow ignored. Based on basin areas, the flow volume at the Wadley
Gage should be 1675/1461 or 15% greater than that at Harris Dam:
Soil Moisture as SCS Curve Number:
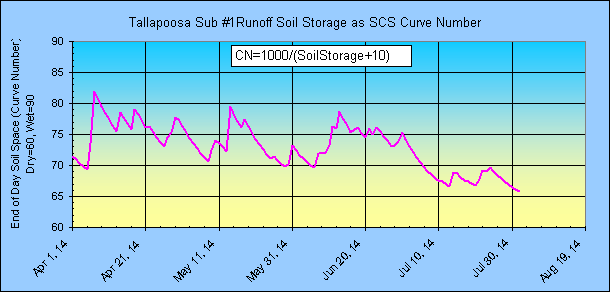
Hmmm.... the CN above has broken to the downside of 70 in July. If we need
to increase runoff we could raise the CNdry to 65 or even 70 with out much
effect on earlier peaks. Note how I started at CN 71 to get the first
peaks and is starting to get rethunk on CNdry. I'm no expert yet either.
My current CN range of 60-90 is from what I have read about and have
incorporated into GetRealtime's auto settings given a normal CN. And
remember, the weakest link in all this is rainfall and is probably the real
problem as I have seen time and time again so this may take months to play out.
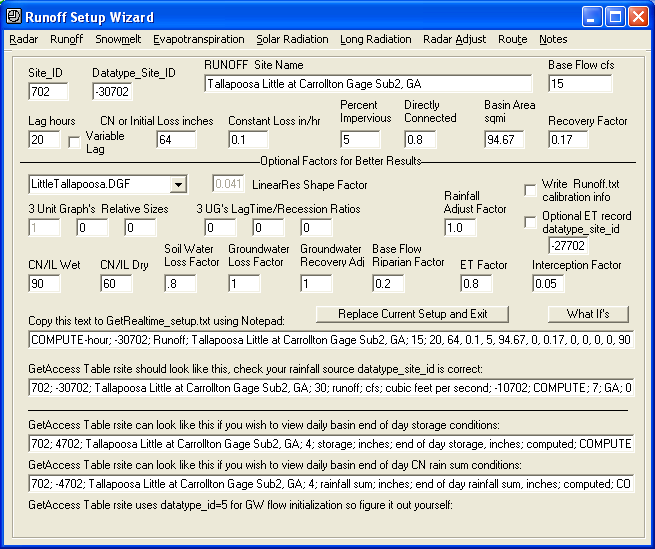
EXAMPLE SETUP:
|
|