|
This is a study to
see if ... a dimensionless unit graph would handle both low and high flows... it
won't.

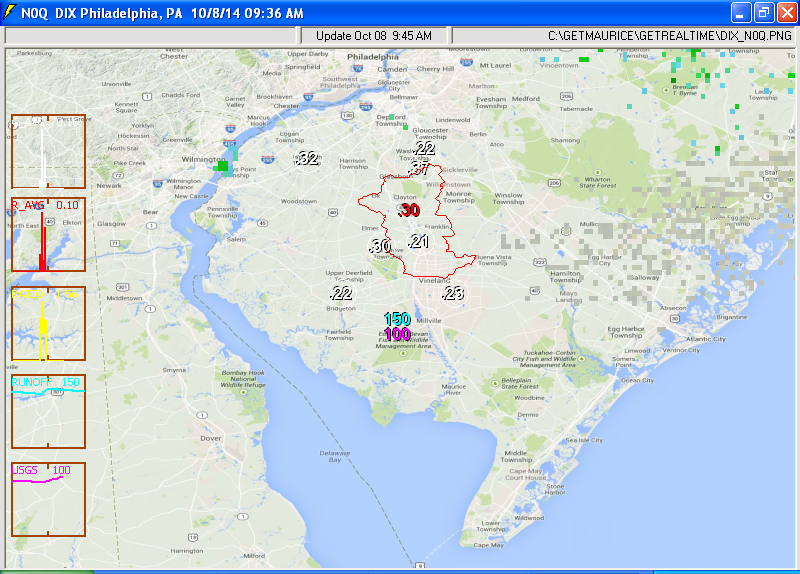
NOAA N0R radar lite gif loop above.
Below is my GetNexrad N0Q radar area 42 miles southwest of the DIX radar,
Wundergages (white) and adjusted N0Q radar with forecast (red).
Automated graphs and radar updated when raining:
Gages in the Maurice River Basin area:
01411500; 1101; Flow; USGS Maurice River at Norma NJ
KNJFRANK9; 10201; Rainfall; Malaga, NJ
KNJPITTS1; 10202; Rainfall; Buck Rd, NJ
KNJSWEDE6; 10203; Rainfall; Chestnut Hill, NJ
KNJSEWEL8; 10204; Rainfall; Washington, NJ
KNJVINEL7; 10205; Rainfall; Vineland, NJ
KNJBRIDG5; 10206; Rainfall; Upper Deerfield, NJ
KNJBLACK2; 10207; Rainfall; Turnersville, NJ
GetGraphs
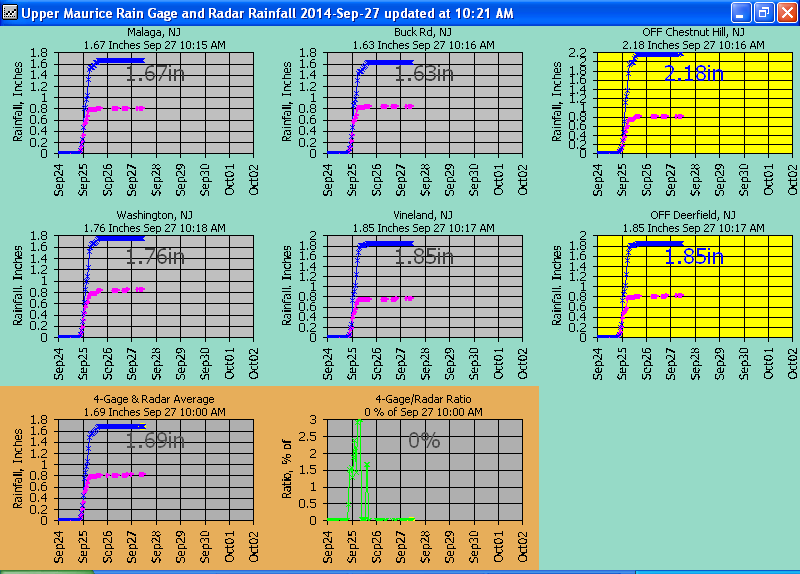
Current Gage Rainfall and Radar
(pink) used for adjustments (Yellow graphs are turned OFF):
GetGraphs
Current Gage Rainfall and Adjusted Radar
(pink) at Gage:
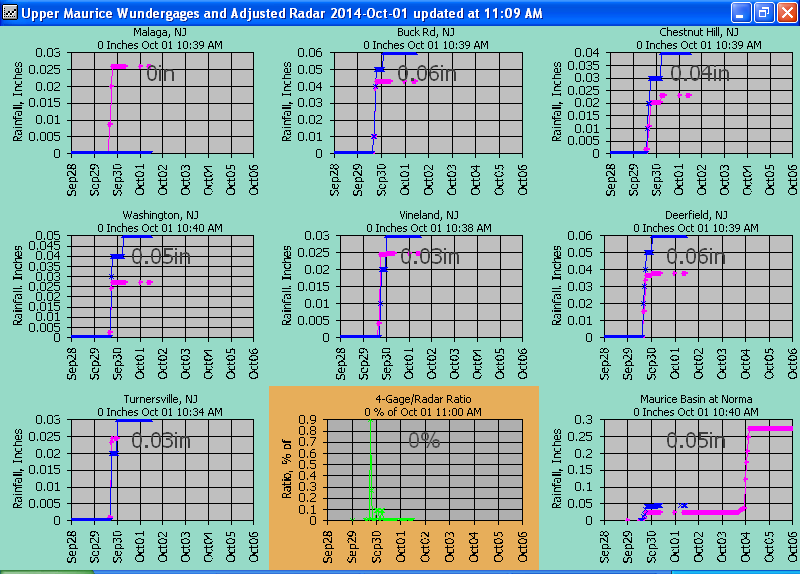
GetGraphs
Current Ratio Adjustment and Adjusted Rainfall and Raw Radar (pink):
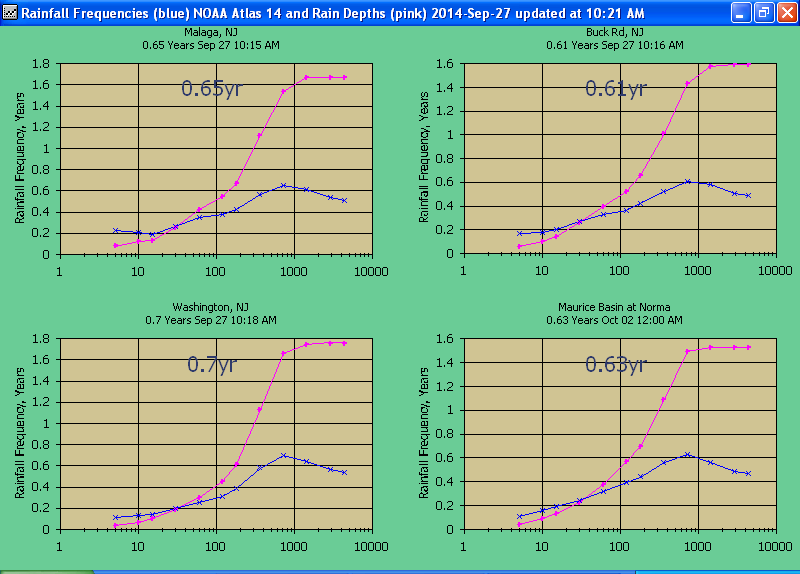
GetGraphs Subbasin Adjusted Radar Rainfall Frequencies
(blue) and Rain Depths (pink), Xscale in Minutes:
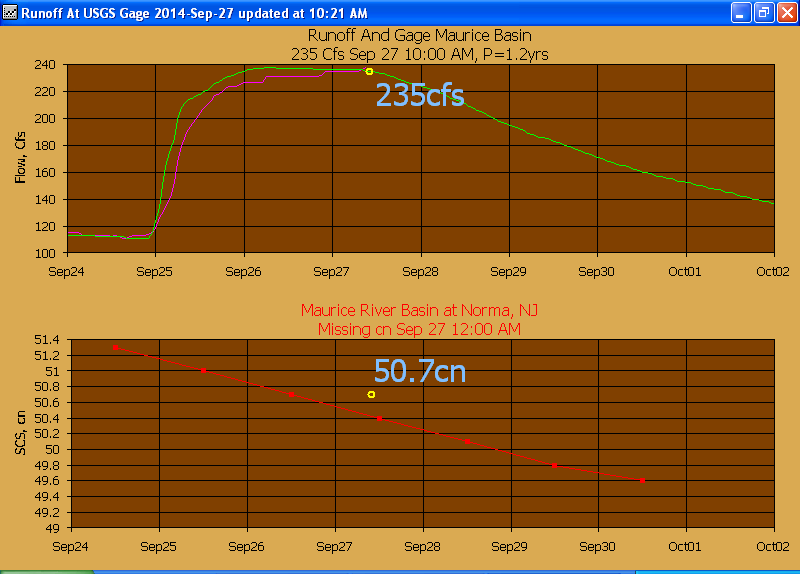
Long term hourly runoff and soil storage updated daily:
Months 1 & 2:
Soil storage
end of day curve number for the basin:
***********
EARLY RESULTS ********************
This is just a first go to get things started.
My first take is it looks like a
groundwater return study and I should add more groundwater return ( I added gw
lag and routing to my GetRealtime model but no help). It may also be
an unregulated ponds and reservoirs that could be modeld as groundwater, but so
far it's strictly soil moisture returns that work the best. An iterative
GW return and dimensionless graph may be the asnwer but I aint going to do it.
And very unusual peak runoff conditions... nearly none unless you get a
hurricane.
***********************************************
Background hydrology and runoff setups:
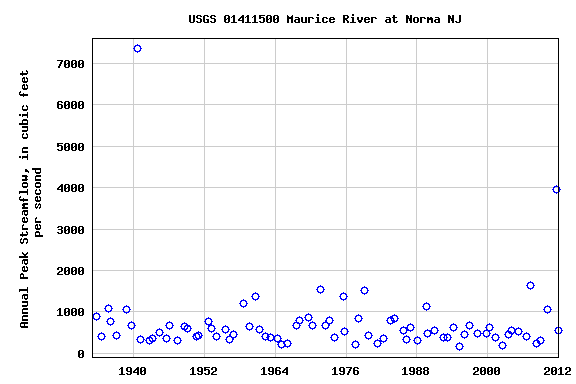
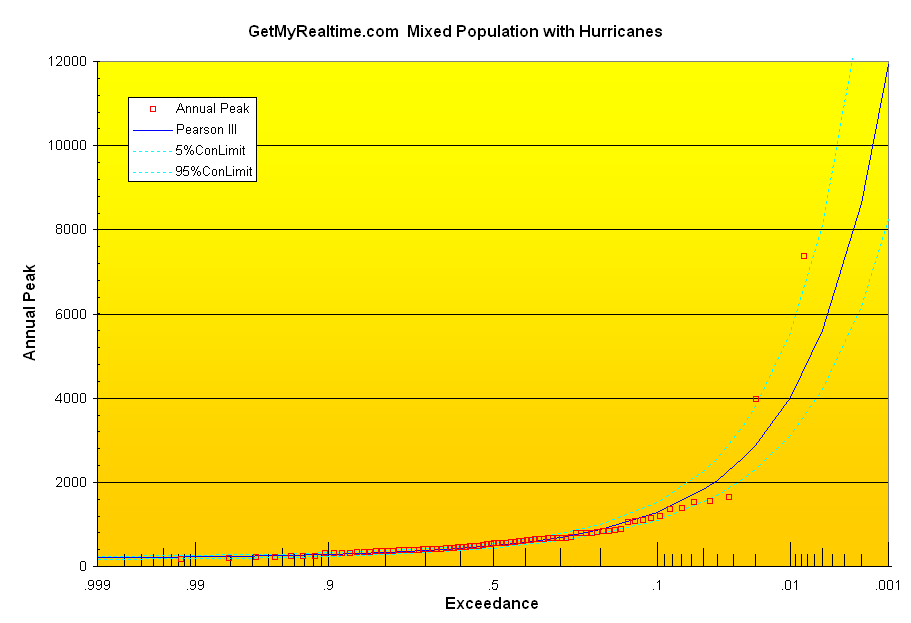
Annual peak flows at the USGS gage show
there is not much to write home about unless there's a hurricane.
Maurice River a Nomra annul flow Pearson III log stats: Mean=2.746;
StdDev=0.2706; Skew=1.223 used in GetGraphs P=X yrs above:
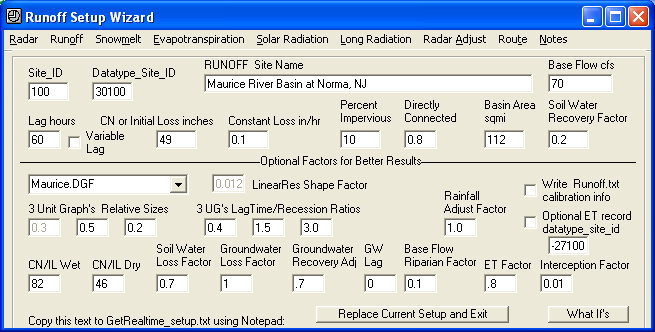
GetRealtime's setup wizard:
Hurricane Irene Aug 27-28, 2011 Peak=3960 cfs at Norma, NJ
Wunderground
Gages:
KNJBRIDG5; 10206; Rainfall; Upper Deerfield, NJ
KNJBLACK2; 10207; Rainfall; Turnersville, NJ
I used the average of the 2 Wundergages except for hourly adjusted radar on Aug
14 and Hurricane Irene of Aug 27-28 (KDIX was down so KDOX used). Looks
like I need to reduce the volume a alot by adding adjusted radar on some other
days also. The SCS dimensionless unit graph would be a better choice for
these large peaks so keep that in mind when the next hurricane comes in another
100 years. And when downloading historical events as KMZ with the NOAA
Weather Toolkit , always make sure your radar plots over the cone of silence
(always reset zoom before loading with GetNexrad).
I should try starting with the SCS dgf runoff as inflow to a reservoir routing
and use the USGS as the outflow to construct a ModPul rating: S2-S1=
t*(I1+I2-O1-O2)/2
More runoff to come....
|