|
|
Hurricanes:
https://www.nhc.noaa.gov/?epac

WMIID and IID Automated GetAccess Database (Pacific Time):
Daily Max and Avg Routed Storm Side Inflow at Cibola Gage And Imperial Dam:
$Free$ Windows software for producing
real-time quantitave info-graphics for making adjustments to your 7-day water
orders. Such things as 7-day forecasts of rain, temperature, cloud cover,
evapotranspiration, reservoir space, canal capacities, snowpack, and spring
runoff are presented. I'm not an experienced farmer but I would think knowing
the future might be helpful so here are some of my ideas, if not just
interesting info.
$FREE$ real-time data sources for this study:
NWS -- weather forecasts, flood forecasts, Nexrad radar.
USGS -- flows, reservoirs & rainfall.
Wunderground and MesoWest -- rain & weather.
USBR -- reservoirs.
SCS -- mountain snowpack and precip.
Calculations performed and stored for this study(MS Access DB):
Gage Adjusted Radar Rainfall Over the Ag Districts.
Desert Area Gage Adjusted Radar Rainfall.
Desert
Rainfall-Runoff-Routings.
ASCE Penman-Monteith Evapotraspiration.
Canal Water Order Adjustment.
Rainfall Frequencies and Depth Durations.
Peak Flow Annual Exceedance.
Upper Colorado and Gila Basin Snowpack & Inflow Forecasts.
Automated Hec-RAS Unsteady Flow Routing.
The automated
web uploads can be left running and making updates every hour or can
be run when you think about it. I'll be updating this web page each day (or more
if it rains) probably for a year and then it will be up to you to download the
free software and continue on. It's pretty exciting to watch your points and
boundarys light up the first time you see radar rainfall headed across your area
racking up the $FREE$ rainfall in real-time.
Two ag districts were selected at the end of the Colorado River; Wellton-Mohawk
IDD, AZ and Imperial ID, CA. Besides gage adjusted radar rainfall over the
district, Welton includes desert basin storm runoff below the Dateland Gage.
Rainfall runoff side inflows below Palo Verde Dam are also routed to Imperial
Dam for more water saving operations. The Hec-RAS river routing projects
were developed by the USBR (Kevin F.) in 2004 and I have just added the desert
side inflows and automated it's running and results.
One could take what I have here and add other automated sources of info I'm not
familiar with. You might talk to your ag district about automating their website
with these $FREE$ graphics. All it takes is an old laptop
running in the corner or for the ambitious run it on a Microsoft Cloud virtual
machine. It takes about 30 seconds of PC time to automatically update and post
the graphs on your web page like I'm doing here. The problem with using your
work PC is you don't want graphs popping up on your screen every hour while you
are trying to work on something else, hence the old laptop in the corner.
But you don't need to include the graphics to keep the info current so your work
PC will do fine like I do here.
GetRealTime = 5 Components
Video
overview of GetRealtime Thanks John!
http://getmyrealtime.com/SiteMap.aspx
1) GetRealTime.exe - reads and stores data in MS Access DB;
pulls data from other networkds, makes calculations, adjusts radar, runs flow
models, and forecasts rain events and flows.
2) GetAccess.exe - frontend to the DB; useful for exporting and
viewing data but DB is accessible and tables can be viewed and queried directly.
3) GetGraphs.exe - links to DB and websites; allows the viewing
of up to 12 charts per view.
4) GetNexrad.exe - view radar images and loops, surface obs,
flood forecasts, QPF rings, storm tracks, ETA, and more.
5) GetMapArea.exe - used to georeference radar watershed
boundaries and run quick flow model what ifs and rainfall scenarios.
Note: All times are for my computer's Pacific Time
Zone and an AZ time shift will be made each Spring and Fall for daylight
saving shenanigans.
Automated Hec-RAS Desert Rainfall Runoff Inflow Routing
to Imperial Dam
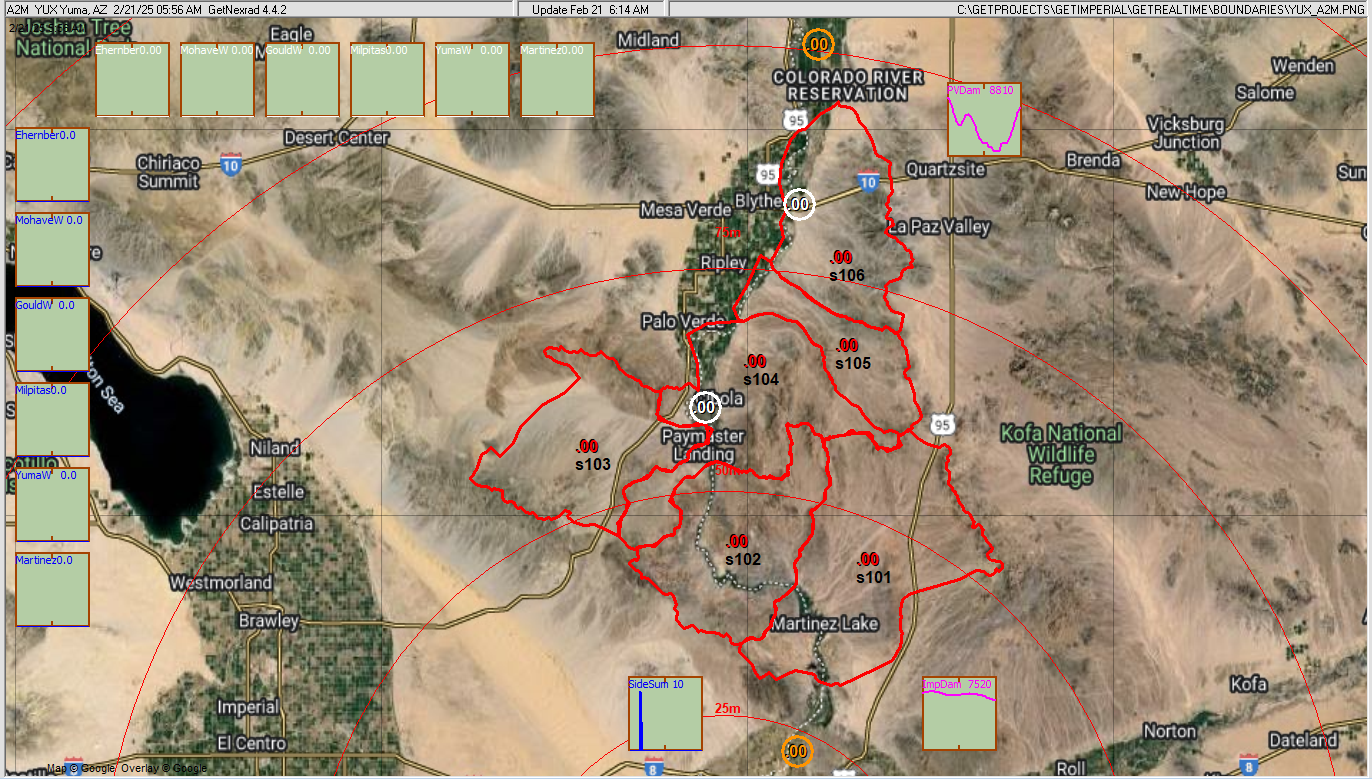
GetNexrad NCQ Composite Radar with 6 Desert Runoff Subbasins, Plots are
Yesterday and Today Rainfall & Flows:
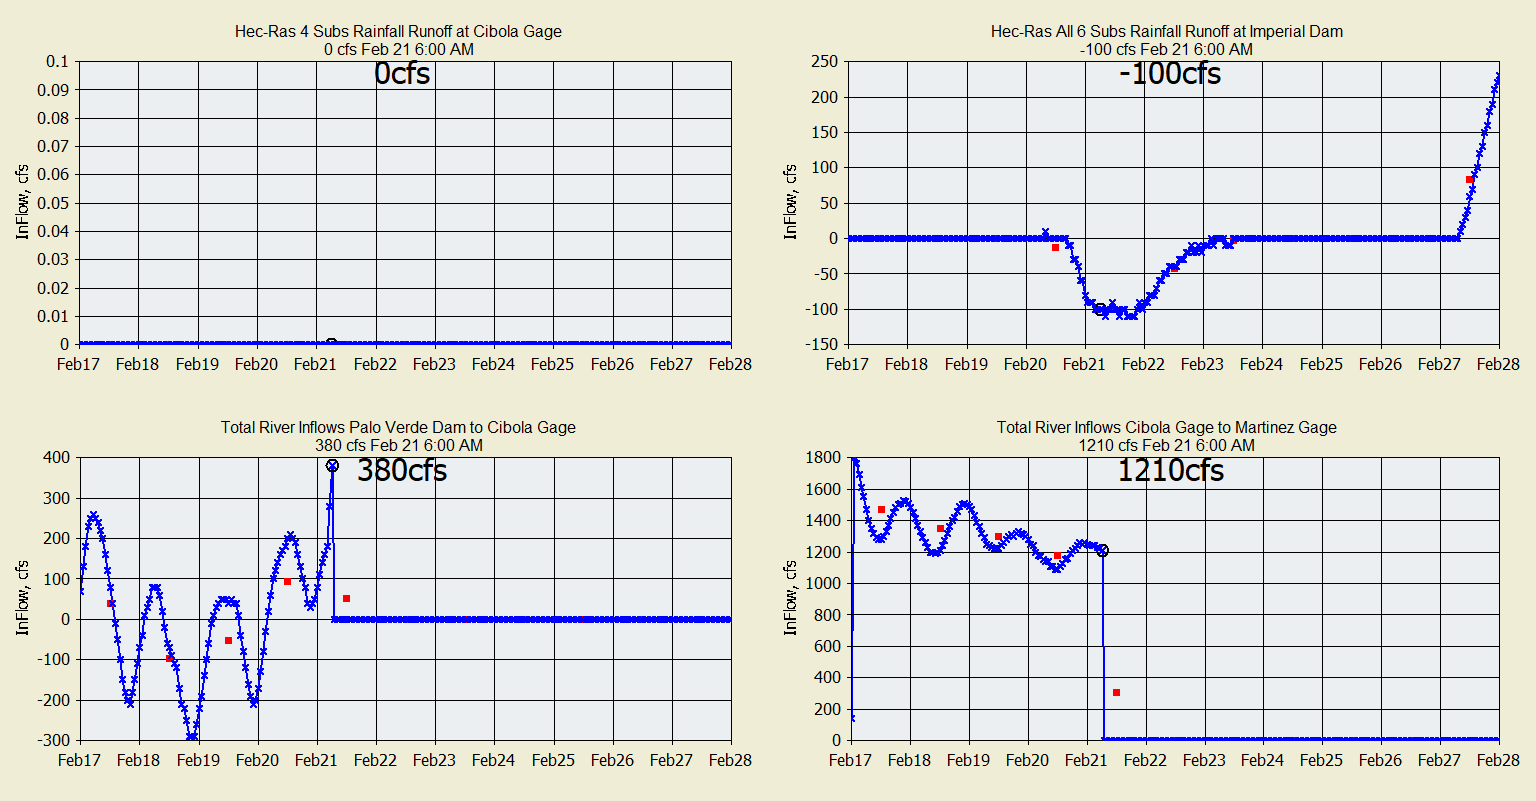
GetRealtime (GRT) 6-Day Forecast of Desert Storm Inlfows Routed to
Imperial Dam (2nd named parameter is pink):
Hec-RAS is used to route the river gaged flow with and without side inflows and
then subtract the two to give the total routed side inflows at the downstream
points.
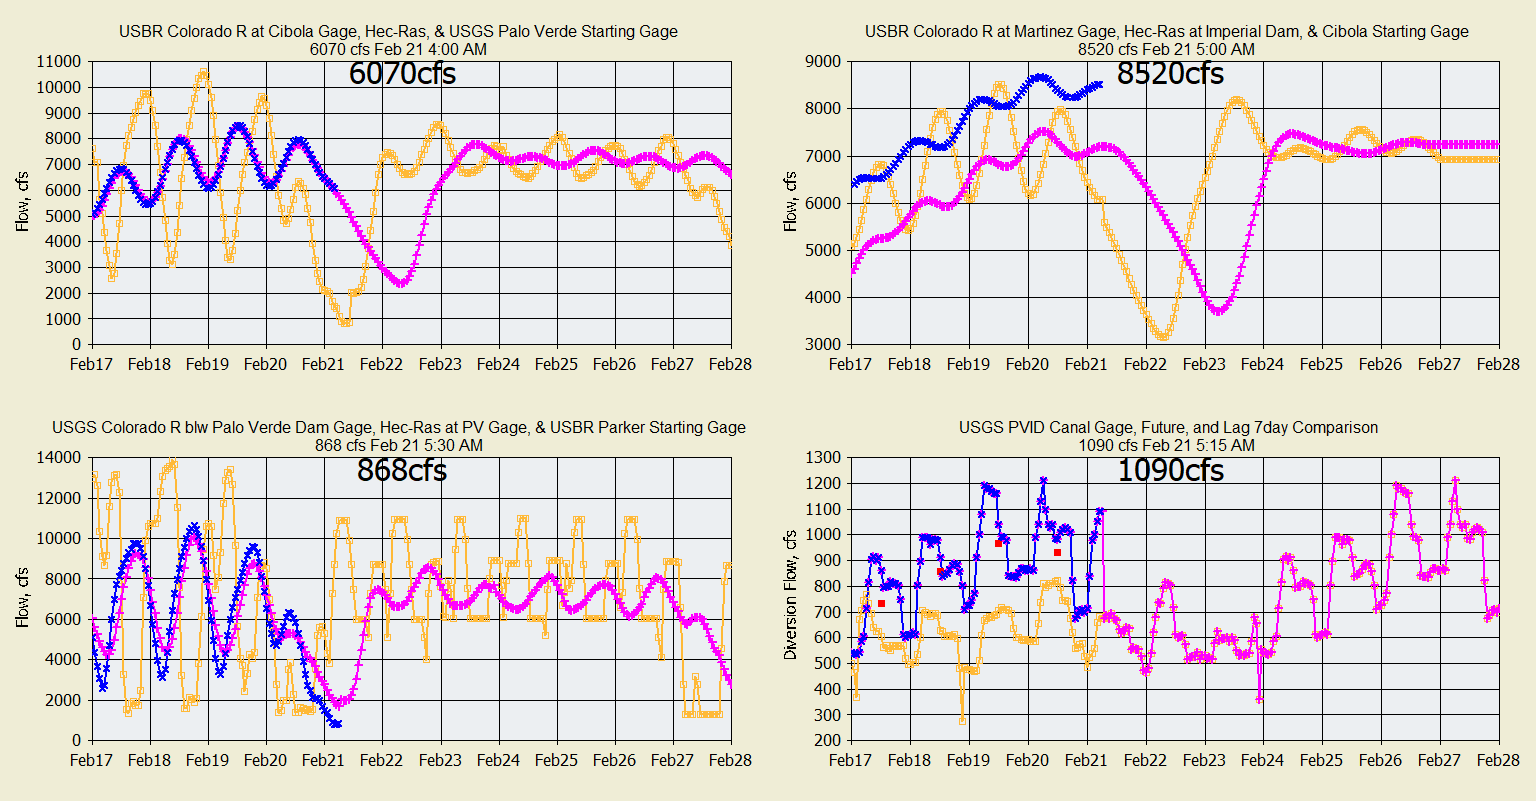
Colorado River Gages and Hec-Ras Routed Flows:
The Palo Verde Dam reach travel time is about 1 day but Hec-Ras travel
times wouldn't line up. Adjusting Ras Mannings roughness made little difference
in travel time but some attenuation which scratches my head. So GRT fixed it by
advancing the Palo Verde gage input by 3 hours .
And differs with flow change probably due to x-secs lacking side storage
effects. I tested lateral storage areas but they DECREASED travel times. The gage and routed differences being the gains graphed above. It's
an art, not a science. Parker Gage below includes Headgate Rock Dam sheduled
generation and bypass releases. Palo Verde Diversion future is a 7 day lag
of the USGS gage. 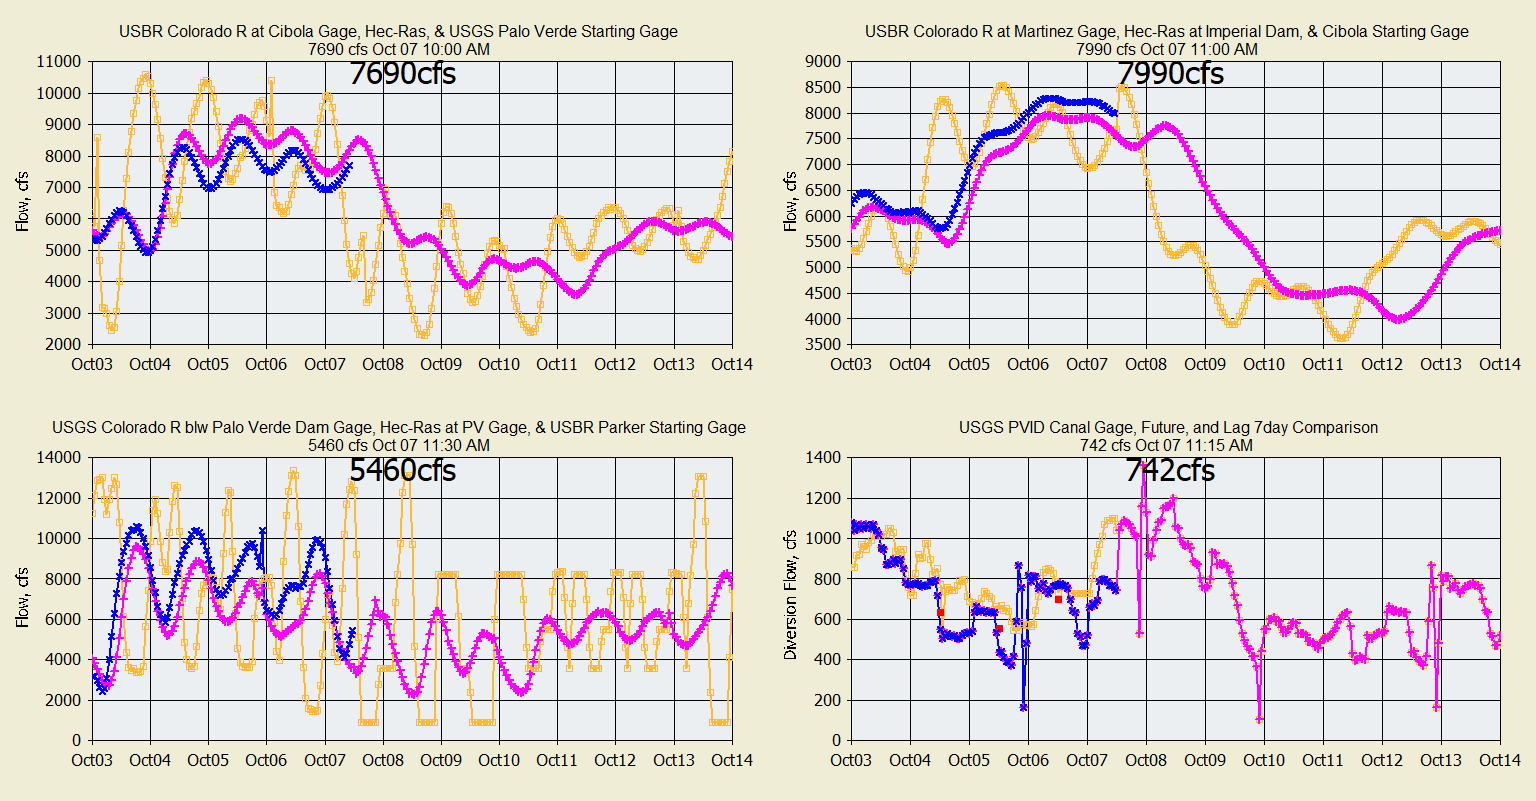
Rain Gages & GRT Raw Radar with Adjusted Radar with NWS Forecast of Rainfall:
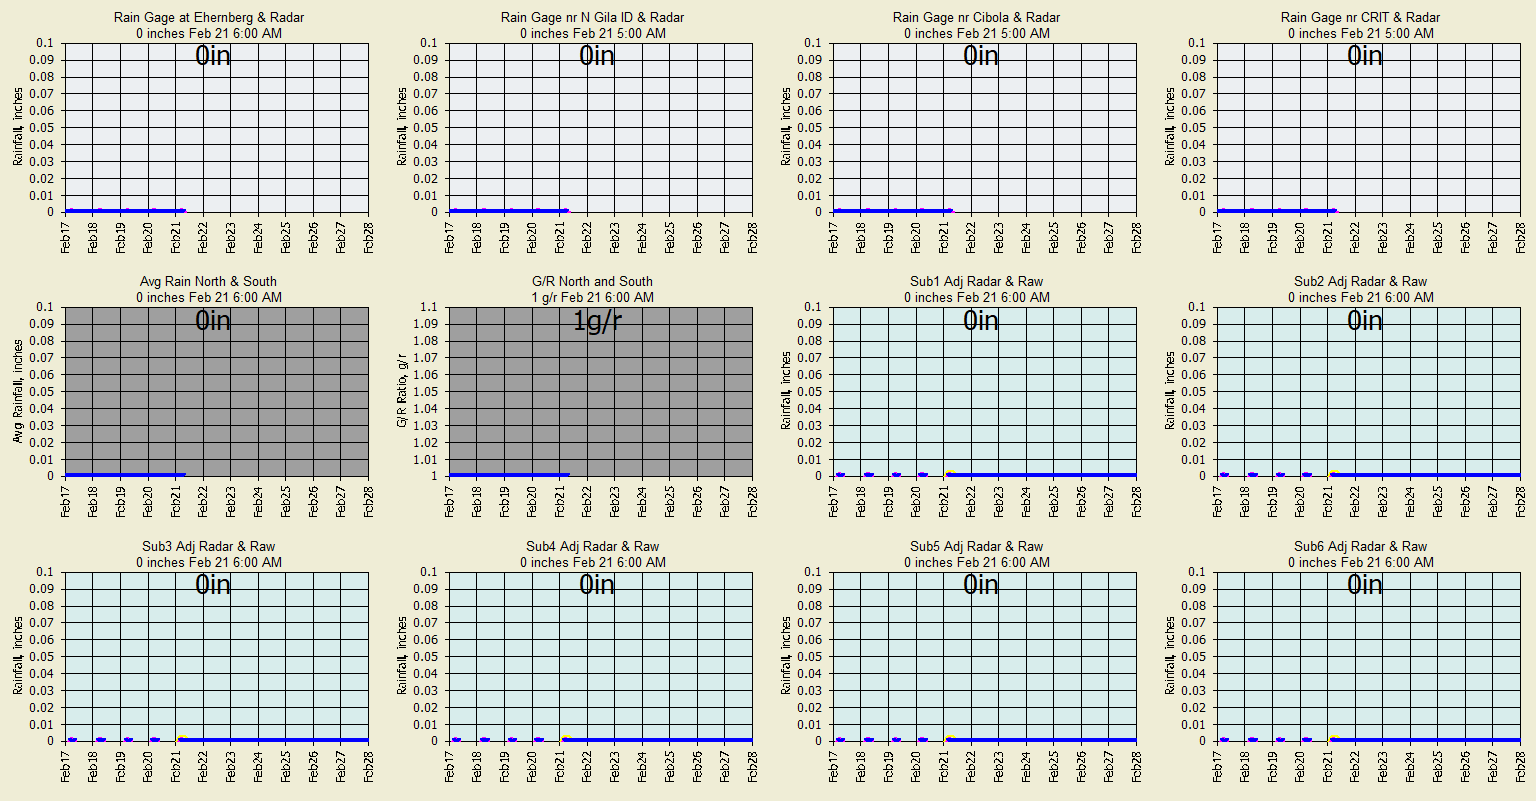
Rain Gages & GRT Raw Radar with Adjusted Radar with NWS Forecast of Rainfall:
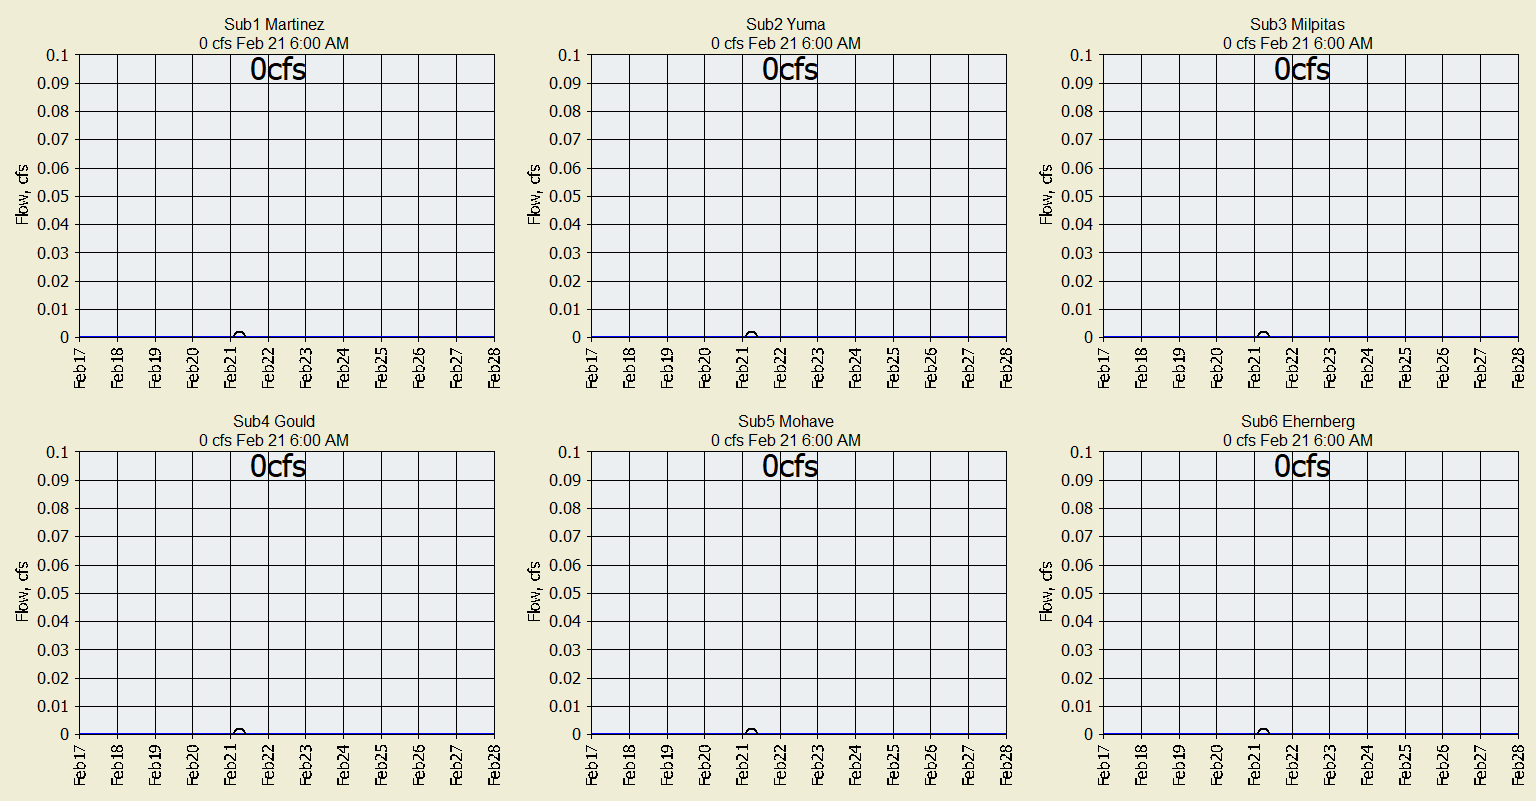
GetRealtime (GRT) 6-Day Forecast of Storm Runoff from the 6 Desert
Subbasins:
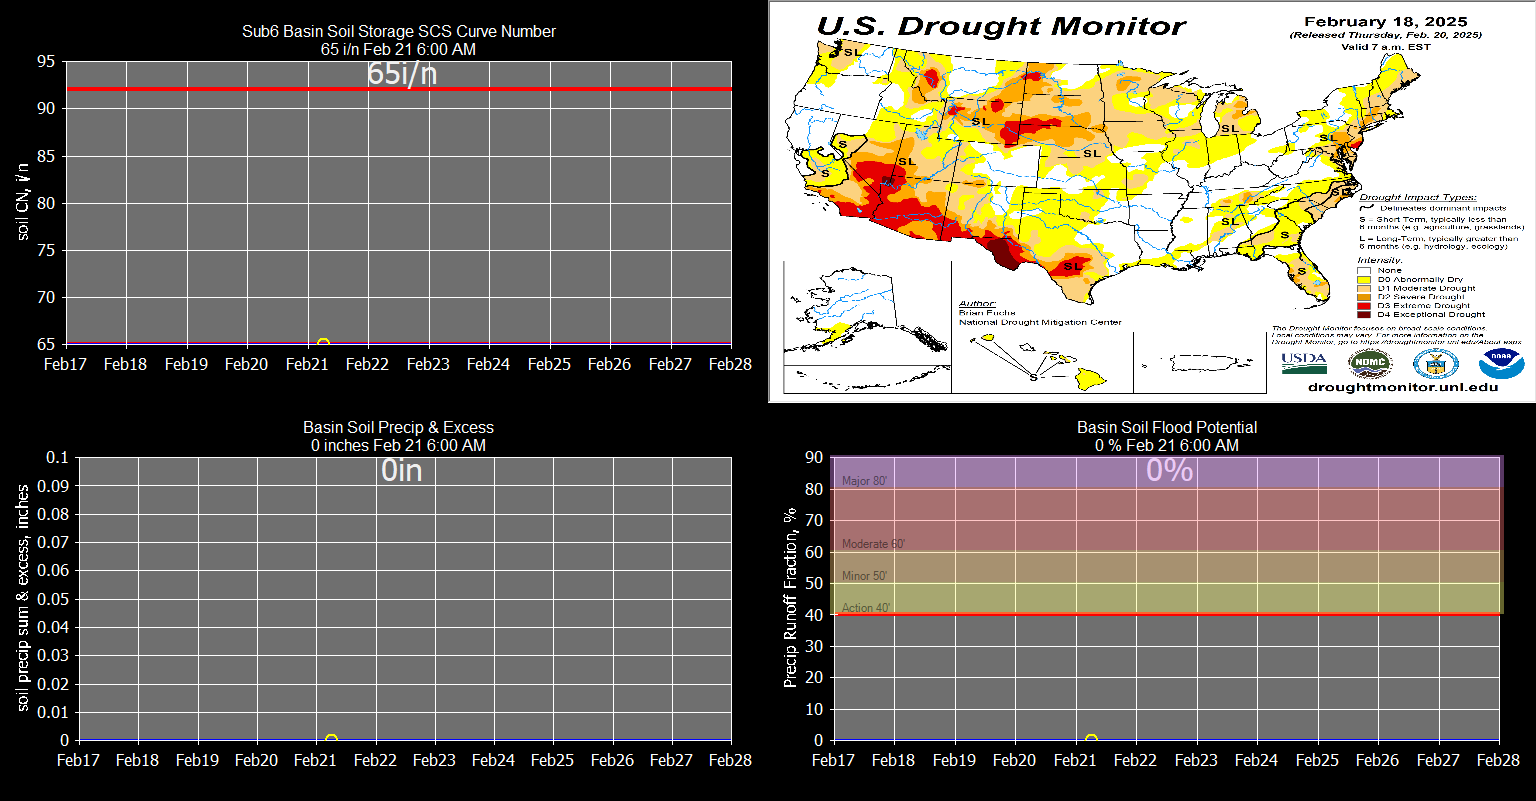
GetRealtime Sub6 Eherenberg Continuous SCS Soil Moisture:
100 Year Side Inlow Floods above Imperial Dam:
100 year peak flow=183 (DRNAREA)^0.516(PRECIP)^0.812
DRNAREA, drainage area in square miles; PRECIP, mean annual precipitation in
inches
Blythe Mean Annual Precip: 3.01"
All Subs 100-yr Peak Flow by Total Area 1598 sqmi =20,100
cfs
AZ Peak FLow Estimates by Region:
https://pubs.usgs.gov/sir/2014/5211/downloads/sir2014-5211.pdf
Each of the 6 subs will produce about 10,000 cfs Peak 100-yr Q individually
extending the high flow period hours.
I recall a USGS bound book report of 1927? where a hurricane produced a peak of
100, 000 cfs at Yuma ...just sayin.
The 1983 USGS peak below Imperial Dam was 30,200 cfs from spill out of Hoover
...those were the days.
Wellton-Mohawk Irrigation and Drainage District
(with emphasis on flooding on the Gila River)
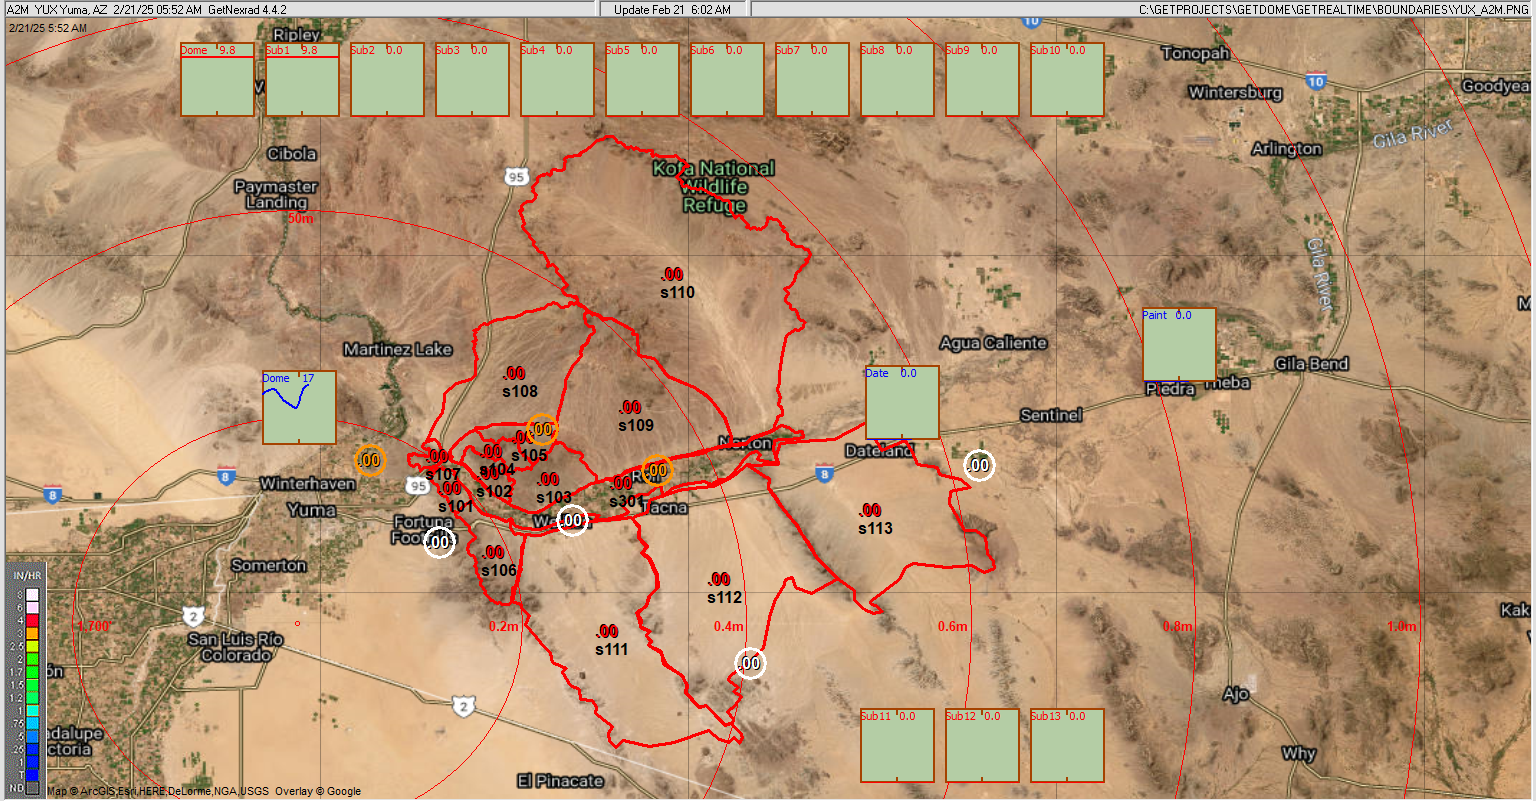
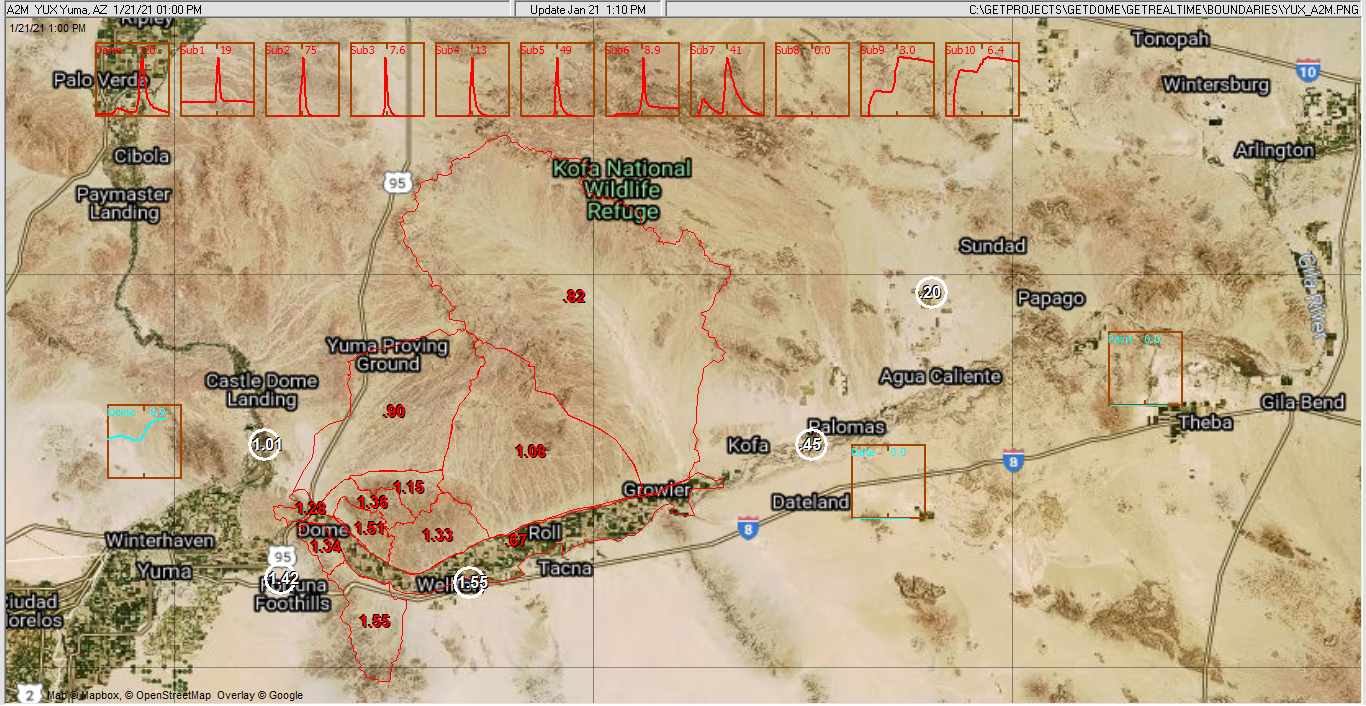
GetNexrad A2M MRMS Radar with Ag Area and 10 Desert Runoff Subbasins, Plots are
Yesterday and Today Flows:
The Wellton-Mohawk district is in a radar shadow of the 3000 foot Gila
Mountains. The A2M radar/satelite combo product overcomes this.
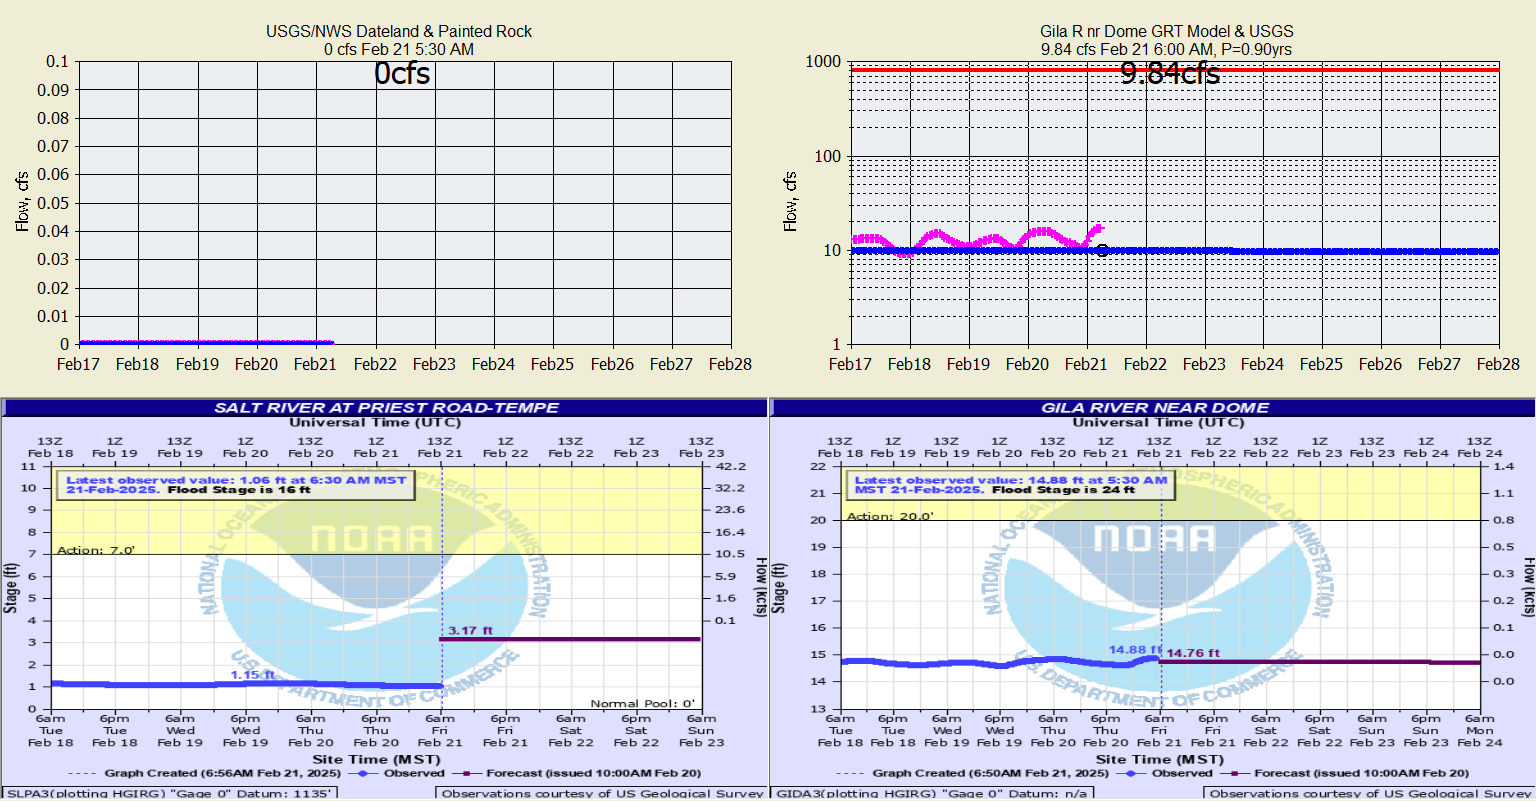
GetRealtime (GRT) 7-Day Flow Forecast, Current USGS, NWS Flood Flows of the
Gila River ( note top-right P=x yrs flood frquency ):
Current US Radar Map with Flood Stage Points and
Upper & Lower Basin Precip:
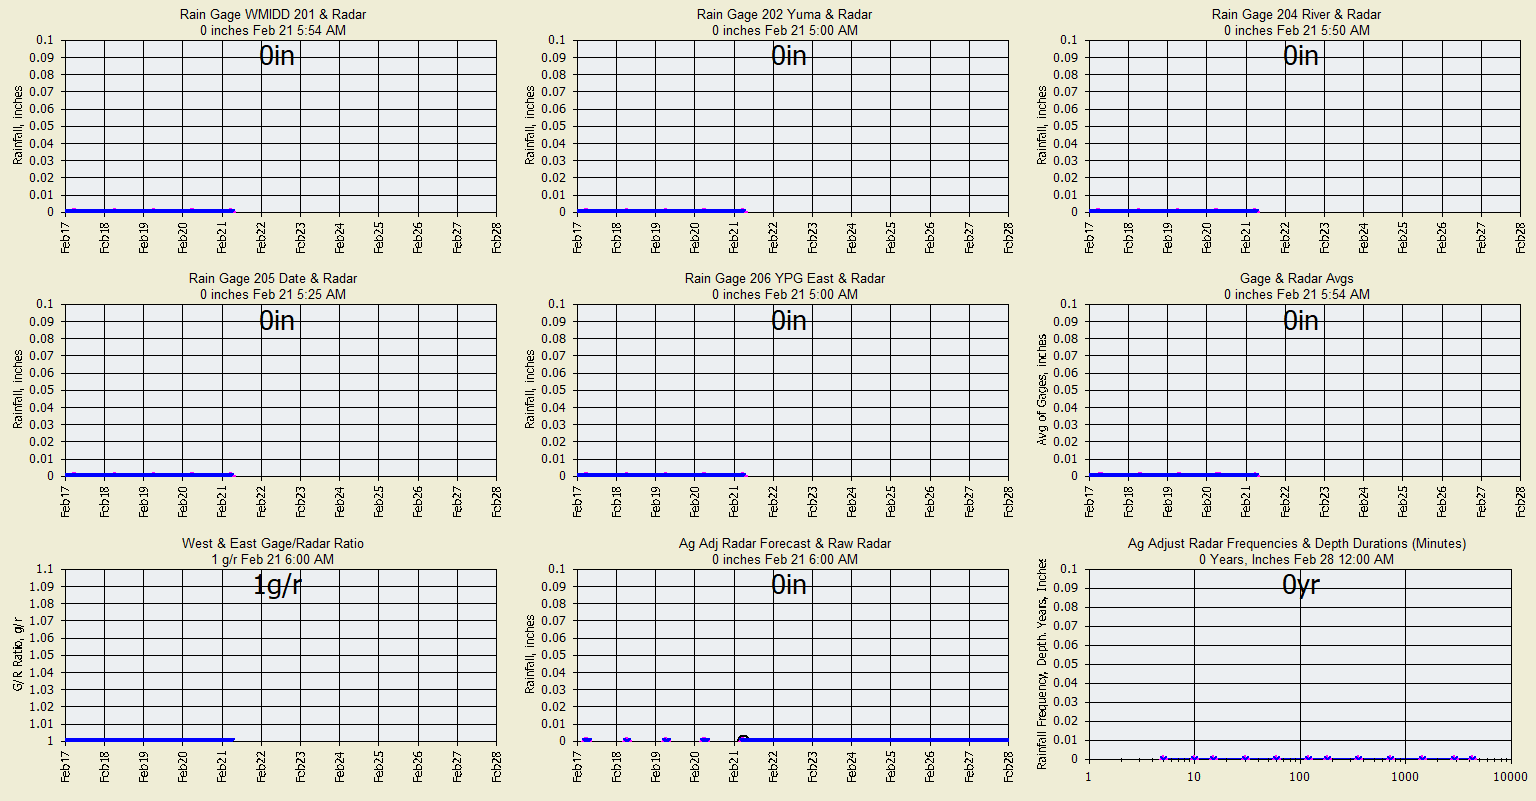
Current Rainfall Gages, Raw and Adusted Radar, NWS 7-Day Rain Forecast,
Rainfall Partial Frequencies and Depths:
I'm thinking for the farm turnout water order adjustment, take the
forecast rainfall below with ET farther below, convert to farm area acre-feet
and reduce your cfs-duration water order by that amount.
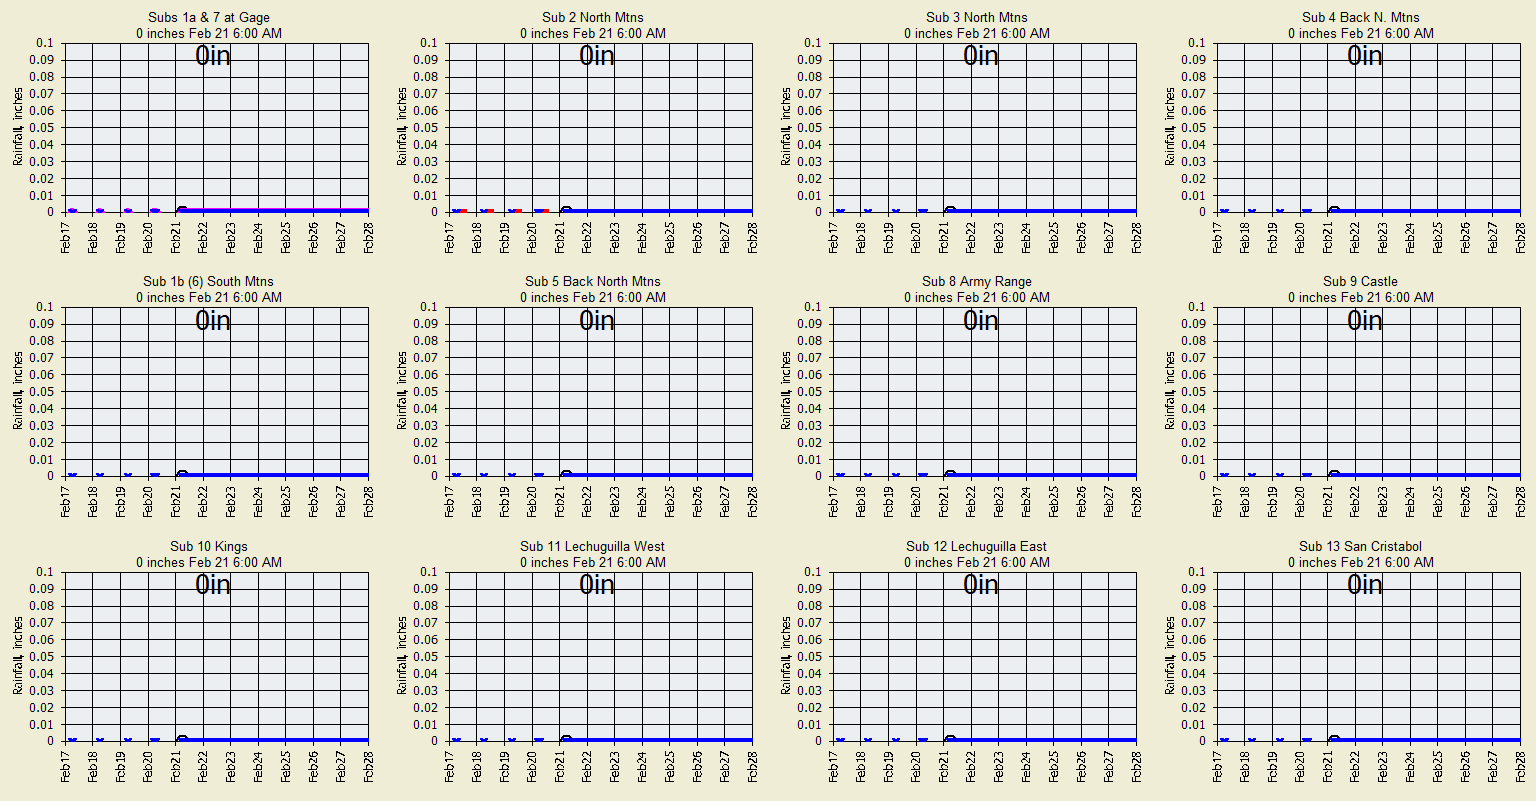
GetRealtime (GRT) 7-Day Forecast of 13 Desert Subbasins Rainfall
along the
Gila River:
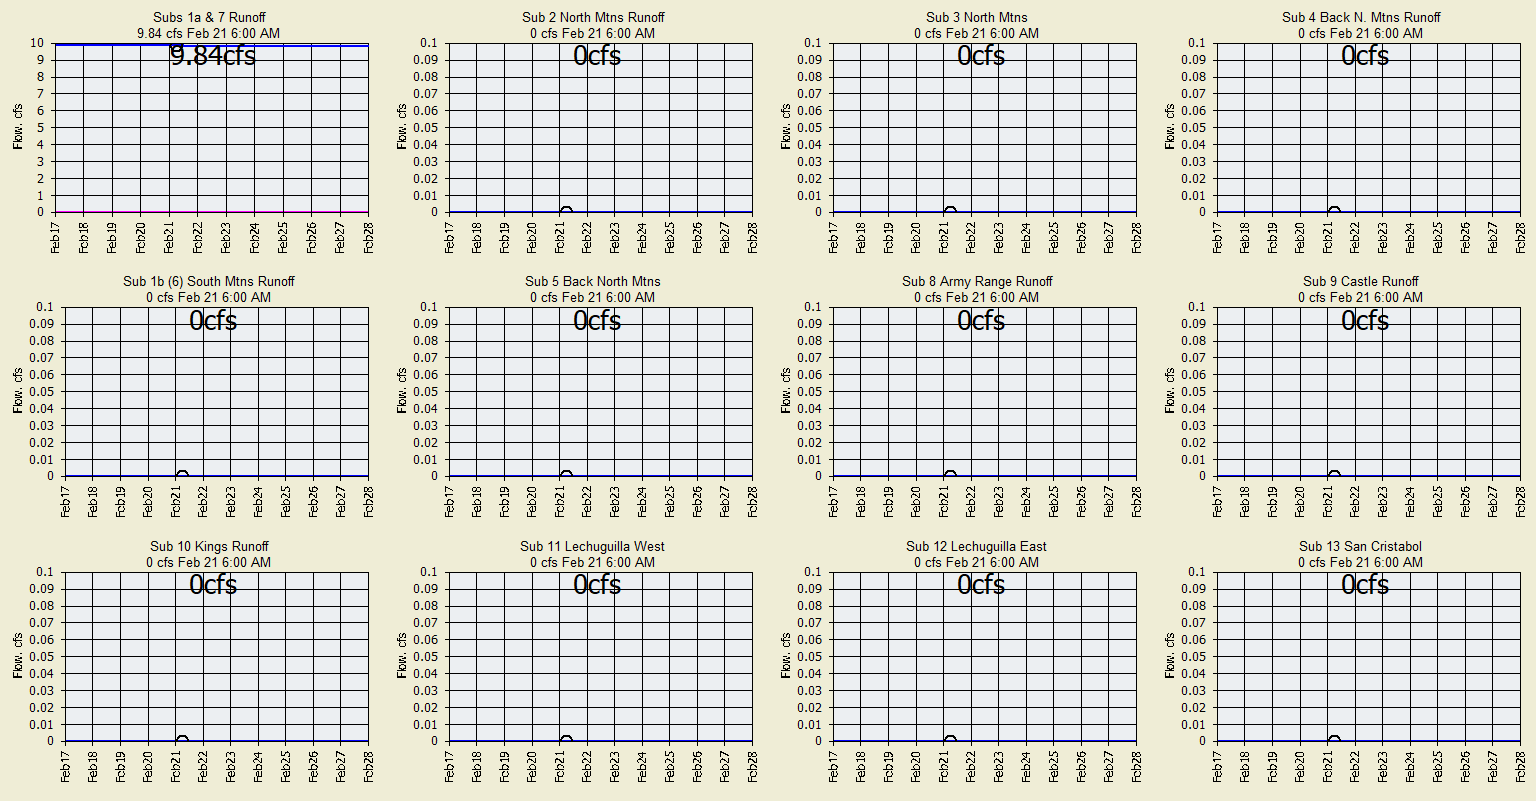
GetRealtime (GRT) 7-Day Forecast of 13 Desert Subbasins Runoff
along the
Gila River:
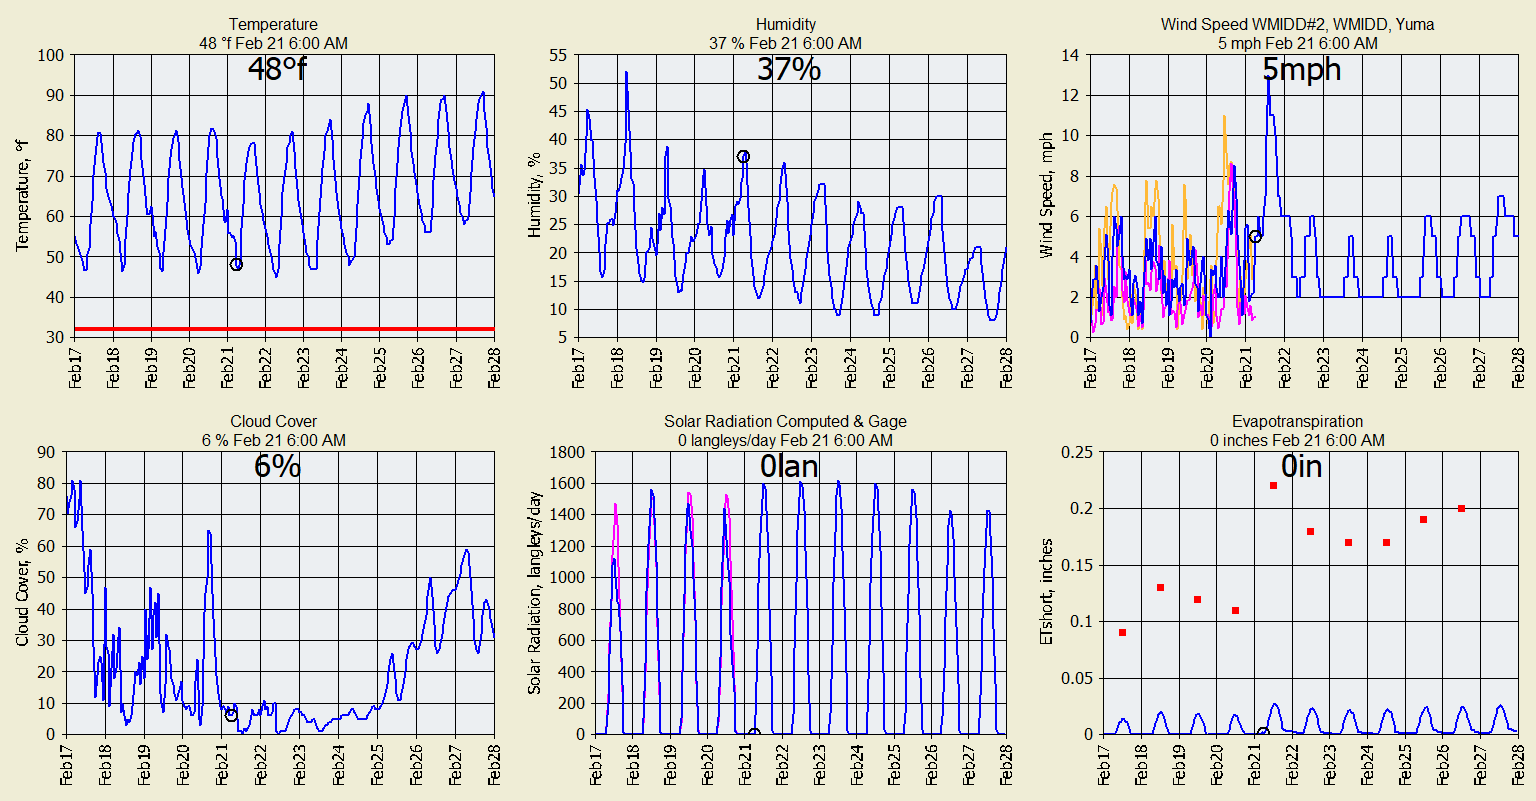
7-Day Weather Forecast and ASCE Evapotranspiration:
GetRealtime (GRT) 7-Day Rainfall Forecast and Canal Water Order
Adjustment:
For the canal delivery operator, if the farmers haven't done their work
above for you, you could take the whole Ag Area runoff, reduce it by the
fraction of current canal capacity as the reduction to your order at Parker Dam
as shown here... maybe???
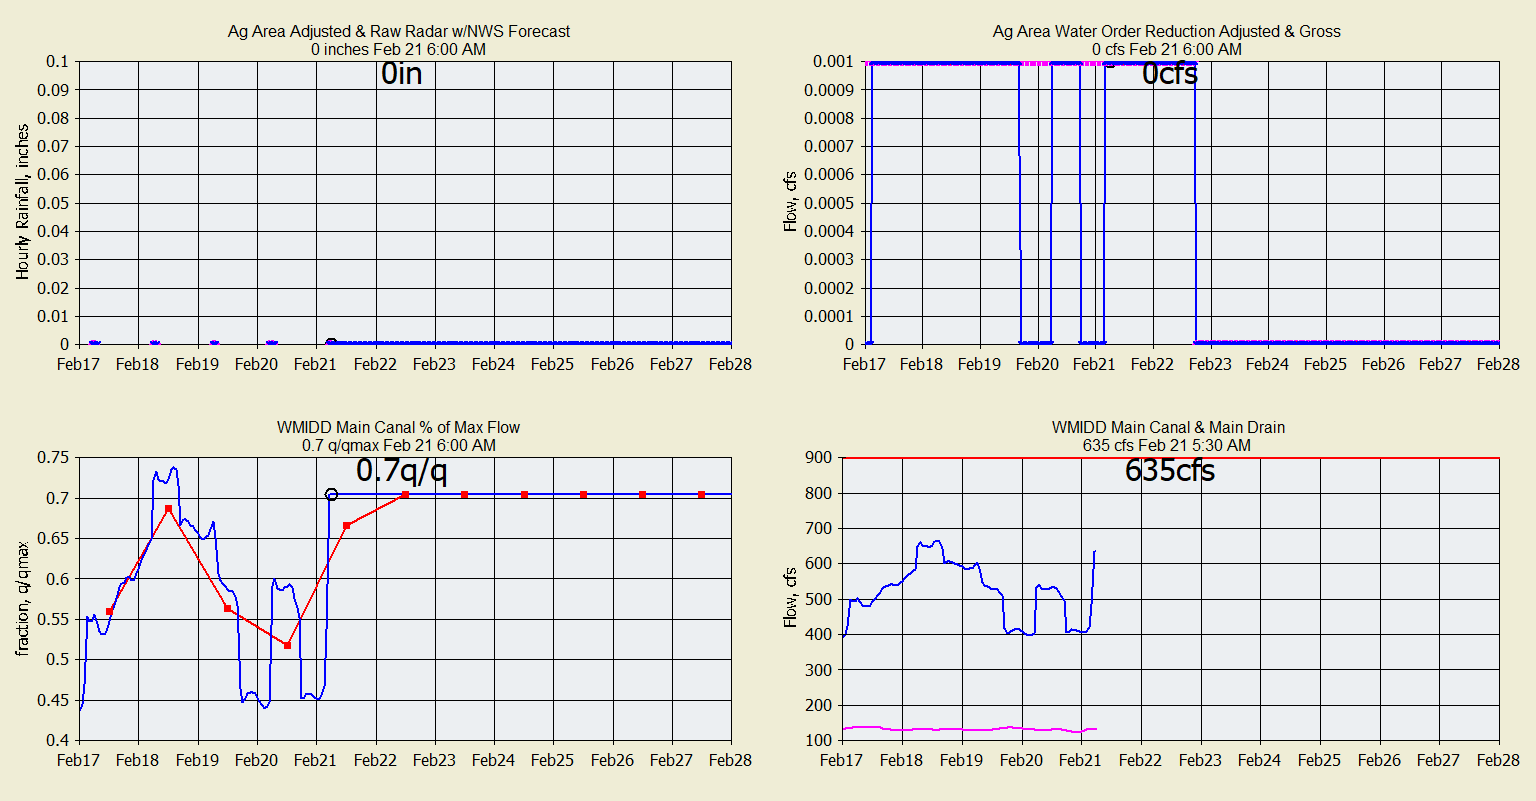
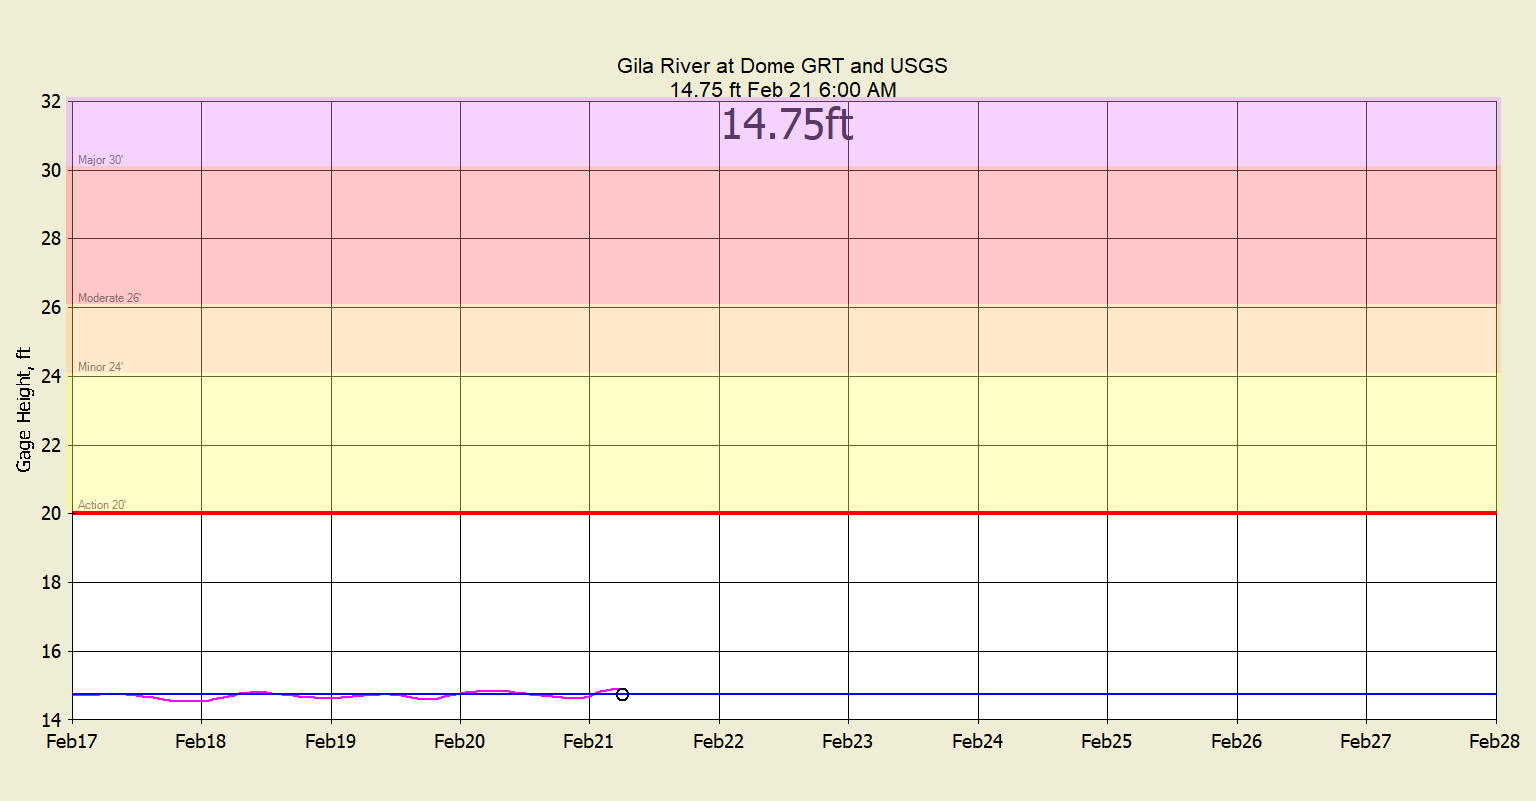
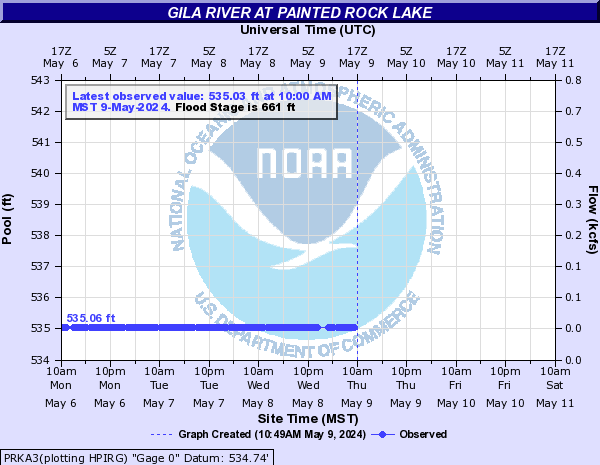
Gila River at Dome Flood Stage GRT Routed Inflows below Painted Rock and
USGS Gage:
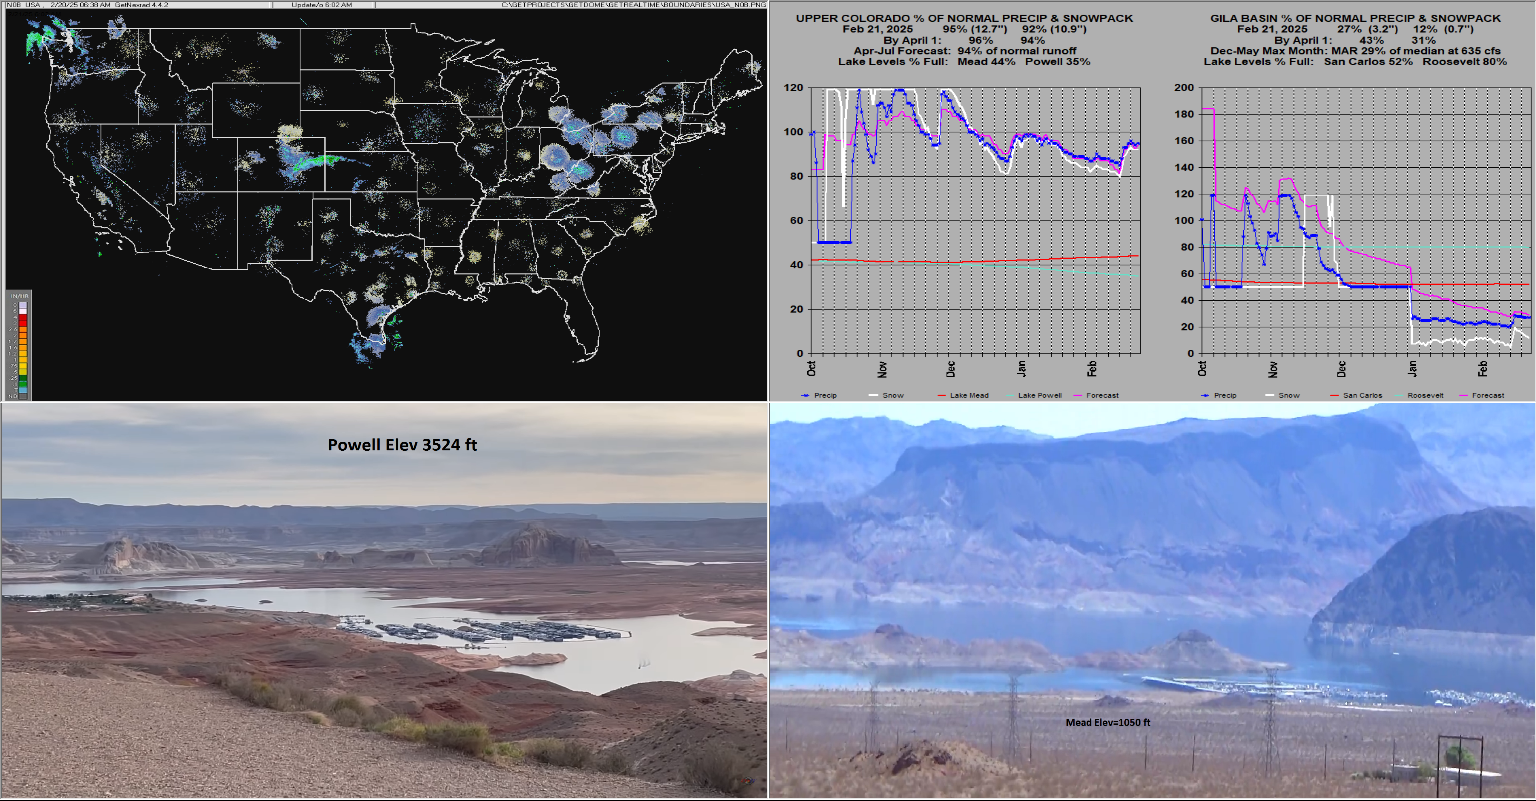
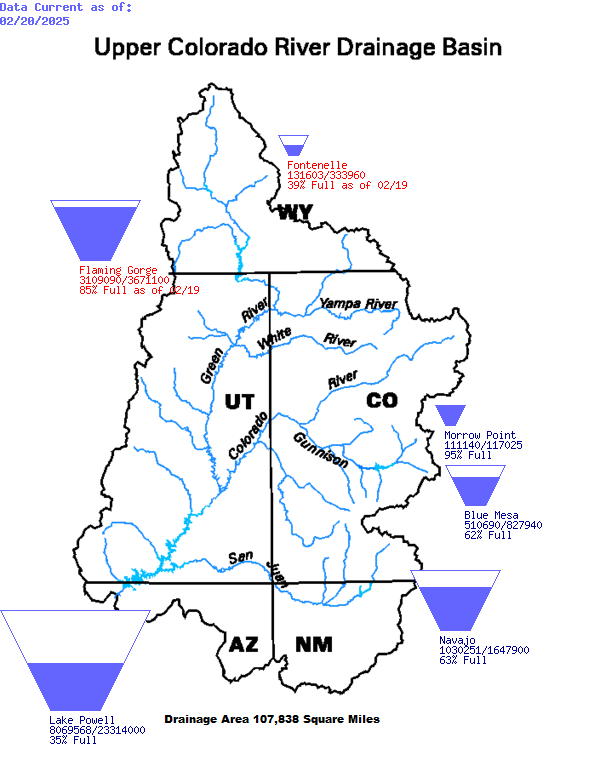
Powell & Gila Basin Current Snowpack, Reservoir Levels, and Forecast of Monthly
Flows:
(If date shown does not match graph date above try Ctrl*Refresh your
browser)
Upper Colorado River Basin Storage:
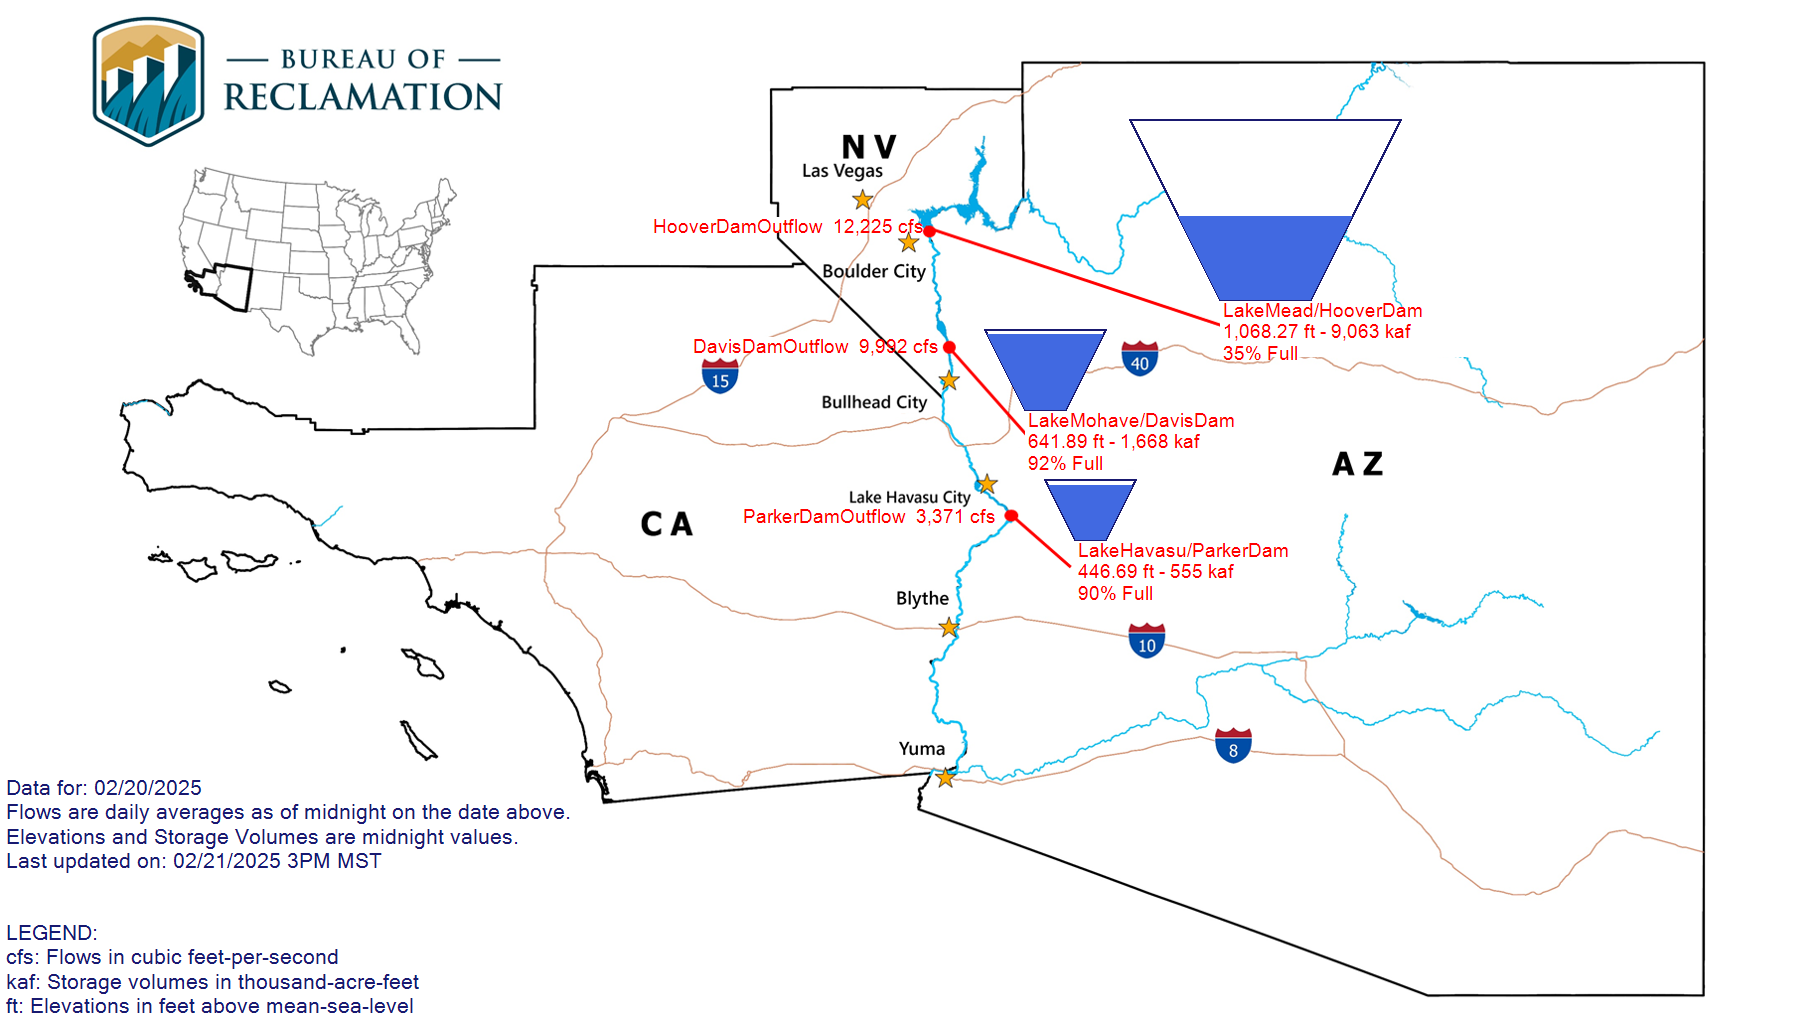
Lower Colorado River Basin Storage:
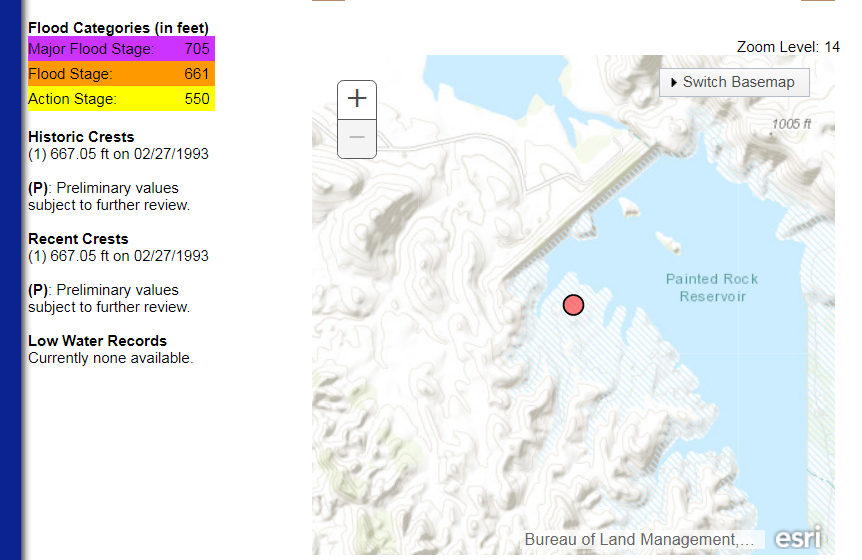
Gila River at Painted Rock Lake:
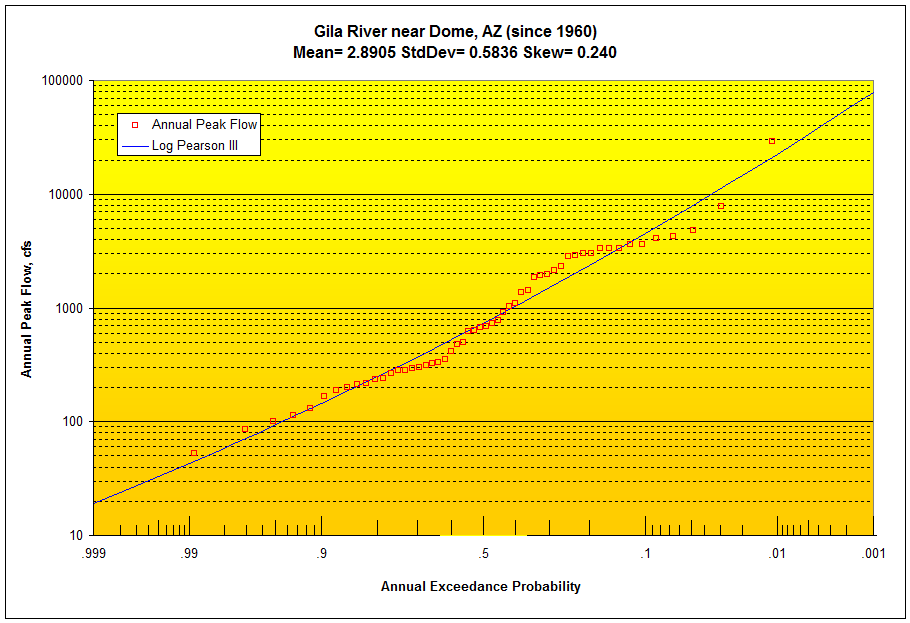
GetRegressions Gila nr Dome Flood Frequencies ( 1/0.1 P = 10 year flood of 4,000 cfs ):
Wellton-Mohawk Ag Area Rainfall Depth-Duration Frequencies ( 10-year,
3-hour rainfall depth= 1.52" ):
|
POINT PRECIPITATION FREQUENCY (PF) ESTIMATES
WITH 90% CONFIDENCE INTERVALS AND SUPPLEMENTARY INFORMATION
NOAA Atlas 14, Volume 1, Version 5
|
|
|
PDS-based precipitation frequency estimates with
90% confidence intervals (in inches)1 |
|
Duration |
Average recurrence interval (years) |
|
1 |
2 |
5 |
10 |
25 |
50 |
100 |
200 |
500 |
1000 |
|
5-min |
0.134(0.107‑0.154) |
0.181(0.152‑0.219) |
0.270(0.243‑0.351) |
0.342(0.317‑0.460) |
0.449(0.419‑0.623) |
0.538(0.505‑0.761) |
0.640(0.597‑0.920) |
0.756(0.694‑1.10) |
0.932(0.839‑1.39) |
1.09(0.958‑1.66) |
|
10-min |
0.204(0.162‑0.234) |
0.276(0.231‑0.333) |
0.411(0.370‑0.534) |
0.520(0.483‑0.700) |
0.683(0.638‑0.948) |
0.819(0.768‑1.16) |
0.975(0.908‑1.40) |
1.15(1.06‑1.68) |
1.42(1.28‑2.12) |
1.66(1.46‑2.52) |
|
15-min |
0.252(0.201‑0.291) |
0.342(0.287‑0.413) |
0.509(0.458‑0.662) |
0.645(0.598‑0.868) |
0.846(0.791‑1.18) |
1.02(0.952‑1.44) |
1.21(1.13‑1.74) |
1.43(1.31‑2.08) |
1.76(1.58‑2.62) |
2.05(1.81‑3.12) |
|
30-min |
0.340(0.271‑0.391) |
0.460(0.386‑0.556) |
0.686(0.617‑0.892) |
0.869(0.806‑1.17) |
1.14(1.07‑1.58) |
1.37(1.28‑1.93) |
1.63(1.52‑2.34) |
1.92(1.77‑2.81) |
2.37(2.13‑3.53) |
2.76(2.43‑4.21) |
|
60-min |
0.421(0.335‑0.484) |
0.569(0.478‑0.688) |
0.849(0.764‑1.10) |
1.08(0.997‑1.45) |
1.41(1.32‑1.96) |
1.69(1.59‑2.39) |
2.01(1.88‑2.89) |
2.38(2.18‑3.47) |
2.93(2.64‑4.37) |
3.42(3.01‑5.20) |
|
2-hr |
0.489(0.400‑0.592) |
0.678(0.564‑0.825) |
1.09(0.904‑1.32) |
1.43(1.17‑1.72) |
1.93(1.56‑2.34) |
2.37(1.88‑2.86) |
2.86(2.23‑3.47) |
3.41(2.60‑4.17) |
4.25(3.15‑5.27) |
5.00(3.59‑6.29) |
|
3-hr |
0.529(0.446‑0.633) |
0.734(0.619‑0.891) |
1.17(0.976‑1.40) |
1.52(1.25‑1.81) |
2.05(1.67‑2.45) |
2.51(2.00‑3.00) |
3.03(2.37‑3.64) |
3.62(2.77‑4.38) |
4.54(3.37‑5.55) |
5.36(3.86‑6.65) |
|
6-hr |
0.634(0.541‑0.748) |
0.872(0.745‑1.04) |
1.35(1.15‑1.60) |
1.75(1.46‑2.06) |
2.32(1.92‑2.75) |
2.81(2.28‑3.35) |
3.35(2.67‑4.01) |
3.95(3.09‑4.76) |
4.90(3.72‑5.98) |
5.74(4.25‑7.10) |
|
12-hr |
0.726(0.624‑0.849) |
1.01(0.861‑1.18) |
1.55(1.32‑1.81) |
1.98(1.68‑2.31) |
2.60(2.17‑3.04) |
3.13(2.58‑3.68) |
3.69(2.99‑4.36) |
4.31(3.44‑5.14) |
5.23(4.05‑6.32) |
6.08(4.59‑7.44) |
|
24-hr |
0.838(0.720‑0.976) |
1.16(0.999‑1.35) |
1.78(1.53‑2.07) |
2.28(1.95‑2.64) |
3.00(2.53‑3.48) |
3.59(3.00‑4.19) |
4.24(3.49‑4.98) |
4.96(4.00‑5.87) |
6.00(4.73‑7.21) |
6.86(5.30‑8.37) |
|
2-day |
0.895(0.768‑1.02) |
1.24(1.07‑1.40) |
1.87(1.62‑2.12) |
2.38(2.05‑2.69) |
3.09(2.63‑3.51) |
3.68(3.09‑4.21) |
4.31(3.57‑5.03) |
4.99(4.06‑5.93) |
6.06(4.75‑7.28) |
6.93(5.34‑8.45) |
|
3-day |
0.925(0.797‑1.06) |
1.27(1.10‑1.45) |
1.92(1.66‑2.18) |
2.43(2.10‑2.75) |
3.15(2.69‑3.57) |
3.74(3.15‑4.27) |
4.37(3.64‑5.07) |
5.05(4.12‑5.95) |
6.07(4.81‑7.32) |
6.97(5.39‑8.50) |
|
4-day |
0.956(0.826‑1.09) |
1.31(1.13‑1.49) |
1.97(1.71‑2.23) |
2.48(2.14‑2.82) |
3.21(2.74‑3.64) |
3.80(3.21‑4.34) |
4.44(3.70‑5.11) |
5.12(4.19‑5.97) |
6.09(4.88‑7.35) |
7.00(5.44‑8.54) |
|
7-day |
1.05(0.908‑1.19) |
1.43(1.24‑1.63) |
2.14(1.86‑2.43) |
2.69(2.32‑3.04) |
3.44(2.94‑3.90) |
4.04(3.42‑4.61) |
4.68(3.92‑5.39) |
5.36(4.41‑6.24) |
6.33(5.12‑7.50) |
7.13(5.67‑8.58) |
|
10-day |
1.10(0.948‑1.26) |
1.50(1.29‑1.72) |
2.26(1.95‑2.57) |
2.84(2.45‑3.24) |
3.66(3.12‑4.17) |
4.33(3.64‑4.96) |
5.04(4.18‑5.83) |
5.80(4.73‑6.80) |
6.88(5.49‑8.21) |
7.76(6.11‑9.44) |
|
20-day |
1.26(1.08‑1.44) |
1.73(1.49‑1.97) |
2.60(2.24‑2.96) |
3.26(2.80‑3.70) |
4.17(3.55‑4.74) |
4.89(4.12‑5.60) |
5.66(4.71‑6.54) |
6.46(5.30‑7.55) |
7.60(6.10‑9.03) |
8.51(6.73‑10.3) |
|
30-day |
1.43(1.25‑1.62) |
1.97(1.71‑2.21) |
2.89(2.52‑3.26) |
3.57(3.11‑4.02) |
4.48(3.87‑5.05) |
5.19(4.44‑5.88) |
5.92(5.00‑6.77) |
6.68(5.58‑7.72) |
7.72(6.33‑9.06) |
8.62(6.97‑10.4) |
|
45-day |
1.57(1.36‑1.78) |
2.16(1.89‑2.43) |
3.20(2.79‑3.60) |
3.96(3.44‑4.45) |
4.97(4.30‑5.60) |
5.76(4.93‑6.52) |
6.57(5.56‑7.50) |
7.40(6.19‑8.54) |
8.52(7.00‑9.98) |
9.39(7.61‑11.1) |
|
60-day |
1.72(1.49‑1.94) |
2.36(2.05‑2.66) |
3.49(3.04‑3.93) |
4.30(3.74‑4.84) |
5.37(4.65‑6.04) |
6.19(5.31‑6.99) |
7.02(5.96‑7.99) |
7.87(6.60‑9.06) |
8.99(7.43‑10.5) |
9.87(8.06‑11.7) |
|
1 Precipitation frequency (PF) estimates in this table
are based on frequency analysis of partial
duration series (PDS).
Numbers in parenthesis are PF estimates at lower and upper bounds of the 90%
confidence interval. The probability that precipitation frequency estimates (for
a given duration and average recurrence
interval) will be greater than the upper bound (or less than the lower
bound) is 5%. Estimates at upper bounds are not checked against probable maximum
precipitation (PMP) estimates and may be higher than currently valid PMP values.
Please refer to NOAA Atlas 14 document for more information.
|
Imperial Irrigation District
(with emphasis on delivery reservoirs)
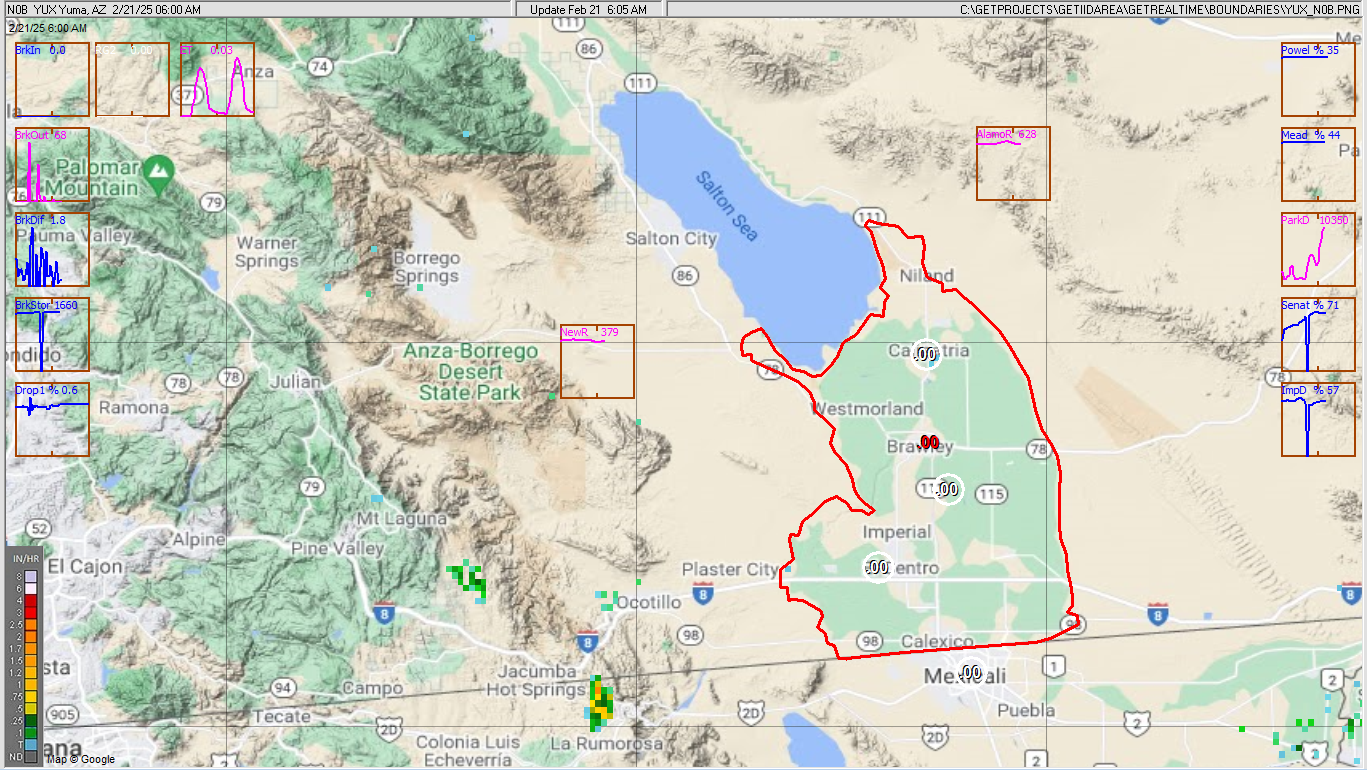
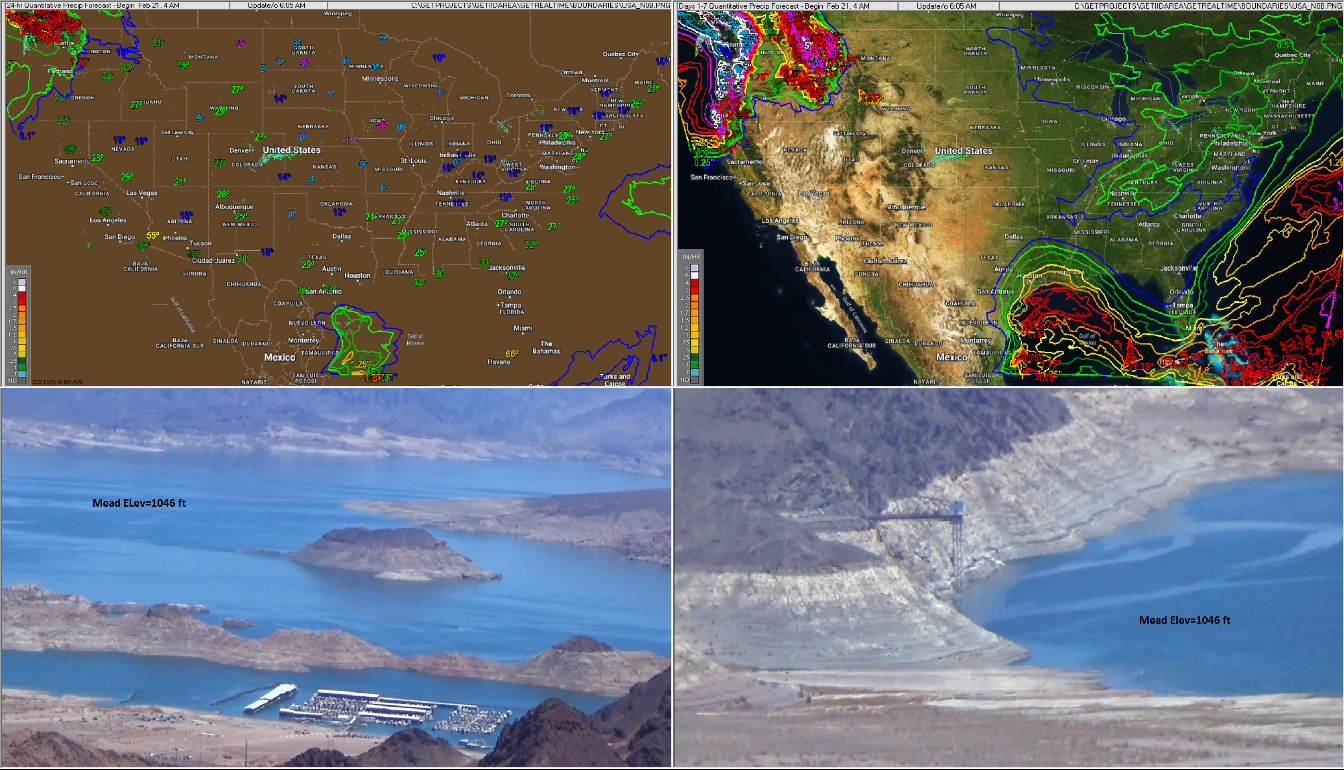
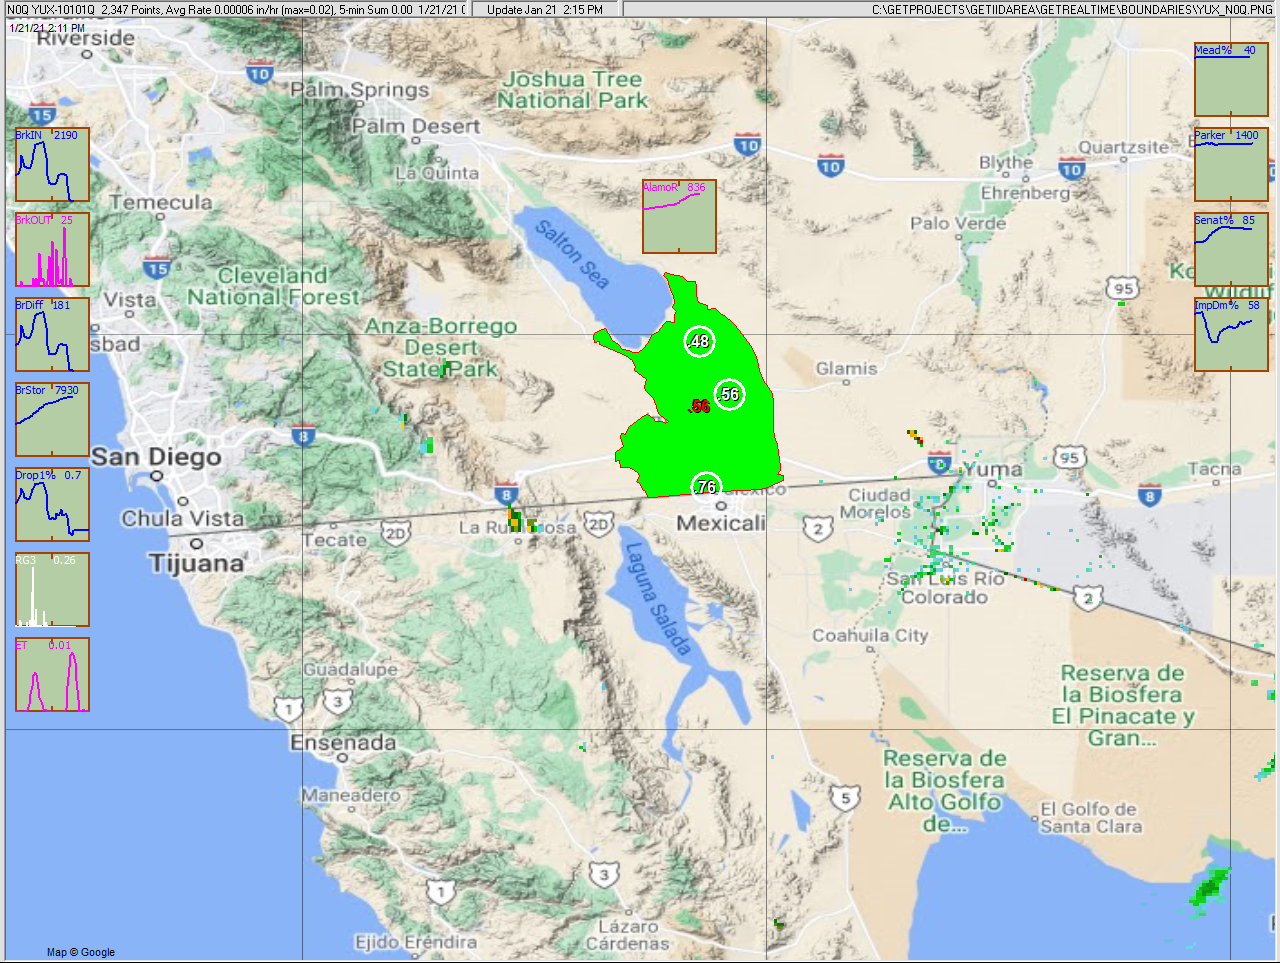
GetNexrad N0B radar with Ag Area, Plots for Yesterday and Today:
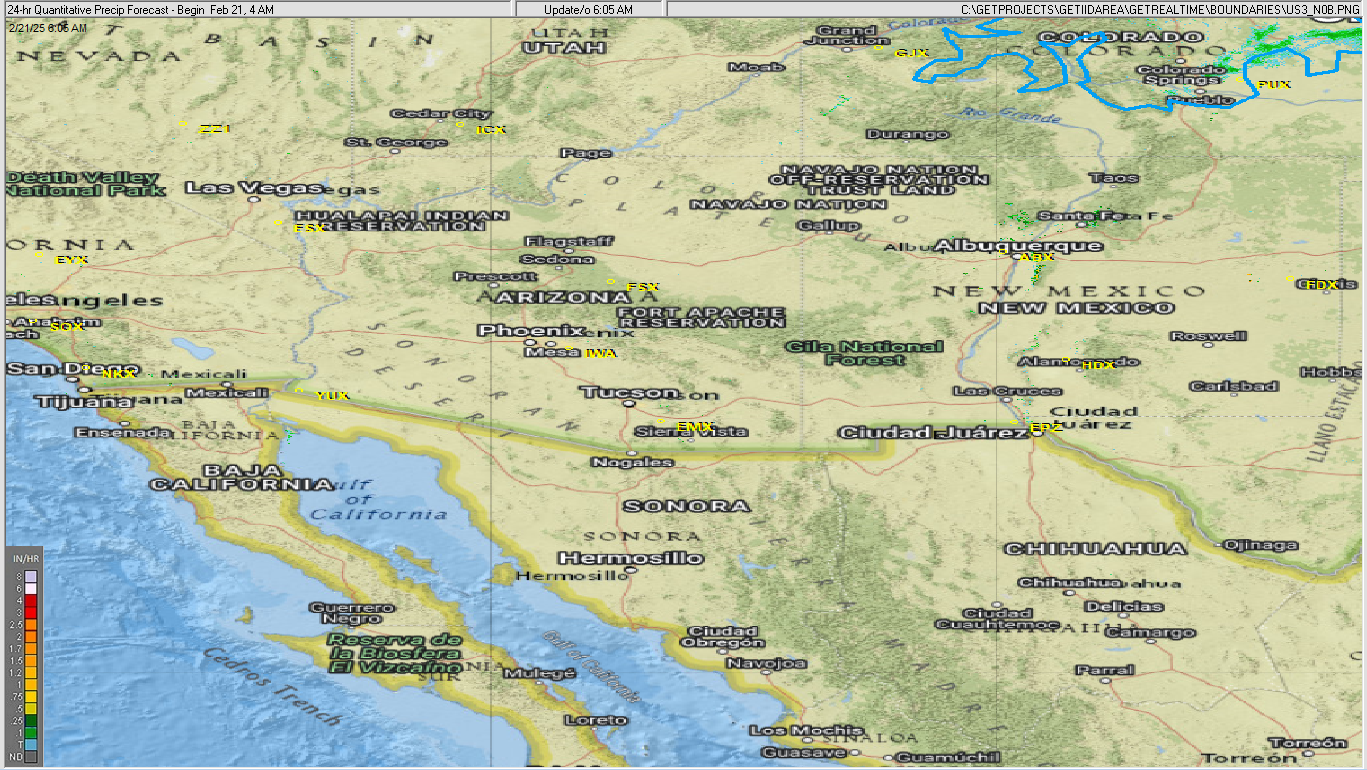
GetNexrad 24-Hour and 7-Day Rainfall Forecast Maps and More Pics of the
Cadillac Desert (Mead Elev 1046 ft):
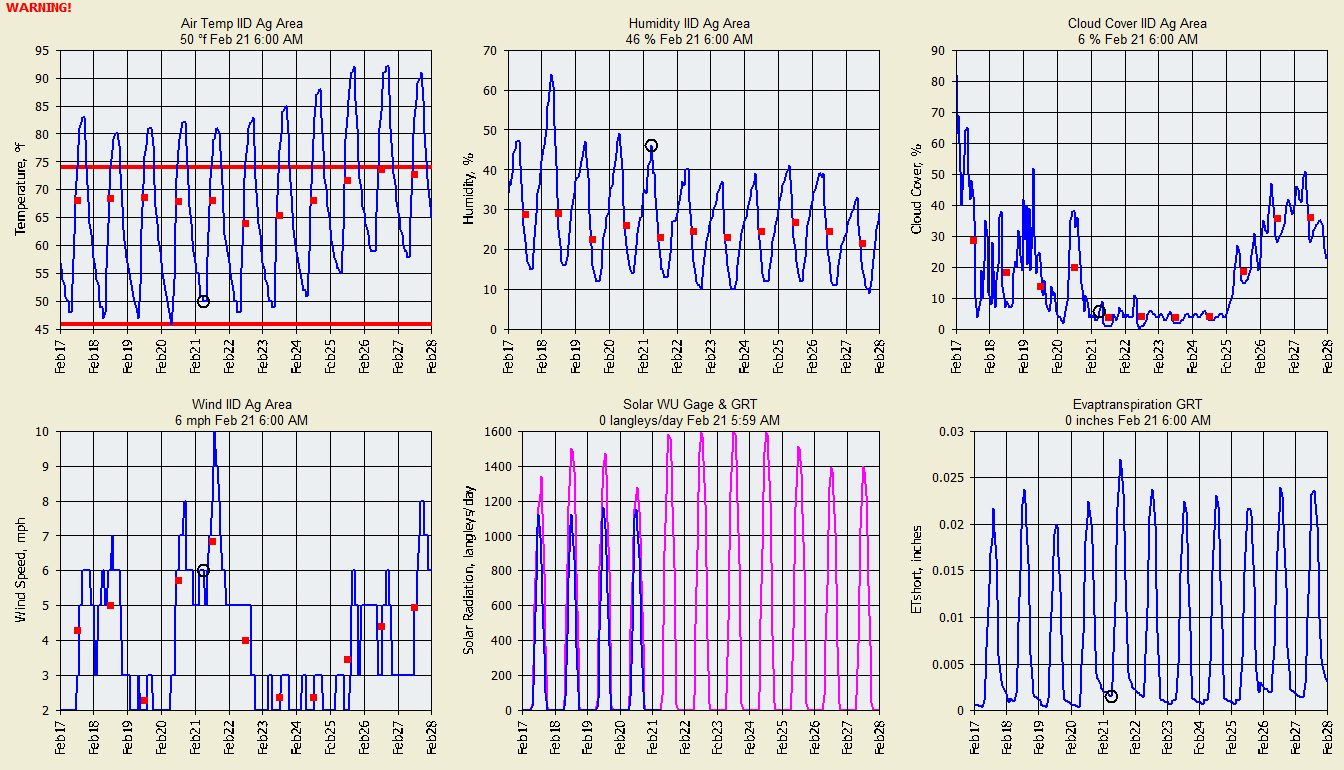
7-Day Weather Forecast and ASCE Evapotranspiration:
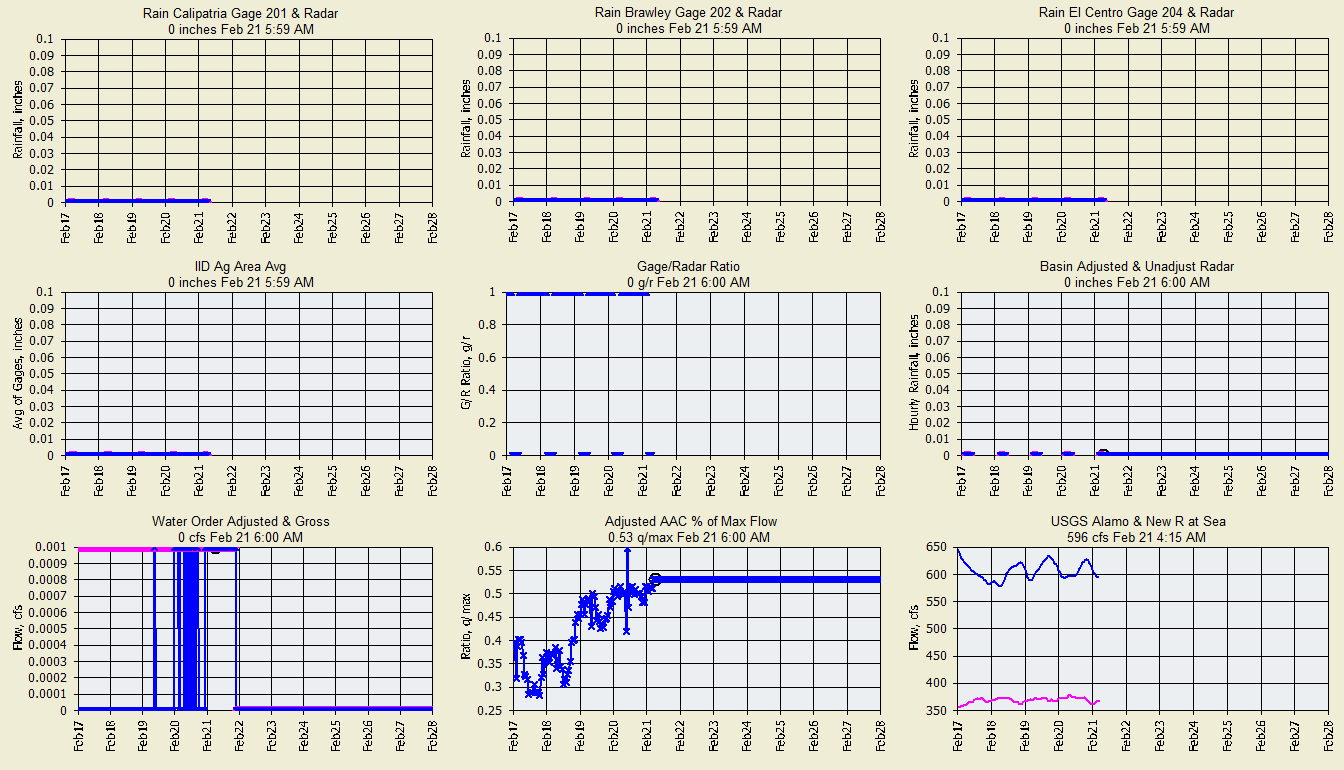
Current Rainfall Gages, Raw and Adusted Radar, NWS 7-Day Rain Forecast,
Water Order Adjustment:
For the canal delivery operator, if the farmers haven't done their work
above for you, you could take the whole Ag Area runoff, reduce it by the
fraction of current canal capacity as the reduction to your order at Parker Dam
as shown here... maybe???
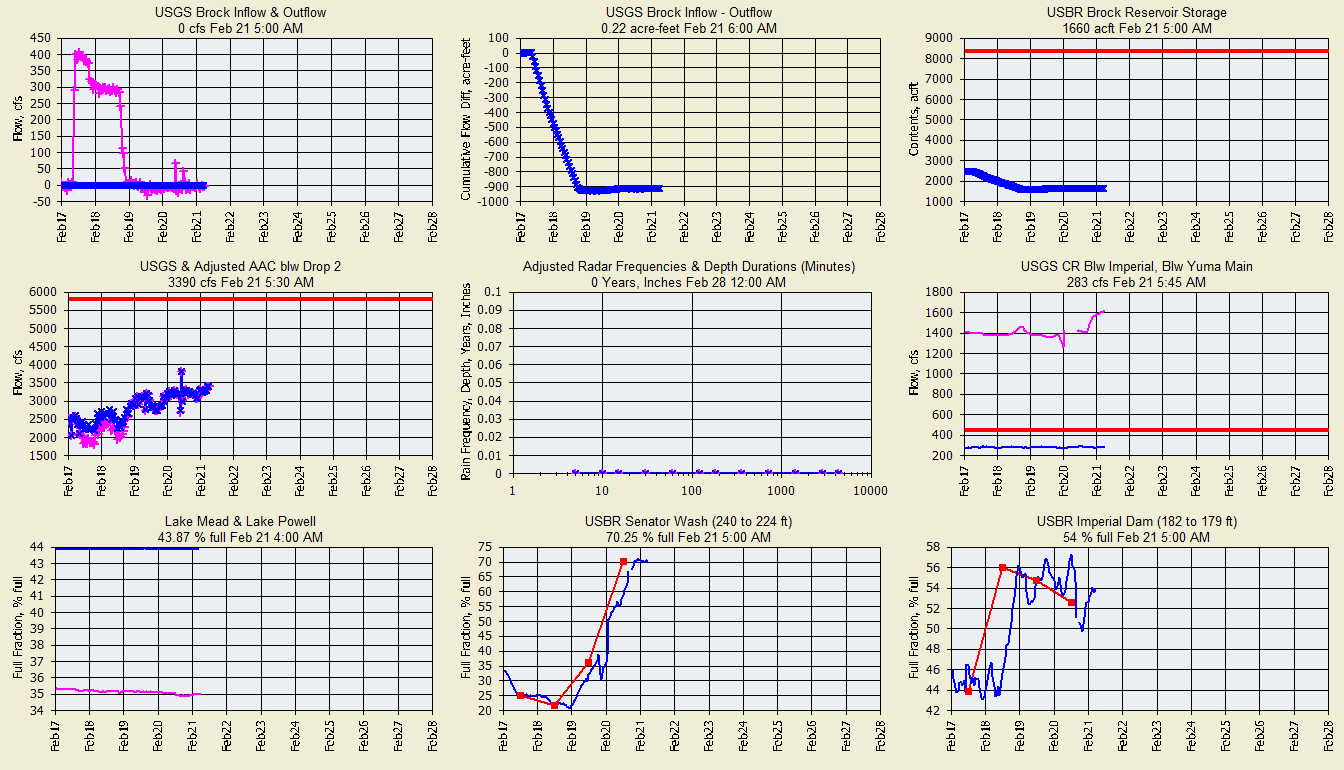
Brock Reservoir, Senator Wash, Imperial Dam, Lake Mead %Full, Ag Area
Rainfall Frequencies:
Another option for farmers to adjust their water oder is to watch
Senator Wash and Brock Reservoir inflows/outflows/level. Low Senator Wash level
and high Brock outflows mean the smart money is on a cut in water orders. Just
sayin... I don't know man, you may have it backwards... the smarter money may be
on the farmers.
Diamond-Hoover shows Lake Mead rising or falling, 24-month Annual
Operating Plan :
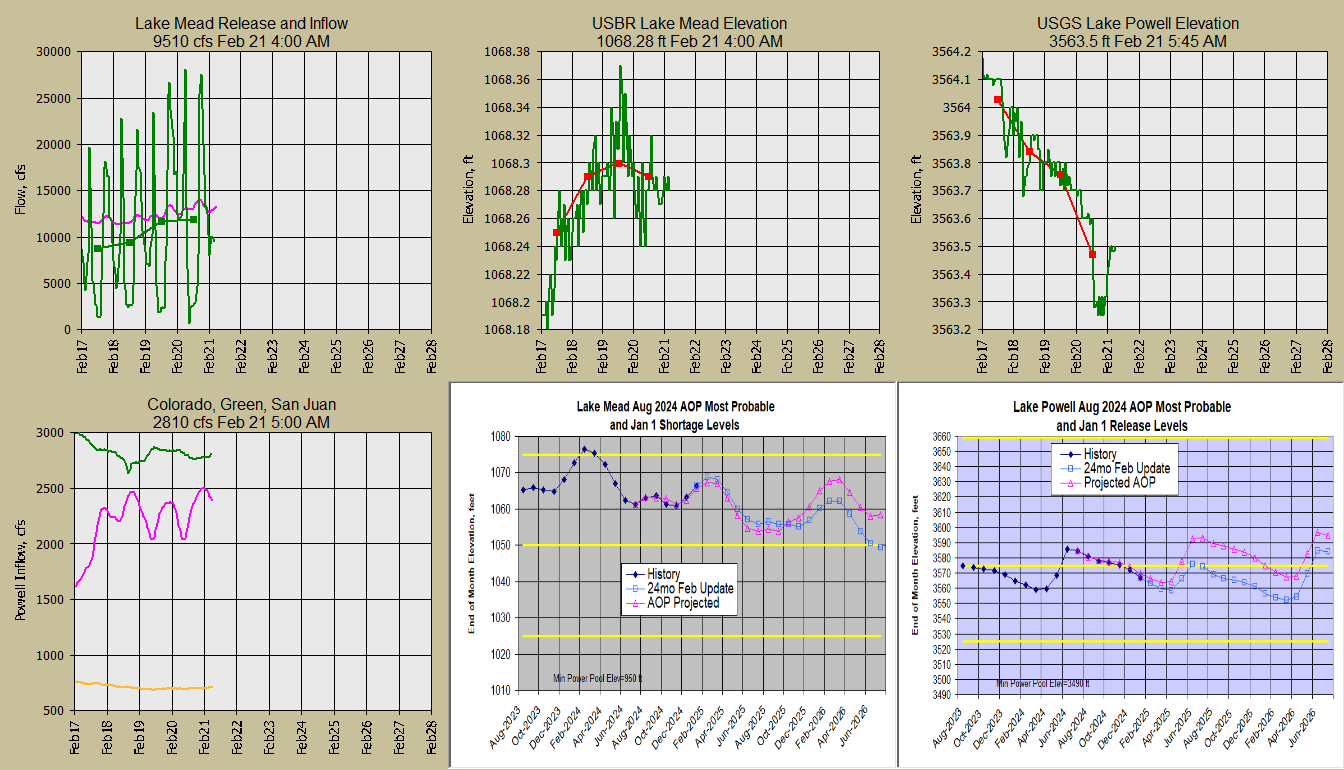
Hoover Minimum Power Pool Elev=950 ft
Glen Minimum Power Pool Elev=3490 ft
Imperial Ag Area Rainfall Depth-Duration Frequencies ( 10-year,
3-hour rainfall depth= 0.936" ):
|
POINT PRECIPITATION FREQUENCY (PF) ESTIMATES
WITH 90% CONFIDENCE INTERVALS AND SUPPLEMENTARY INFORMATION
NOAA Atlas 14, Volume 6, Version 2
|
|
PDS-based precipitation frequency estimates with
90% confidence intervals (in inches)1 |
|
Duration |
Average recurrence interval (years) |
|
1 |
2 |
5 |
10 |
25 |
50 |
100 |
200 |
500 |
1000 |
|
5-min |
0.060(0.051‑0.072) |
0.094(0.079‑0.112) |
0.147(0.123‑0.176) |
0.197(0.164‑0.239) |
0.279(0.225‑0.351) |
0.354(0.279‑0.455) |
0.443(0.339‑0.584) |
0.548(0.408‑0.745) |
0.719(0.512‑1.02) |
0.877(0.602‑1.29) |
|
10-min |
0.086(0.073‑0.103) |
0.135(0.113‑0.161) |
0.210(0.177‑0.253) |
0.283(0.236‑0.343) |
0.400(0.322‑0.503) |
0.508(0.399‑0.652) |
0.635(0.486‑0.836) |
0.786(0.585‑1.07) |
1.03(0.734‑1.46) |
1.26(0.863‑1.85) |
|
15-min |
0.104(0.088‑0.125) |
0.163(0.137‑0.195) |
0.254(0.214‑0.306) |
0.342(0.285‑0.415) |
0.484(0.389‑0.608) |
0.614(0.483‑0.789) |
0.767(0.588‑1.01) |
0.951(0.707‑1.29) |
1.25(0.888‑1.77) |
1.52(1.04‑2.24) |
|
30-min |
0.144(0.122‑0.173) |
0.226(0.190‑0.271) |
0.353(0.297‑0.425) |
0.475(0.395‑0.576) |
0.672(0.540‑0.844) |
0.852(0.670‑1.10) |
1.07(0.816‑1.40) |
1.32(0.982‑1.79) |
1.73(1.23‑2.45) |
2.11(1.45‑3.10) |
|
60-min |
0.201(0.170‑0.241) |
0.315(0.266‑0.378) |
0.493(0.414‑0.592) |
0.663(0.552‑0.803) |
0.938(0.754‑1.18) |
1.19(0.935‑1.53) |
1.49(1.14‑1.96) |
1.84(1.37‑2.50) |
2.41(1.72‑3.43) |
2.94(2.02‑4.33) |
|
2-hr |
0.276(0.233‑0.331) |
0.412(0.347‑0.494) |
0.626(0.526‑0.752) |
0.832(0.693‑1.01) |
1.17(0.939‑1.47) |
1.48(1.16‑1.90) |
1.85(1.42‑2.44) |
2.29(1.71‑3.12) |
3.02(2.15‑4.29) |
3.70(2.54‑5.44) |
|
3-hr |
0.322(0.271‑0.385) |
0.471(0.397‑0.565) |
0.708(0.595‑0.851) |
0.936(0.779‑1.14) |
1.31(1.05‑1.64) |
1.65(1.30‑2.12) |
2.06(1.58‑2.72) |
2.56(1.90‑3.48) |
3.37(2.40‑4.78) |
4.12(2.83‑6.06) |
|
6-hr |
0.402(0.340‑0.482) |
0.584(0.493‑0.700) |
0.869(0.730‑1.05) |
1.14(0.951‑1.38) |
1.58(1.27‑1.99) |
1.99(1.57‑2.56) |
2.47(1.89‑3.26) |
3.05(2.27‑4.14) |
3.98(2.83‑5.64) |
4.84(3.32‑7.12) |
|
12-hr |
0.467(0.394‑0.558) |
0.688(0.580‑0.824) |
1.03(0.864‑1.24) |
1.35(1.12‑1.63) |
1.86(1.49‑2.33) |
2.31(1.82‑2.97) |
2.84(2.18‑3.75) |
3.47(2.58‑4.71) |
4.46(3.18‑6.33) |
5.36(3.68‑7.88) |
|
24-hr |
0.592(0.523‑0.684) |
0.890(0.785‑1.03) |
1.34(1.18‑1.55) |
1.75(1.53‑2.04) |
2.39(2.03‑2.88) |
2.96(2.46‑3.63) |
3.61(2.93‑4.53) |
4.35(3.45‑5.61) |
5.51(4.20‑7.39) |
6.54(4.83‑9.05) |
|
2-day |
0.703(0.621‑0.812) |
1.06(0.939‑1.23) |
1.60(1.41‑1.85) |
2.08(1.82‑2.43) |
2.83(2.40‑3.41) |
3.48(2.89‑4.27) |
4.21(3.42‑5.28) |
5.04(3.99‑6.49) |
6.31(4.80‑8.45) |
7.41(5.47‑10.3) |
|
3-day |
0.747(0.660‑0.862) |
1.13(0.998‑1.31) |
1.70(1.49‑1.97) |
2.21(1.93‑2.58) |
2.98(2.53‑3.59) |
3.65(3.04‑4.49) |
4.40(3.58‑5.53) |
5.25(4.16‑6.77) |
6.54(4.98‑8.76) |
7.66(5.65‑10.6) |
|
4-day |
0.784(0.693‑0.905) |
1.18(1.05‑1.37) |
1.77(1.56‑2.05) |
2.30(2.01‑2.69) |
3.10(2.63‑3.74) |
3.79(3.15‑4.65) |
4.56(3.70‑5.72) |
5.42(4.30‑6.99) |
6.74(5.13‑9.02) |
7.87(5.80‑10.9) |
|
7-day |
0.838(0.740‑0.967) |
1.25(1.11‑1.45) |
1.86(1.63‑2.15) |
2.40(2.10‑2.80) |
3.22(2.73‑3.88) |
3.93(3.26‑4.82) |
4.71(3.83‑5.91) |
5.59(4.43‑7.21) |
6.93(5.28‑9.28) |
8.08(5.96‑11.2) |
|
10-day |
0.869(0.768‑1.00) |
1.29(1.14‑1.49) |
1.91(1.68‑2.21) |
2.46(2.15‑2.87) |
3.29(2.79‑3.97) |
4.00(3.33‑4.91) |
4.79(3.89‑6.01) |
5.67(4.49‑7.31) |
7.00(5.33‑9.37) |
8.13(6.00‑11.3) |
|
20-day |
0.950(0.840‑1.10) |
1.42(1.26‑1.65) |
2.10(1.85‑2.43) |
2.69(2.35‑3.14) |
3.57(3.03‑4.30) |
4.31(3.58‑5.29) |
5.11(4.15‑6.41) |
5.99(4.74‑7.72) |
7.29(5.55‑9.76) |
8.38(6.18‑11.6) |
|
30-day |
1.00(0.884‑1.16) |
1.52(1.34‑1.75) |
2.24(1.97‑2.60) |
2.87(2.51‑3.35) |
3.79(3.21‑4.56) |
4.54(3.78‑5.58) |
5.35(4.35‑6.72) |
6.24(4.94‑8.04) |
7.52(5.73‑10.1) |
8.58(6.33‑11.9) |
|
45-day |
1.06(0.936‑1.22) |
1.63(1.44‑1.88) |
2.42(2.13‑2.80) |
3.09(2.70‑3.61) |
4.06(3.44‑4.89) |
4.84(4.02‑5.94) |
5.67(4.61‑7.12) |
6.56(5.19‑8.45) |
7.82(5.96‑10.5) |
8.85(6.53‑12.2) |
|
60-day |
1.13(1.00‑1.31) |
1.77(1.56‑2.04) |
2.63(2.32‑3.05) |
3.37(2.94‑3.93) |
4.40(3.73‑5.30) |
5.23(4.35‑6.42) |
6.10(4.95‑7.66) |
7.01(5.55‑9.04) |
8.30(6.32‑11.1) |
9.33(6.88‑12.9) |
|
1 Precipitation frequency (PF) estimates in this table
are based on frequency analysis of partial
duration series (PDS).
Numbers in parenthesis are PF estimates at lower and upper bounds of the 90%
confidence interval. The probability that precipitation frequency estimates (for
a given duration and average recurrence
interval) will be greater than the upper bound (or less than the lower
bound) is 5%. Estimates at upper bounds are not checked against probable maximum
precipitation (PMP) estimates and may be higher than currently valid PMP values.
Please refer to NOAA Atlas 14 document for more information.
|
Current Radar and 24-Hour Precip Forecast:
PAST EVENTS:
Jan 21, 2021 -- GetNexrad A2M MRMS Radar with Ag Area and 10 Desert Runoff Subbasins, Plots are
Yesterday and Today Flows:
Jan 21, 2021 -- GetNexrad N0Q radar with Ag Area, Plots for Yesterday and Today:
GetGraphs_setup.txt file example for WMIDD:
Days = 4 ; End Day +6
Plot Unit Values = False
Include Daily Max/Min = False
Big Current Value = True
Auto Paging = False, 15
Font Names & Pen Widths = Tahoma, Tahoma, 2, 2
Database Connection String= Provider=Microsoft.Jet.OLEDB.4.0;Data Source=C:\GetProjects\GetDome\GetAccess\GetAccessHDB_DOME.mdb;User Id=admin;Password=;
Owner ID=
Start Up= 0 , 428 , 1493 , 1032 , 0
Metric Units=False
Minutes Timeout=4.0
Page/Graph; dsid (, dsid2, run, alert); parametername; stationname; hrmarker; daymarker; logyscale; backcolor;back2color; hrcolor; daycolor; highwatch; lowwatch; watchcount; rank-1/cumulative2; freq type -1or-2/prob type 1or2/MAE3/ColorBand4; coeff1; coeff2; coeff3
1 ;WMIDD Ag District; 10 ; 9 ;-1 ;FTP_ON;UNITS_ON
1 ; 10201 ,-10201 ;Rainfall;Rain Gage WMIDD 201 & Radar; 1 ; 3 ; 0 ; 14085615 ; 15921132 ; 16711680 ; 255 ; 0 ; 0 ; 0 ; 2
2 ; 10202 ,-10202 ;Rainfall;Rain Gage 202 Yuma & Radar; 1 ; 3 ; 0 ; 14085615 ; 15921132 ; 16711680 ; 255 ; 0 ; 0 ; 0 ; 2
3 ; 10204 ,-10204 ;Rainfall;Rain Gage 204 River & Radar; 1 ; 3 ; 0 ; 14085615 ; 15921132 ; 16711680 ; 255 ; 0 ; 0 ; 0 ; 2
4 ; 10205 ,-10205 ;Rainfall;Rain Gage 205 Date & Radar; 1 ; 3 ; 0 ; 14085615 ; 15921132 ; 16711680 ; 255 ; 0 ; 0 ; 0 ; 2
5 ; 10206 ,-10206 ;Rainfall;Rain Gage 206 Columbus & Radar; 1 ; 3 ; 0 ; 14085615 ; 15921132 ; 16711680 ; 255 ; 0 ; 0 ; 0 ; 2
6 ; 10209 ,-10209 ;Avg of Gages;Gage & Radar Avgs; 1 ; 3 ; 0 ; 14085615 ; 15921132 ; 16711680 ; 255 ; 0 ; 0 ; 0 ; 2
7 ; 31209 , 31210 ;G/R Ratio;West & East Gage/Radar Ratio; 2 ; 2 ; 0 ; 14085615 ; 15921132 ; 16711680 ; 255 ; 0 ; 0 ; 0 ; 0
8 ;-11301 ,-10301 ;Rainfall;Ag Adj Radar Forecast & Raw Radar; 1 ; 3 ; 0 ; 14085615 ; 15921132 ; 16711680 ; 255 ; 0 ; 0 ; 0 ; 2
9 ;-11301 ;Rainfall Frequency, Depth;Ag Adjust Radar Frequencies & Depth Durations (Minutes); 1 ; 1 ; 0 ; 14085615 ; 15921132 ; 16711680 ; 255 ; 0 ; 0 ; 0 ; 0 ;-2
10 ;
11 ;
12 ;
2 ;WMIDD Ag District Full Area Precip and Forecast; 14 ; 12 ;-1 ;FTP_ON;UNITS_OFF
1 ;-11301 ,-10301 ;Hourly Rainfall;Ag Area Adjusted & Raw Radar w/NWS Forecast; 1 ; 3 ; 0 ; 14085615 ; 15921132 ; 16711680 ; 255 ; 0 ; 0 ; 0 ; 2
2 ;-1301 ,-30301 ;Flow;Ag Area Water Order Reduction Adjusted & Gross; 1 ; 2 ; 0 ; 14085615 ; 15921132 ; 16711680 ; 255 ; 0 ; 0 ; 0 ; 0
3 ;-25305 ;fraction;WMIDD Main Canal % of Max Flow; 0 ; 1 ; 0 ; 14085615 ; 15921132 ; 16711680 ; 255 ; 0 ; 0 ; 0 ; 0
4 ; 1305 , 1306 ;Flow; WMIDD Main Canal & Main Drain; 0 ; 3 ; 0 ; 14085615 ; 15921132 ; 16711680 ; 255 ; 0 ; 0 ; 0 ; 0
5 ;
6 ;
7 ;
8 ;
9 ;
10 ;
11 ;
12 ;
3 ;Gila R Flows; 14 ; 12 ;-1 ;FTP_ON;UNITS_OFF
1 ; 1308 , 1309 ;Flow;USGS Dateland & Painted Rock; 1 ; 3 ; 0 ; 14085615 ; 15921132 ; 16711680 ; 255 ; 0 ; 0 ; 0 ; 0
2 ;-1300 , 1300 ;Flow;Gila R nr Dome GRT Model & USGS; 1 ; 3 ;-1 ; 14085615 ; 15921132 ; 16711680 ; 255 ; 800 ; 0 ; 0 ; 0 ; 1 ; 2.8905 ; 0.5836 ; 0.24
3 ;-1 ;Web Screen;https://water.weather.gov/resources/hydrographs/slpa3_hg.png; 0 ; 10 ; 17 ; 0 ; 1
4 ;-1 ;Web Screen;https://water.weather.gov/resources/hydrographs/gida3_hg.png; 0 ; 10 ; 17 ; 0 ; 1
5 ;
6 ;
7 ;
8 ;
9 ;
10 ;
11 ;
12 ;
4 ;Side Inflow Adjusted Radar Rainfall; 10 ; 9 ;-1 ;FTP_ON;UNITS_OFF
1 ;-11101 ,-11107 ;Rainfall;Subs 1a & 7 at Gage ; 1 ; 3 ; 0 ; 0 ; 13619151 ; 16711680 ; 16711680 ; 0 ; 0 ; 0 ; 2
2 ;-11102 ;Rainfall;Sub 2 North Mtns; 1 ; 3 ; 0 ; 0 ; 13619151 ; 16711680 ; 16711680 ; 0 ; 0 ; 0 ; 2
3 ;-11103 ;Rainfall;Sub 3 North Mtns; 1 ; 3 ; 0 ; 0 ; 13619151 ; 16711680 ; 16711680 ; 0 ; 0 ; 0 ; 2
4 ;-11104 ;Rainfall;Subs 4 Back N. Mtns; 1 ; 3 ; 0 ; 0 ; 13619151 ; 16711680 ; 16711680 ; 0 ; 0 ; 0 ; 2
5 ;-11106 ;Rainfall;Sub 1b (6) South Mtns ; 1 ; 3 ; 0 ; 0 ; 13619151 ; 16711680 ; 16711680 ; 0 ; 0 ; 0 ; 2
6 ;-11105 ;Rainfall;Sub 5 Back North Mtns; 1 ; 3 ; 0 ; 0 ; 13619151 ; 16711680 ; 16711680 ; 0 ; 0 ; 0 ; 2
7 ;-11108 ;Rainfall;Sub 8 Army Range; 1 ; 3 ; 0 ; 0 ; 13619151 ; 16711680 ; 16711680 ; 0 ; 0 ; 0 ; 2
8 ;-11109 ,-11110 ;Rainfall;Subs 9 Castle & 10 Kings; 1 ; 3 ; 0 ; 0 ; 13619151 ; 16711680 ; 16711680 ; 0 ; 0 ; 0 ; 2
9 ;-30101 ,-30107 ,-30102 ;Flow;Subs 1a, 7 & 2 Runoff; 0 ; 3 ; 0 ; 14085615 ; 15921132 ; 16711680 ; 255 ; 0 ; 0 ; 0 ; 0
10 ;-30103 ,-30104 ;Flow;Subs 3, &4 Runoff; 0 ; 3 ; 0 ; 14085615 ; 15921132 ; 16711680 ; 255 ; 0 ; 0 ; 0 ; 0
11 ;-30106 ,-30105 ,-30108 ;Flow;Subs 1b (6), 5 & 8 Runoff; 0 ; 3 ; 0 ; 14085615 ; 15921132 ; 16711680 ; 255 ; 0 ; 0 ; 0 ; 0
12 ;-30109 ,-30110 ;Flow;Subs 9 & 10 Runoff; 0 ; 3 ; 0 ; 14085615 ; 15921132 ; 16711680 ; 255 ; 0 ; 0 ; 0 ; 0
5 ;WMIDD Ag District Weather Forecast; 14 ; 12 ;-1 ;FTP_ON;UNITS_OFF
1 ; 17301 ;Temperature;Temperature; 0 ; 3 ; 0 ; 14085615 ; 15921132 ; 16711680 ; 255 ; 0 ; 32 ; 0 ; 0
2 ; 18301 ;Humidity;Humidity; 0 ; 3 ; 0 ; 14085615 ; 15921132 ; 16711680 ; 255 ; 0 ; 0 ; 0 ; 0
3 ; 28301 , 28207 , 28202 ;Wind Speed;Wind Speed WMIDD#2, WMIDD, Yuma; 0 ; 3 ; 0 ; 14085615 ; 15921132 ; 16711680 ; 255 ; 0 ; 0 ; 0 ; 0
4 ; 26301 ;Cloud Cover;Cloud Cover; 0 ; 3 ; 0 ; 14085615 ; 15921132 ; 16711680 ; 255 ; 0 ; 0 ; 0 ; 0
5 ;-29301 , 29202 ;Solar Radiation;Solar Radiation Computed & Gage; 0 ; 3 ; 0 ; 14085615 ; 15921132 ; 16711680 ; 255 ; 0 ; 0 ; 0 ; 0
6 ;-27301 ;ETshort;Evapotranspiration; 0 ; 2 ; 0 ; 14085615 ; 15921132 ; 16711680 ; 255 ; 0 ; 0 ; 0 ; 0
7 ;
8 ;
9 ;
10 ;
11 ;
12 ;
6 ;WMIDD Area Cams, Spring Runoff, Flooding, & 24-Hr Precip Forecast; 0 ; 0 ; 0 ;FTP_ON;UNITS_OFF
1 ;-1 ;Web Screen;C:\GetProjects\GetDome\GetNexrad\GetNexrad_windowUSA_2.png; 0 ; 10 ; 17 ; 0 ; 1
2 ;-1 ;Web Screen;C:\GetProjects\GetDome\GetGraphs\SnowJob.png; 0 ; 10 ; 17 ; 0 ; 1
3 ;-1 ;Web Screen;https://www.az511.gov/map/Cctv/4044--15; 0 ; 10 ; 17 ; 0 ; 1
4 ;-1 ;Web Screen;https://www.az511.com/map/Cctv/4568--15; 0 ; 10 ; 17 ; 0 ; 1
5 ;
6 ;
7 ;
8 ;
9 ;
10 ;
11 ;
12 ;
7 ;Gila River Flood Stage; 16 ; 16 ;-1 ;FTP_ON;UNITS_OFF
1 ;-2300 , 2300 ;Gage Height;Gila River at Dome GRT and USGS; 0 ; 3 ; 0 ; 14085615 ; 16777215 ; 16711680 ; 255 ; 20 ; 0 ; 0 ; 0 ; 4 ; 24 ; 26 ; 30
2 ;
3 ;
4 ;
5 ;
6 ;
7 ;
8 ;
9 ;
10 ;
11 ;
12 ;
END
GetRealtime_setup.txt file example for WMIDD:
Future Days=7
Percent Missing Allowed= 100%
Write Dailys= True
Write Hourly Avg= True
Write Daily Max= True
Write Unit Values= True
Write Unit Shifts= False
Overwrite Protected Source 5= True
Check for Possible Bad Values= False
Possible Bad Value Change= 300%
Last Runoff Run's Storage= True
Minutes between retrievals=60
Max hours of radar=1
Save Radar greater than= False
Beep on Save= False
Delete temporary internet files=True
Loop radar boundaries=True
Use Nexrad Ridge1 full web file listing=False
Use Nexrad short web file listing=False
Use Nexrad Ridge2 Iowa State Mesonet=True
Use Nowcast 70R30 line=False
Compact and Backup HDB at midnight= True
GetAccess.exe folder=C:\GETPROJECTS\GETDOME\GETACCESS\
GetGraphs.exe folder=C:\GETPROJECTS\GETDOME\GETGRAPHS\
GetNexrad.exe folder=C:\GETPROJECTS\GETDOME\GETNEXRAD\
NowCast Info folder=C:\GETPROJECTS\GETDOME\GETNEXRAD\
Gage Avg OnOff folder=C:\GETPROJECTS\GETDOME\GETGRAPHS\
Radar Boundary File folder=C:\GETPROJECTS\GETDOME\GETREALTIME\BOUNDARIES\
Menu Pic=C:\GETPROJECTS\GETDOME\GETREALTIME\CORONATIONPK_ WORKERS.JPG
Menu Text Color= 5869787
Minimize to System Tray=True
Column Widths=4932,1620,840,4752,552,4392,3000
Alert Address=
Alert Address CC=
Alert Address BCC=
Alert Start Time=-1
Don't Ask Questions=True
Create Winds Aloft graphic file=True
Metric Units=False
Shell Timed Out Minutes=3.0
Database Connection String=Provider=Microsoft.Jet.OLEDB.4.0;Data Source=C:\GetProjects\GetDome\GetAccess\GetAccessHDB_DOME.mdb;User Id=admin;Password=;
Station_ID; Datatype_Site_ID; Datatype_Name; Site_Name; base1; shift1; formula1; base2; shift2; formula2; base3; shift3; formula3
********; *********; *********; **** USGS FLOW GAGES *************************
09522700; 1305; Flow; WELLTON-MOHAWK MAIN CANAL NEAR YUMA, AZ
09529300; 1306; Flow; WELLTON-MOHAWK MAIN OUTLET DRAIN NR YUMA, AZ
09520500; 1300; Flow; GILA RIVER NEAR DOME, AZ
09520500; 2300; Stage; GILA RIVER NEAR DOME, AZ
FORECAST-NWS,GDTA3; 1308; Flow; GILA RIVER NEAR DATELAND, AZ
09520280; 1308; Flow; GILA RIVER NEAR DATELAND, AZ
09519800; 1309; Flow; GILA RIVER BELOW PAINTED ROCK DAM, AZ
*******; ********; *********; ***NWS FORECASTS *****************
FORECAST-NWS; -11301; Rainfall; NWS FORECAST WMIDD Ag Area, AZ; -1; 32.677,-114.115, 2
FORECAST-NWS; -11101; Rainfall; NWS FORECAST Subbasin 1; -1; 32.677,-114.115, 2
FORECAST-NWS; -11102; Rainfall; NWS FORECAST Subbasin 2; -1; 32.677,-114.115, 2
FORECAST-NWS; -11103; Rainfall; NWS FORECAST Subbasin 3; -1; 32.677,-114.115, 2
FORECAST-NWS; -11104; Rainfall; NWS FORECAST Subbasin 4; -1; 32.677,-114.115, 2
FORECAST-NWS; -11105; Rainfall; NWS FORECAST Subbasin 5; -1; 32.677,-114.115, 2
FORECAST-NWS; -11106; Rainfall; NWS FORECAST Subbasin 6; -1; 32.677,-114.115, 2
FORECAST-NWS; -11107; Rainfall; NWS FORECAST Subbasin 7; -1; 32.677,-114.115, 2
FORECAST-NWS; -11108; Rainfall; NWS FORECAST Subbasin 8; -1; 32.677,-114.115, 2
FORECAST-NWS; -11109; Rainfall; NWS FORECAST Subbasin 9; -1; 32.677,-114.115, 2
FORECAST-NWS; -11110; Rainfall; NWS FORECAST Subbasin 10; -1; 32.677,-114.115, 2
FORECAST-NWS; 17301; Temperature; NWS FORECAST WMIDD Ag Area, AZ; -1; 32.677,-114.115
FORECAST-NWS; 18301; Humidity; NWS FORECAST WMIDD Ag Area, AZ; -1; 32.677,-114.115
FORECAST-NWS; 28301; Wind Speed; NWS FORECAST WMIDD Ag Area, AZ; -1; 32.677,-114.115
FORECAST-NWS; 26301; Cloud Amount; NWS FORECAST WMIDD Ag Area, AZ; -1; 32.677,-114.115
*******; ********; *********; *** RADAR *****************
NEXRAD-YUX; -10101; Precip; Sub1a Gila Mtns
NEXRAD-YUX; -10106; Precip; Sub1b Gila Mtns
NEXRAD-YUX; -10102; Precip; Sub2 Muggins Mtns
NEXRAD-YUX; -10103; Precip; Sub3 Muggins Mtns
NEXRAD-YUX; -10104; Precip; Sub4 Otherside Muggins Mtns
NEXRAD-YUX; -10105; Precip; Sub5 Otherside Muggins Mtns
NEXRAD-YUX; -10107; Precip; Sub7 Laguna Mtns at Dome Gage
NEXRAD-YUX; -10108; Precip; Sub8 Army Range
NEXRAD-YUX; -10109; Precip; Sub9 Castle Dome Mtns
NEXRAD-YUX; -10110; Precip; Sub10 Valley of The Kings
NEXRAD-YUX; -10201; Precip; Gage WMIDD-Wellton, AZ
NEXRAD-YUX; -10202; Precip; Yuma East, AZ, AZ
**NEXRAD-YUX; -10203; Precip; Gage GM DPG, AZ
NEXRAD-YUX; -10204; Precip; Gage River House, AZ
NEXRAD-YUX; -10205; Precip; Gage DATELAND, AZ
NEXRAD-YUX; -10206; Precip; Gage Columbus Wash, AZ
NEXRAD-YUX; -10301; Precip; Wellton-mohawk Ag Area, AZ
********; *********; *********; **** RAIN GAGES *************************
KAZWELLT7; 10201; Rainfall; WMIDD-Wellton, AZ
KAZWELLT7; 17301; Temperature; WMIDD Ag Area, AZ
KAZWELLT7; 18301; Humidity; WMIDD Ag Area, AZ
KAZWELLT7; 28207; Wind Speed; WMIDD Ag Area, AZ (dirty Anometer)
KAZYUMA141; 10202; Rainfall; Yuma East, AZ
KAZYUMA141; 28202; Wind Speed; Yuma East, AZ
KAZYUMA141; 29202; Solar; Yuma East, AZ; 0; 0; 2.065*P1
**KAZYUMA28; 10203; Rainfall; GM DPG, AZ
KAZYUMA147; 10204; Rainfall; East Mesa 53rd Dr, AZ
KAZYUMA147; 29202; Solar; East Mesa 53rd Dr, AZ; 0; 0; 2.065*P1
KAZROLL4; 10207; Rainfall; Roll WMIDD Ag Area, AZ
KAZROLL4; 17207; Temperature; Roll WMIDD Ag Area, AZ
KAZROLL4; 18207; Humidity; Roll WMIDD Ag Area, AZ
KAZROLL4; 28301; Wind Speed; Roll WMIDD Ag Area, AZ
09520280; 10205; Rainfall; GILA RIVER NEAR DATELAND, AZ
MW-AZ131; 10206; Rainfall; Columbus Wash, AZ
*******; ********; *********; *** COMPUTE WEATHER *****************
COMPUTE; -29301; Solar Radiation; WMIDD Ag Area, AZ; 0; 32.677,-114.115,-105,288
COMPUTE; -27301; ET Short; WMIDD Ag Area, AZ; 0; 32.677,-114.115,-105, 285, 1
*******; *********; *********; **** AVERAGE & RATIO *************************
COMPUTE-hour; 10209; Rainfall; Avg Rain Gages; 0; 0; (P1+P2+P3+P4)/N
COMPUTE-hour; -10209; Rainfall; Avg Radars; 0; 0; (P1+P2+P3+P4)/N
COMPUTE-hour; 10210; Rainfall; Avg Rain Gages; 0; 0; (P1+P2+P3)/N
COMPUTE-hour; -10210; Rainfall; Avg Radars; 0; 0; (P1+P2+P3)/N
COMPUTE-Hour; 31209; Ratio; West Area Gage/radar; 0; 0.02,1, 2; P1/P2
COMPUTE-Hour; 31210; Ratio; East Area Gage/radar; 0; 0.02,1, 2; P1/P2
*******; *********; *********; ****ADJUST RADAR*************************
COMPUTE-unit; -11101; Precip; Sub1a South Mtns; 0; -1, 1, 0.25, 0.50; P1*P2
COMPUTE-unit; -11106; Precip; Sub1b South Mtns; 0; -1, 1, 0.25, 0.50; P1*P2
COMPUTE-unit; -11102; Precip; Sub2 North Mtns; 0; -1, 1, 0.25, 0.50; P1*P2
COMPUTE-unit; -11103; Precip; Sub3 North Mtns; 0; -1, 1, 0.25, 0.50; P1*P2
COMPUTE-unit; -11104; Precip; Sub4 Otherside North Mtns; 0; -1, 1, 0.25, 0.50; P1*P2
COMPUTE-unit; -11105; Precip; Sub5 Otherside North Mtns; 0; -1, 1, 0.25, 0.50; P1*P2
COMPUTE-unit; -11107; Precip; Sub7 Laguna Mtns at Dome Gage; 0; -1, 1, 0.25, 0.50; P1*P2
COMPUTE-unit; -11108; Precip; Sub8 Army Range; 0; -1, 1, 0.25, 0.50; P1*P2
COMPUTE-unit; -11109; Precip; Sub9 Castle Dome Mtns; 0; -1, 1, 0.25, 0.50; P1*P2
COMPUTE-unit; -11110; Precip; Sub10 Valley of The Kings; 0; -1, 1, 0.25, 0.50; P1*P2
COMPUTE-Hour; -11301; Rainfall; Adjusted Radar WMIDD Ag Area; 0; -1, 1, 0.25, 0.50; P1*P2
*******; *********; *********; **** Side Inflow *************************
COMPUTE-Unit; -30101; RUNOFF; Sub1a South Mtns West Gila R; 4; 1, 71, 0.10, 0, 12.6, 0.4, 0.3, 0.2, 1.2, 0.05, 1.7, 94, 70, 0.995, 1, 5, 0.1, 0.8, 0.04, .5, 0, 0.2, 0, 0.7, 0, Lag0; P1; 0; SWDesertCoPlateau.DGF
COMPUTE-Unit; -30106; RUNOFF; Sub1b South Mtns East Gila R; 0; 1.5, 68, 0.10, 0, 52.0, 0.4, 0.3, 0.5, 1.5, 0.2, 3.0, 93, 67, 0.995, 1, 5, 0.1, 0.8, 0.04, 1, 0, 0.2, 0, 0.7, 0, Lag0; P1; 0; SWDesertCoPlateau.DGF
COMPUTE-Unit; -30102; RUNOFF; Sub2 North Mtns Gila R; 0; 1.5, 71, 0.10, 0, 18.8, 0.4, 0.3, 0.5, 1.5, 0.2, 3.0, 94, 70, 0.995, 1, 5, 0.1, 0.8, 0.04, 1, 0, 0.2, 0, 0.7, 0, Lag0; P1; 0; SWDesertCoPlateau.DGF
COMPUTE-Hour; -30103; RUNOFF; Sub3 North Mtns Gila R; 0; 2, 71, 0.10, 0, 48.1, 0.4, 0.3, 0.5, 1.5, 0.2, 3.0, 94, 70, 1, 1, 5, 0.1, 0.8, 0.04, 1, 0, 0.2, 0, 0.7, 0, Lag0; P1; 0; SWDesertCoPlateau.DGF
COMPUTE-Hour; -30104; RUNOFF; Sub4 North Back Mtns Gila R; 0; 3, 71, 0.10, 0, 21.3, 0.4, 0.3, 0.5, 1.5, 0.2, 3.0, 94, 70, 1, 1, 5, 0.1, 0.8, 0.04, 1, 0, 0.2, 0, 0.7, 0, Lag0; P1; 0; SWDesertCoPlateau.DGF
COMPUTE-Hour; -30105; RUNOFF; Sub5 Otherside North Mtns; 0; 3, 76, 0.10, 0, 23.7, 0.4, 0.25, 0.5, 1.5, 0.2, 3.0, 96, 75, 1, 1, 5, 0.1, 0.8, 0.04, 1, 0, 0.2, 0, 0.7, 0, Lag0; P1; 0; SWDesertCoPlateau.DGF
COMPUTE-Unit; -30107; RUNOFF; Sub7 Laguna Mtns at Dome Gage; 0; 1, 71, 0.10, 0, 7.56, 0.4, 0.3, 0.2, 1.2, 0.05, 1.7, 94, 70, 1, .1, 5, 0.1, 0.8, 0.04, 1, 0, 0.2, 0, 0.7, 0, Lag0; P1; 0; SWDesertCoPlateau.DGF
COMPUTE-Hour; -30108; RUNOFF; Sub8 Army Range; 0; 4, 66, 0.10, 0, 177, 0.4, 0.3, 0.5, 1.5, 0.2, 3.0, 92, 65, 1, 1, 5, 0.1, 0.8, 0.04, 1, 0, 0.2, 0, 0.7, 0, Lag0; P1; 0; SWDesertCoPlateau.DGF
COMPUTE-Hour; -30109; RUNOFF; Sub9 Castle Dome Mtns; 0; 4, 66, 0.10, 0, 225, 0.4, 0.17, 0.5, 1.5, 0.2, 3.0, 92, 65, 0.995, 1, 5, 0.1, 0.8, 0.04, 1, 0, 0.2, 0, 0.7, 0, Lag0; P1; 0; SWDesertCoPlateau.DGF
COMPUTE-Hour; -30110; RUNOFF; Sub10 Valley of The Kings; 0; 7, 66, 0.10, 0, 633, 0.4, 0.17, 0.5, 1.5, 0.2, 3.0, 92, 65, 0.995, 1, 5, 0.1, 0.8, 0.04, 1, 0, 0.2, 0, 0.7, 0, Lag0; P1; 0; SWDesertCoPlateau.DGF
ROUTE-HOUR; -1300; Runoff; Compined Subs With Gila R Dateland; 5
Lookup; -2300; Stage; Gila River at Dome
COMPUTE-Hour; -1299; RUNOFF; Get Routed Runoff at Dome; -99; 0; 1*P1
COMPUTE-Hour; -1299; RUNOFF Forecast; Replace With USGS History at Dome; D=Now(); 0; P1
ROUTE-HOUR; -1400; Runoff; Route Dome & Forecast to Colorado River
*******; ********; *********; *** EFFECTIVE WATER ORDER FLOW (runoff Calc) *****************
COMPUTE-Hour; -30301; REPLACED FLOW; WMIDD Water Replacement Estimate; 0; 1, 81, 0.10, 0, 119, 0.4, 0.17, 0.6, 1, 0.1, 2, 100, 90, 0, 1, 0, 0.1, 0.3, 0.05, 1, 0, 0.2, 0, 0.7, -1, Lag0; P1; 1.129; Clark UGF
COMPUTE-Hour; -25305; Fraction; WMIDD Main Canal % of Max Flow; 0; FILL; P1/900
COMPUTE-Hour; -1301; Adjusted Runoff; Effective WMIDD Area Water Replacement; 0; 0; P1*P2
*******; ********; *********; *** SHELL *****************
SHELL-C:\GetProjects\GetDome\GetGraphs\SnowJob.exe mywebsitepassword; 0; Snowjob; Snowpack/forcast Runoff Graph Save; 0
SHELL-C:\GetProjects\GetDome\GetNexrad\GetNexrad.exe -2 mywebsitepassword; 0; Picture; Current Radar Over District to Web; 0
SHELL-C:\GetProjects\GetDome\GetNexrad\GetNexrad.exe -2 GetNexradFiles2.txt; 0; Picture; Nexrad 24-Hr Picture Save; 0
SHELL-C:\GetProjects\GetDome\GetGraphs\GetGraphs.exe 4 mywebsitepassword; 0; Graphs; Getgraphs to Web; 0
END
Routing file example for WMIDD:
Route Hourly USGS Dateland Gage & Side Subs to Dome
GET 3 1308 Gila R at Dateland
ROUTE Modpul GilaChannelReservoir.RAT -2 0.9 evap ''channel loss
ROUTE Muskingum-Cunge DatelandToSub10.RAT
GET 3 -30110 Sub10 Valley of the Kings
ROUTE Modpul SouthMtnChannelReservoir.RAT -2 0.9 evap ''channel loss
COMBINE
ROUTE Modpul SouthMtnChannelReservoir.RAT -2 0.9 evap ''channel loss
ROUTE Muskingum-Cunge Sub10ToSub3.RAT
GET 3 -30109 Sub9 Kofa Mtns
ROUTE Modpul SouthMtnChannelReservoir.RAT -2 0.9 evap ''channel loss
COMBINE
GET 3 -30103 Sub3 North Mtns Gila R
ROUTE Modpul SouthMtnChannelReservoir.RAT -2 0.9 evap ''channel loss
COMBINE
ROUTE Muskingum-Cunge Sub3ToSub1b.RAT
GET 3 -30106 Sub1B South Mtns East Gila R
COMBINE
ROUTE Muskingum-Cunge Sub1bToDome.RAT
GET 3 -30105 Sub5 North Back Mtns Gila R
ROUTE Tatum 6 hour shift
COMBINE
GET 3 -30104 Sub4 North Back Mtns Gila R
ROUTE Tatum 6 hour shift
COMBINE
GET 3 -30108 Sub8 Army Range
ROUTE Tatum 6 hour shift
COMBINE
GET 3 -30102 Sub2 North Mtns Gila R
ROUTE Tatum 6 hour shift
COMBINE
GET 3 -30101 Sub1A South Mtns West Gila R
ROUTE Tatum 6 hour shift
COMBINE
GET 3 -30107 Sub7 Laguna Mtns at Dome Gage
ROUTE Tatum 6 hour shift
COMBINE
END
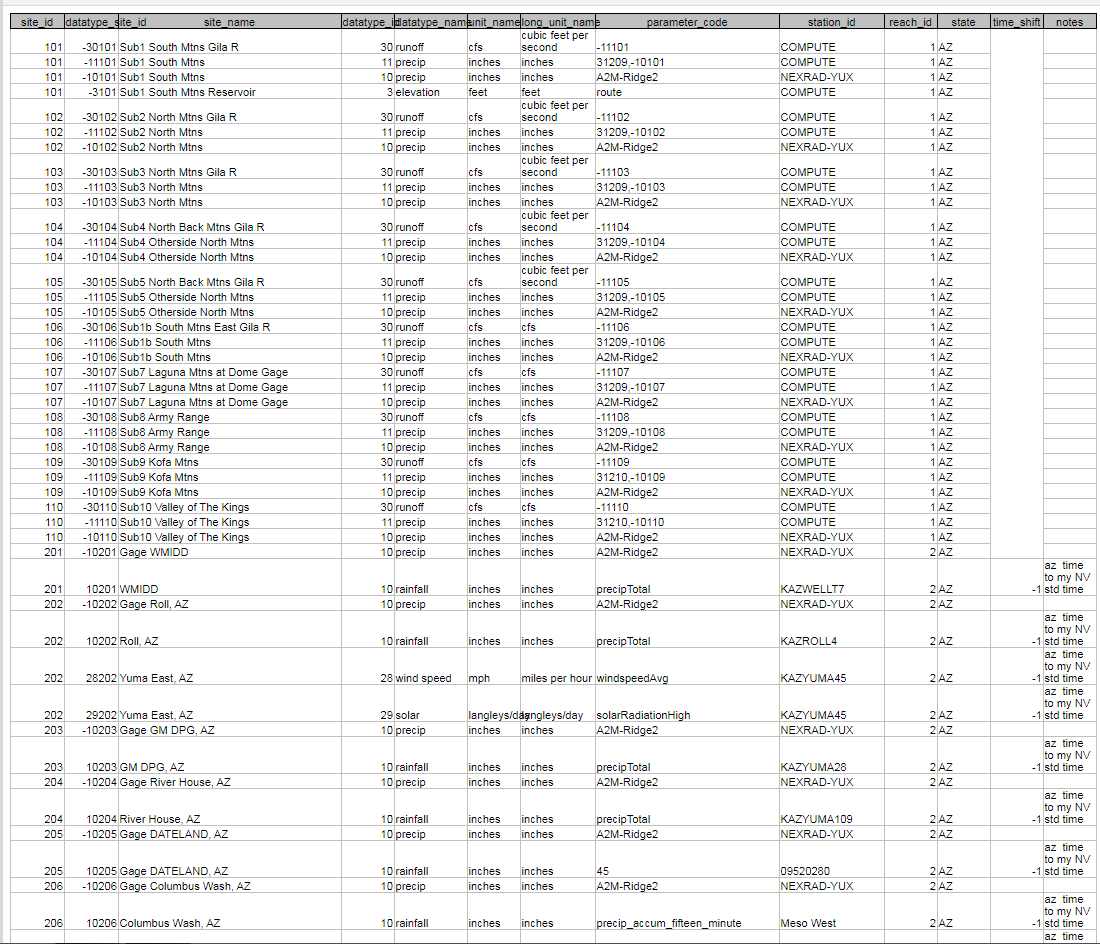
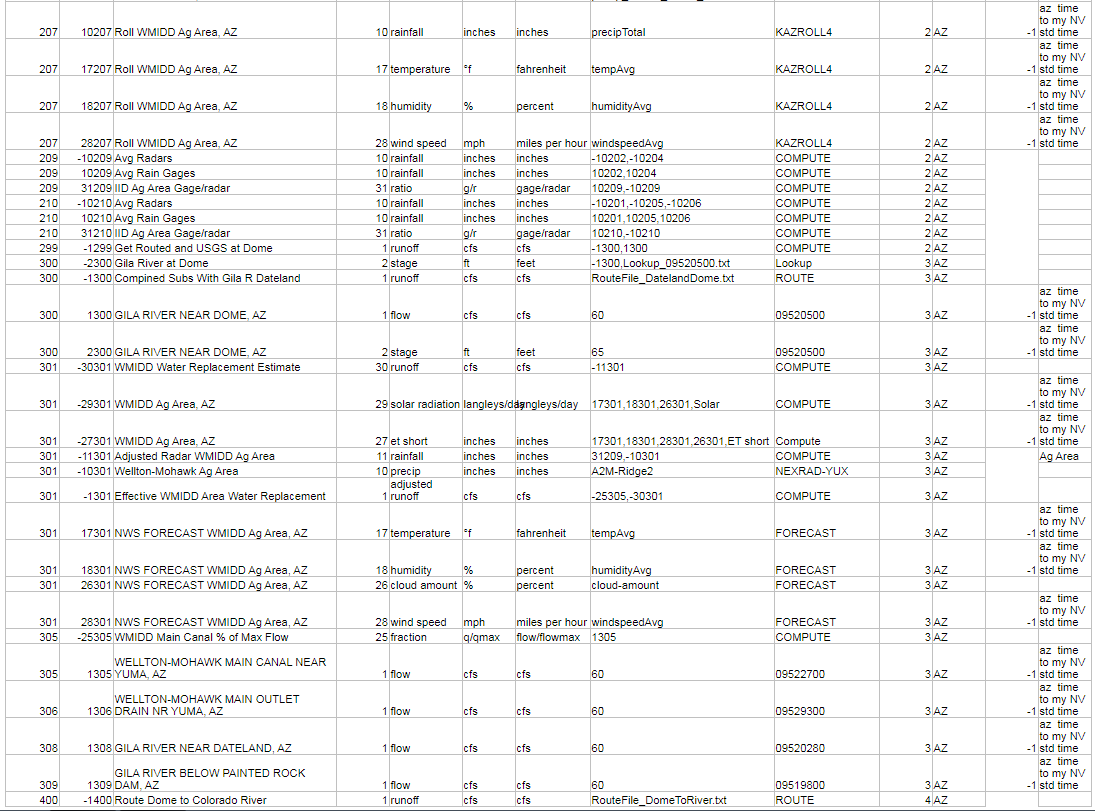
Access table rsite for WMIDD:
GetRealTime Setup file for
Automated Hec-RAS Desert Rainfall Runoff Inflow Routing to Imperial Dam:
Future Days=6
Percent Missing Allowed= 100%
Write Dailys= True
Write Hourly Avg= True
Write Daily Max= True
Write Unit Values= True
Write Unit Shifts= False
Overwrite Protected Source 5= True
Check for Possible Bad Values= False
Possible Bad Value Change= 300%
Last Runoff Run's Storage= True
Minutes between retrievals=60
Max hours of radar=2
Save Radar greater than= False
Beep on Save= False
Delete temporary internet files=True
Loop radar boundaries=True
Use Nexrad Ridge1 full web file listing=False
Use Nexrad short web file listing=False
Use Nexrad Ridge2 Iowa State Mesonet=True
Use Nowcast 70R30 line=False
Compact and Backup HDB at midnight= True
GetAccess.exe folder=C:\GETPROJECTS\GETIMPERIAL\GETACCESS\
GetGraphs.exe folder=C:\GETPROJECTS\GETIMPERIAL\GETGRAPHS\
GetNexrad.exe folder=C:\GETPROJECTS\GETIMPERIAL\GETNEXRAD\
NowCast Info folder=C:\GETPROJECTS\GETIMPERIAL\GETNEXRAD\
Gage Avg OnOff folder=C:\GETPROJECTS\GETIMPERIAL\GETGRAPHS\
Radar Boundary File folder=C:\GETPROJECTS\GETIMPERIAL\GETREALTIME\BOUNDARIES\
Menu Pic=C:\GETPROJECTS\GETIMPERIAL\GETREALTIME\TWO_MOHAVE_BRAVES.JPG
Menu Text Color= 0
Minimize to System Tray=True
Column Widths=2130,1620,840,5430,555,5265,3000
Alert Address=
Alert Address CC=
Alert Address BCC=
Alert Start Time=-1
Don't Ask Questions=True
Create Winds Aloft graphic file=False
Metric Units=False
Shell Timed Out Minutes=3.0
Bad/Missing Stations Allowed=10
Database Connection String=Provider=Microsoft.Jet.OLEDB.4.0;Data
Source=C:\GetProjects\GetImperial\GetAccess\GetAccessImperialHDB.mdb;User
Id=admin;Password=;
Station_ID; Datatype_Site_ID; Datatype_Name; Site_Name; base1; shift1; formula1;
base2; shift2; formula2; base3; shift3; formula3
MADIS; 0; Weather; Along Lower Colorado River; 3; 32.8288, -115.0459, 33.9956,
-113.9343; just rain
USBRLC-14646,14650; 1601; Scheduled Flow; Colorado River at Parker Gage
(headgate Gen+bypass)
*******; ********; *********; ***NWS FORECASTS *****************
FORECAST-NWS; -11106; Rainfall; FORECAST Ehernberg Wash; 0; 33.4504,-114.4503, 2
FORECAST-NWS; -11105; Rainfall; FORECAST Mohave Wash; 0; 33.4504,-114.4503, 2
FORECAST-NWS; -11104; Rainfall; FORECAST Gould Wash; 0; 33.1973,-114.5496, 2
FORECAST-NWS; -11102; Rainfall; FORECAST Yuma Wash; 0; 33.1973,-114.5496, 2
FORECAST-NWS; -11101; Rainfall; FORECAST Martinez Wash; 0; 33.1973,-114.5496, 2
FORECAST-NWS; -11103; Rainfall; FORECAST Milpitis Wash; 0; 33.2197,-114.9499, 2
*******; ********; *********; *** RADAR *****************
NEXRAD-YUX; -10106; Precip; Ehernberg Wash, AZ
NEXRAD-YUX; -10105; Precip; Mohave Wash, AZ
NEXRAD-YUX; -10104; Precip; Gould Wash, AZ
NEXRAD-YUX; -10103; Precip; Milpitas Wash, AZ
NEXRAD-YUX; -10102; Precip; Yuma Wash, AZ
NEXRAD-YUX; -10101; Precip; Martinez Wash, AZ
NEXRAD-YUX; -10301; Rainfall; Apache Loop 2 Ehernberg, AZ
NEXRAD-YUX; -10302; Rainfall; FWS R2 PORT #2, AZ
NEXRAD-YUX; -10303; Rainfall; CIBOLA, AZ
NEXRAD-YUX; -10304; Rainfall; Parker2, AZ
*******; ********; *********; *** HRRR RADAR FORECAST *****************
HRR-YUX; -11106; Precip; Ehernberg Wash, AZ; 0; 12
HRR-YUX; -11105; Precip; Mohave Wash, AZ; 0; 12
HRR-YUX; -11104; Precip; Gould Wash, AZ; 0; 12
HRR-YUX; -11103; Precip; Milpitas Wash, AZ; 0; 12
HRR-YUX; -11102; Precip; Yuma Wash, AZ; 0; 12
HRR-YUX; -11101; Precip; Martinez Wash, AZ; 0; 12
********; *********; *********; **** Takes 2 Attemps to Get Schedule
*************************
**USBRLC-14646,14650; 1601; Scheduled Flow; Colorado River at Parker Gage
(headgate Gen+bypass)
********; *********; *********; **** RAIN GAGES *************************
KAZEHREN9; 10301; Rainfall; Apache Loop 2 Ehernberg, AZ
MA-TS560; 10302; Rainfall; FWS R2 PORT #2, AZ; 5ea1aaf3289f487480adf6b9b02b
MA-CBRA3; 10303; Rainfall; CIBOLA, AZ; 5ea1aaf3289f487480adf6b9b02b
MA-AZM35; 10304; Rainfall; Parker2, AZ; 5ea1aaf3289f487480adf6b9b027
*******; *********; *********; **** AVERAGE & RATIO *************************
COMPUTE-hour; 10201; Rainfall; Avg South Rain Gages; 0; 0; (P1+P2+P3)/N
COMPUTE-hour; -10201; Rainfall; Avg South Radars; 0; 0; (P1+P2+P3)/N
COMPUTE-hour; 10202; Rainfall; Avg North Gages; 0; 0; (P1+P2+P3)/N
COMPUTE-hour; -10202; Rainfall; Avg North Radars; 0; 0; (P1+P2+P3)/N
COMPUTE-Hour; 31201; Ratio; South Gage/radar; 0; 0.02,1, 2; P1/P2
COMPUTE-Hour; 31202; Ratio; North Gage/radar; 0; 0.02,1, 2; P1/P2
*******; *********; *********; ****ADJUST RADAR*************************
COMPUTE-unit; -11101; Adj Precip; Sub1 Martinez Wash; 0; -1, 1, 0.25, 0.50;
P1*P2
COMPUTE-unit; -11102; Adj Precip; Sub2 Yuma Wash; 0; -1, 1, 0.25, 0.50; P1*P2
COMPUTE-unit; -11103; Adj Precip; Sub3 Milpitas Wash; 0; -1, 1, 0.25, 0.50;
P1*P2
COMPUTE-unit; -11104; Adj Precip; Sub4 Gould Wash; 0; -1, 1, 0.25, 0.50; P1*P2
COMPUTE-unit; -11105; Adj Precip; Sub5 Mohave Wash; 0; -1, 1, 0.25, 0.50; P1*P2
COMPUTE-unit; -11106; Adj Precip; Sub6 Ehernberg Wash; 0; -1, 1, 0.25, 0.50;
P1*P2
*******; *********; *********; ****RUNOFF*************************
COMPUTE-Hour; -30101; RUNOFF; Sub1 Martinez Wash; 0; 5.25, 66, 0.10, 0, 405,
0.4, 0.17, 0.5, 1.5, 0.2, 3.0, 92, 65, 0.995, 1, 5, 0.1, 0.8, 0.04, 1, 0, 0.2,
0, 0.7, 0, Lag0; P1; 0; SWDesertCoPlateau.DGF
COMPUTE-Hour; -30102; RUNOFF; Sub2 Yuma Wash AZ-CA; 0; 2, 66, 0.10, 0, 276, 0.4,
0.17, 0.5, 1.5, 0.2, 3.0, 92, 65, 0.995, 1, 5, 0.1, 0.8, 0.04, 1, 0, 0.2, 0,
0.7, 0, Lag0; P1; 0; SWDesertCoPlateau.DGF
COMPUTE-Hour; -30103; RUNOFF; Sub3 Lower Milpitas Wash; 0; 6.5, 66, 0.10, 0,
254, 0.4, 0.17, 0.5, 1.5, 0.2, 3.0, 92, 65, 0.995, 1, 5, 0.1, 0.8, 0.04, 1, 0,
0.2, 0, 0.7, 0, Lag0; P1; 0; SWDesertCoPlateau.DGF
COMPUTE-Hour; -30104; RUNOFF; Sub4 Gould Wash, AZ-CA; 0; 5.5, 66, 0.10, 0, 288,
0.4, 0.17, 0.5, 1.5, 0.2, 3.0, 92, 65, 0.995, 1, 5, 0.1, 0.8, 0.04, 1, 0, 0.2,
0, 0.7, 0, Lag0; P1; 0; SWDesertCoPlateau.DGF
COMPUTE-Hour; -30105; RUNOFF; Sub5 Mohave Wash; 0; 6, 66, 0.10, 0, 133, 0.4,
0.17, 0.5, 1.5, 0.2, 3.0, 92, 65, 0.995, 1, 5, 0.1, 0.8, 0.04, 1, 0, 0.2, 0,
0.7, 0, Lag0; P1; 0; SWDesertCoPlateau.DGF
COMPUTE-Hour; -30106; RUNOFF; Sub6 Ehrenberg Wash; 0; 4.5, 66, 0.10, 0, 242,
0.4, 0.17, 0.5, 1.5, 0.2, 3.0, 92, 65, 0.995, 1, 5, 0.1, 0.8, 0.04, 1, 0, 0.2,
0, 0.7, -1, Lag0; P1; 0; SWDesertCoPlateau.DGF
COMPUTE-hour; -6106; SCS CN; Sub6 Ehrenberg Wash; 0; 0; 1000/(P1+10)
COMPUTE-hour; -5106; Soil Runoff Fraction; Sub6 Flood Potential; 0; 0; 0;
P2>0.2*P1; 0; 100*P2^2/(P2+P1)/P2
*******; ********; *********; ***USBR GAGED RIVER FLOWS *****************
**USBRLC-14646,14650; 1601; Scheduled Flow; Colorado River at Parker Gage
(headgate Gen+bypass)
USBRLC; 1601; Flow; Colorado River at Parker Gage
USBRLC; 1405; Flow; Colorado River at Martinez Gage
USBRLC; 1401; Flow; Colorado River at Cibola Gage
COMPUTE-Hour; -1603; Flow; Parker Gage Lag 3 Hours 1601Lag180 Has History &
Schedule; 0; 0; P1
COMPUTE-Hour; -1601; Flow; Future Parker w/History Rsite -1603,-1602 if no
Schedule Use D>Now(); 0; 0; P1
*******; ********; *********; ***To HEADGATE HEC-RAS PROJECT*****************
COMPUTE-Put-Hour; -1601; FLOW; Colorado River at Parker Gage; 0;
C:\GetProjects\GetImperial\RAS_Cibola\Imperial.DSS
SHELL-C:\Program Files (x86)\HEC\HEC-RAS\6.6\Ras.exe; 0; Flow; Headgage to Polo
Verde HEC RAS; -1; C:\GetProjects\GetImperial\RAS_Headgate\Ry96pvhr.prj;
delete.bco01, hotstart
COMPUTE-Get; -1499; Flow; Palo Verde Dam Ras Outflow
*******; ********; *********; ***USGS RIVER FLOWS *****************
09429000; 1490; Flow; PALO VERDE CANAL NEAR BLYTHE, CA
COMPUTE-Hour; -1491; Flow; Future Palo Verde Canal; 0; 0; P1
COMPUTE-Hour; -1490; Flow; Future Palo Verde Canal w/USGS Gage History; 0; 0;
P1; D>=Now(); 0; P2
09429100; 1501; Flow; COLORADO RIVER BELOW PALO VERDE DAM, AZ
COMPUTE-Hour; -1500; Flow; Ras Outflow-canal at Palo Verde Dam; 0; 0; P1-P2
COMPUTE-Hour; -1495; Flow; Ras Outflow at Palo Verde Dam w/USGS Gage History; 0;
0; P1; D>=Now(); 0; P2
COMPUTE-Hour; -1501; Flow; Advance Palo Verde Gage; 0; 0; P1
09429155; 1502; Flow; PVID F-CANAL SPILL NEAR BLYTHE, CA
09429180; 1503; Flow; PVID D23 SPILL NEAR BLYTHE, CA
09429200; 1504; Flow; PVID C CANAL SPILL NEAR BLYTHE, CA
COMPUTE-Hour; -1505; Flow; Sum 3 PVID Spills (individual Missing Will Bomb
Routing); 0; 0; P1+P2+P3
COMPUTE-Hour; -1503; Flow; Sum 3 PVID Spills Lag 7 Days; 0; 0; P1
COMPUTE-Hour; -1504; Flow; Sum 3 PVID Spills Future w/History; 0; 0; P1;
D>=Now(); 0; P2
****COMPUTE-Hour; -1501; Flow; Future Palo Verde Gage; 0; FILL; P1
*******; ********; *********; ***To CIBOLA HEC-RAS PROJECT*****************
COMPUTE-Put-Hour; -1501; FLOW; Colorado River blw Palo Verde Dam; 0;
C:\GetProjects\GetImperial\RAS_Cibola\Imperial.DSS
****COMPUTE-Put-Hour; 1502; Flow; PVID F-CANAL SPILL NEAR BLYTHE, CA; 0;
C:\GetProjects\GetImperial\RAS_Cibola\Imperial.DSS
****COMPUTE-Put-Hour; 1503; Flow; PVID D23 SPILL NEAR BLYTHE, CA; 0;
C:\GetProjects\GetImperial\RAS_Cibola\Imperial.DSS
COMPUTE-Put-Hour; -1504; Flow; PVID C CANAL SPILL NEAR BLYTHE, CA; 0;
C:\GetProjects\GetImperial\RAS_Cibola\Imperial.DSS
COMPUTE-Put-Hour; -30103; RUNOFF; Sub3 Lower Milpitas Wash; 0;
C:\GetProjects\GetImperial\RAS_Cibola\Imperial.DSS
COMPUTE-Put-Hour; -30104; RUNOFF; Sub4 Gould Wash, AZ-CA; 0;
C:\GetProjects\GetImperial\RAS_Cibola\Imperial.DSS
COMPUTE-Put-Hour; -30105; RUNOFF; Sub5 Mohave Wash; 0;
C:\GetProjects\GetImperial\RAS_Cibola\Imperial.DSS
COMPUTE-Put-Hour; -30106; RUNOFF; Sub6 Ehrenberg Wash; 0;
C:\GetProjects\GetImperial\RAS_Cibola\Imperial.DSS
SHELL-C:\Program Files (x86)\HEC\HEC-RAS\6.6\Ras.exe; 0; Flow; Cibola HEC RAS
Subs; -1; C:\GetProjects\GetImperial\RAS_PaloVerde\rimp91upper.prj;
delete.bco01, hotstart
COMPUTE-Get; -1400; Flow; Cibola Gage Ras Outflow
SHELL-C:\Program Files (x86)\HEC\HEC-RAS\6.6\Ras.exe; 0; Flow; Cibola HEC RAS
Base; -1; C:\GetProjects\GetImperial\RAS_PaloVerde_Base\rimp91upper.prj;
delete.bco01, hotstart
COMPUTE-Get; -1399; Flow; BASE FLOW Cibola Gage Ras Outflow
COMPUTE-Hour; -1398; Flow; Rainfall Runoff Side Inflows at Cibola Gage; 0; 0;
P1-P2
*******; ********; *********; ***To IMPERIAL HEC-RAS PROJECT*****************
**COMPUTE-Hour; -1410; Flow; Ras Outflow at Cibola w/USGS History; 0; 0; P2;
D>=Now(); 0; P1
COMPUTE-Hour; -1410; Flow; Ras Outflow at Cibola w/USGS History(dead gage); 0;
0; P1; P2>0; 0; P2
COMPUTE-Hour; -24401; Flow; All Side Inflow (gage-routed Base) at Cibola Gage;
0; 0; P1-P2
COMPUTE-Hour; -1401; Flow; Advance Cibola Gage; 0; FILL; P1
COMPUTE-Put-Hour; -1401; FLOW; Colorado River at Cibola Gage; 0;
C:\GetProjects\GetImperial\RAS_Cibola\Imperial.DSS
COMPUTE-Put-Hour; -1398; RUNOFF; Rainfall Runoff Side Inflow at Cibola Gage; 0;
C:\GetProjects\GetImperial\RAS_Cibola\Imperial.DSS
COMPUTE-Put-Hour; -30101; RUNOFF; Sub1 Martinez Wash; 0;
C:\GetProjects\GetImperial\RAS_Cibola\Imperial.DSS
COMPUTE-Put-Hour; -30102; RUNOFF; Sub2 Yuma Wash AZ-CA; 0;
C:\GetProjects\GetImperial\RAS_Cibola\Imperial.DSS
SHELL-C:\Program Files (x86)\HEC\HEC-RAS\6.6\Ras.exe; 0; Flow; Imperial HEC RAS
Subs; -1; C:\GetProjects\GetImperial\RAS_Cibola\y91imp.prj; delete.bco01,
hotstart
COMPUTE-Get; -1402; Flow; Imperial Dam Ras Outflow
SHELL-C:\Program Files (x86)\HEC\HEC-RAS\6.6\Ras.exe; 0; Flow; Imperial HEC RAS
Subs; -1; C:\GetProjects\GetImperial\RAS_Cibola_Base\y91imp.prj; delete.bco01,
hotstart
COMPUTE-Get; -1403; Flow; BASE FLOW Imperial Dam Ras Outflow
COMPUTE-Hour; -1404; Flow; Rainfall Runoff Side Inflow at Imperial Dam; 0; 0;
P1-P2
COMPUTE-Hour; -1420; Flow; Ras Outflow at Imperial w/USGS History; 0; 0; P1;
D>=Now(); 0; P2
COMPUTE-Hour; -24405; InFlow; All Side Inflow (gage-routed Base) at Martinez
Gage; 0; 0; P1-P2
*******; ********; *********; *** S H E L L *****************
SHELL-C:\GetProjects\GetImperial\GetGraphs\GetFromAccessNOW.exe rdaymax, -1398
-1404, -2, 6, MAXImperialNOW.txt, MyPassword; 0; Flow Data to Web; Put Flow Data
Text File on Web; 0
SHELL-C:\GetProjects\GetImperial\GetGraphs\GetFromAccessNOW.exe rday, -1398
-1404, -2, 6, AVGImperialNOW.txt, MyPassword; 0; Flow Data to Web; Put Flow Data
Text File on Web
SHELL-C:\GetProjects\GetImperial\GetNexrad\GetNexrad.exe -2 MyPassword; 0;
Picture; Imperial Nexrad Picture; 0
SHELL-C:\GetProjects\GetImperial\GetGraphs\GetGraphs.exe 4 MyPassword; 0;
Graphs; Imperial Getgraphs to Web; 0
END
(*) Some of our current values may not reflect actual conditions. Whud ya
want... a fix it again Tony?
Important Note: Nothing on this page is intended as
interpretation of any legal authority such as water rights and supply. This page
is intended solely as a demonstration of automated techniques in flood potential
monitoring and deliveries. The reader assumes all risk for any damages
whatsoever in connection with the access, use, quality, or performance of the
supplied data just so you know.
|
|